Fate of CMY-2-encoding plasmids introduced into the human fecal microbiota by 1
exogenous Escherichia coli
2
3
Mehreen Anjuma, Jonas Stenløkke Madsenb, Joseph Nesmeb, Bimal Janaa, Maria Wiesec, 4
Džiuginta Jasinskytėa, Dennis Sandris Nielsenc, Søren Johannes Sørensenb, Anders 5
Dalsgaarda, Arshnee Moodleya, Valeria Bortolaiad*, Luca Guardabassie#* 6
7
aDepartment of Veterinary and Animal Sciences, University of Copenhagen, Stigbøjlen 4,
8
1-20, 1870 Frederiksberg C, Denmark 9
bDepartment of Biology, University of Copenhagen 1, Building: 1-1-215, 2100 København
10
Ø, Denmark 11
c Department of Food Science, University of Copenhagen, Rolighedsvej 26, 1958
12
Frederiksberg C, Denmark 13
d National Food Institute, Technical University of Denmark, Kemitorvet, Building 204, 2800
14
Kgs. Lyngby, Denmark 15
eDepartment of Pathobiology and Population Sciences, The Royal Veterinary College, 16
Hawkshead Lane, North Mymms, Hatfield, Herts, AL9 7TA, UK 17
18
Running Title: Fate of CMY-2 plasmids in the human fecal microbiota 19
20
#corresponding author: Luca Guardabassi [email protected]
21
*contributed equally as senior authors 22
AAC Accepted Manuscript Posted Online 18 March 2019 Antimicrob. Agents Chemother. doi:10.1128/AAC.02528-18
Copyright © 2019 American Society for Microbiology. All Rights Reserved.
on April 5, 2019 by guest
http://aac.asm.org/
Abstract
24
The gut is a hot spot for transfer of antibiotic resistance genes from ingested exogenous 25
bacteria to the indigenous microbiota. The objective of this study was to determine the 26
fate of two nearly identical blaCMY-2-harboring plasmids introduced into the human fecal
27
microbiota by two Escherichia coli strains isolated from human and poultry meat, 28
respectively. The chromosome and the CMY-2-encoding plasmid of both strains were 29
labeled with distinct fluorescent markers (mCherry and GFP), allowing Fluorescence 30
Activated Cell Sorting (FACS)-based tracking of the strain and the resident bacteria that 31
have acquired its plasmid. Each strain was introduced into an established in vitro gut 32
model (CoMiniGut) inoculated with individual feces from ten healthy volunteers. Fecal 33
samples collected 2, 6 and 24 h after strain inoculation were analyzed by FACS and plate 34
counts. Although the human strain survived better than the poultry meat strain, both 35
strains transferred their plasmids to the fecal microbiota at concentrations as low as 102 36
CFU/mL. Strain survival and plasmid transfer varied significantly depending on inoculum 37
concentration and individual fecal microbiota. Identification of transconjugants by 16S 38
rRNA gene sequencing and MALDI-TOF mass spectrometry revealed that the plasmids 39
were predominantly acquired by Enterobacteriaceae such as E. coli and Hafnia alvei. Our 40
experimental data demonstrate that exogenous E. coli of human or animal origin can 41
readily transfer CMY-2-encoding IncI1 plasmids to the human fecal microbiota. Low 42
amounts of exogenous strain are sufficient to ensure plasmid transfer if the strain is able 43
to survive the gastric environment. 44
on April 5, 2019 by guest
http://aac.asm.org/
Introduction 45
The spread of β-lactamase-encoding plasmids conferring resistance to broad-spectrum 46
cephalosporins is of particular concern due to the clinical importance of these antibiotics 47
in human healthcare (1, 2). One of the β-lactamases most commonly reported in poultry 48
and other animal reservoirs is CMY-2 (3–5). Various studies suggest that CMY-2-encoding 49
plasmids of poultry origin may be transferred from animal to human bacteria via 50
consumption of contaminated poultry meat, as indicated by the detection of almost 51
identical plasmids in E. coli strains from humans, poultry and poultry meat (5–8). E. coli is 52
an integral part of the commensal gut microbiota in both animals and humans but also a 53
common cause of opportunistic infections. Thus, acquisition of exogenous CMY-2-54
encoding plasmids introduced into the gut microbiota by bacteria from food and other 55
sources can potentially lead to E. coli infections that cannot be treated with broad-56
spectrum cephalosporins. 57
The objective of this study was to determine the fate of two nearly identical CMY-2-58
encoding plasmids introduced into the human fecal microbiota by exogenous E. coli of 59
human (C20-GM) and poultry meat (1061-1-GM) origin. Strain survival and plasmid 60
transfer were studied over a period of 24 h using an established in vitro gut model called 61
the CoMiniGut that was inoculated with individual feces from ten human volunteers. In 62
addition to standard phenotypic counts, donor and transconjugant cells were counted 63
and sorted by Fluorescence-Activated Cell Sorting (FACS), allowing evaluation of plasmid 64
host range and transfer dynamics in the non-culturable fraction of the fecal microbiota. 65
66
on April 5, 2019 by guest
http://aac.asm.org/
Results 67
Preliminary experiments on strain inoculum 68
Five different concentrations of the human UTI strain C20-GM were tested in the in vitro 69
gut model CoMiniGut to determine the strain inoculum to be used in the following 70
experiments. These experiments were performed under oxic and anoxic conditions using 71
three randomly selected fecal samples (A, E, O). FACS analysis after 24 hour showed 72
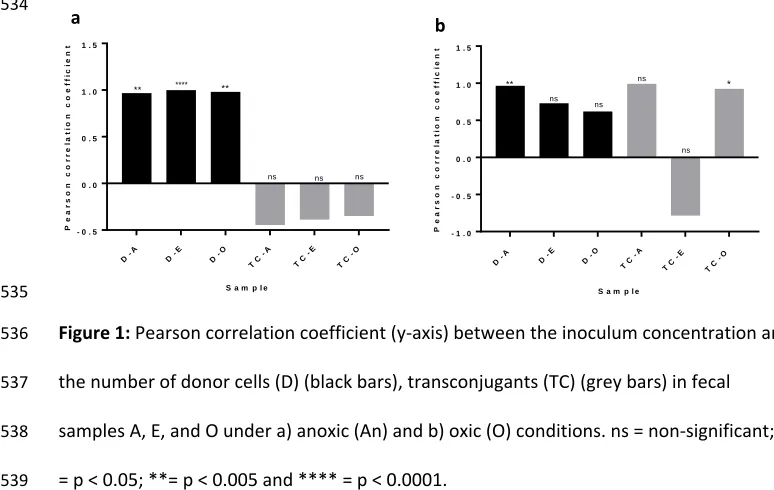
persistence of the exogenous strain in most all three fecal samples (Fig. S1). Pearson 73
correlation coefficients revealed a strong positive correlation between the inoculum 74
concentration and numbers of C20-GM cells under anoxic conditions (p-value = 0.007, 75
<0.0001 and 0.003 for sample A, E and O, respectively) (Fig 1a). Such correlation was also 76
statistically significant for sample A (p-value = 0.008) but not for samples E and O under 77
oxic conditions (Fig. 1b). 78
Transconjugants were detected in all tested conditions except in fecal samples A and E 79
using either a very low (10 CFU/mL) or very high (108 CFU/mL) inoculum under oxic 80
conditions (Fig. S2). Under anoxic conditions, the Pearson correlation coefficient indicated 81
moderate negative correlation between inoculum concentration and numbers of 82
transconjugants from all samples (Fig. 1a). This pattern was not observed under oxic 83
conditions, where a negative correlation was only observed for sample (E) and was not 84
statistically significant (Fig. 1b). 85
The lowest inoculum at which both donors and transconjugants were detected in all 86
samples was 102 CFU/ml in both oxic and anoxic conditions. Based on these results, we 87
chose to use this inoculum concentration in the following experiments. 88
on April 5, 2019 by guest
http://aac.asm.org/
Experiments on strain survival and plasmid transfer 89
CoMiniGut cultures of 10 fecal samples from healthy volunteers were inoculated 90
separately with the poultry meat strain (1061-1-GM) and the human strain (C20-GM), and 91
incubated under anoxic conditions. Samples were collected at 2, 6 and 24 h after strain 92
inoculation and analyzed in FACS to quantify donor (red fluorescence) and transconjugant 93
(green fluorescence) cells. 94
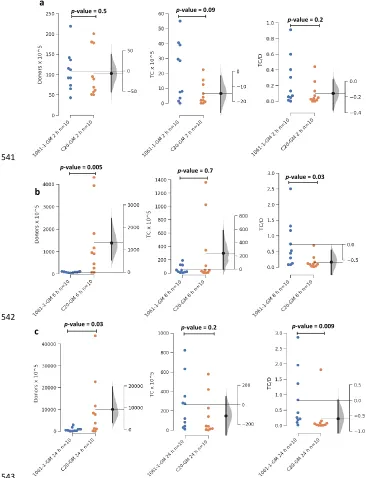
After 2 h, both strains were detected in all samples (range 33-227 for 1061-1-GM and 45-95
231 for C20-GM), and transconjugants were detected in all but one sample for 1061-1-GM 96
(range 0-68) and in all but two samples for C20-GM (range 0-28) (Fig. 2a). 97
After 6 h, donor numbers were significantly lower for 1061-1-GM (range 23-178) than for 98
C20-GM (range 52-5572) (p-value = 0.005). Even though the numbers of transconjugants 99
did not significantly differ between the two strains (range 1-242 for 1061-1-GM and 2-100
1772 for C20-GM), the transconjugant/donor ratio was significantly higher for 1061-1-GM 101
(range 0.1-3.46) than for C20-GM (range 0.0005-0.45) (p-value = 0.03) (Fig. 2b). After 24 102
h, the numbers of 1061-1-GM (range 31-3744) were still significantly lower than for C20-103
GM (range 19-46310) (p-value = 0.03). At this time point, transconjugants were detected 104
in all samples without significant differences between the two strains (range 8-846 and 1-105
661, respectively) but the transconjugant/donor ratio persisted to be significantly higher 106
for 1061-1-GM (range 0.007-3.6) than for C20-GM (range 0.00002-1.9) (p-value= 0.009) 107
(Fig. 2c). Altogether, the different survival dynamics displayed by the two strains in 108
human feces did not affect their ability to transfer IncI1 CMY-2-encoding plasmids to the 109
indigenous microbiota. 110
on April 5, 2019 by guest
http://aac.asm.org/
Influence of the initial Enterobacteriaceae concentration on survival of exogenous E.
111
coli
112
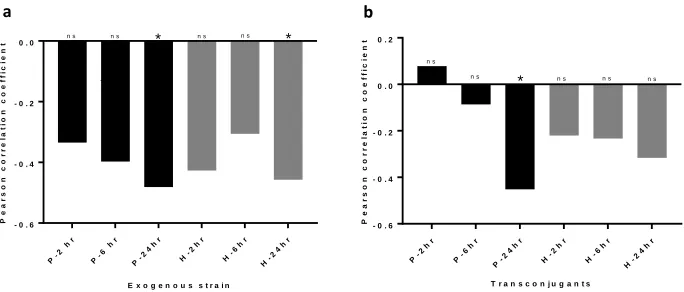
The correlation between numbers of the two exogenous E. coli strains measured by FACS 113
at the three different time points were compared to the initial Enterobacteriaceae counts 114
(Table S1) to determine if strain’s survival was influenced by the concentration of 115
indigenous Enterobacteriaceae in the recipient fecal sample. In general, there was a 116
negative correlation between counts of pre-existing Enterobacteriaceae and survival of 117
both exogenous strains, although such a negative correlation was statistically significant 118
only after 24 h (p-values= 0.03 for 1061-1-GM and 0.04 for C20-GM) (Fig. 3a). Limited to 119
strain 1061-1, the Pearson correlation coefficient showed a significant negative 120
correlation between counts of pre-existing Enterobacteriaceae and numbers of 121
transconjugants detected by FACS after 24 h (p-value= 0.04) (Fig. 3b). 122
123
Bacterial community composition of different fecal samples 124
Bacterial community composition was determined by 16S rRNA gene amplicon 125
sequencing. This analysis was performed in the 10 fecal samples stocks as well as 24 h 126
after the samples were inoculated with the exogenous strains in CoMiniGut, including all 127
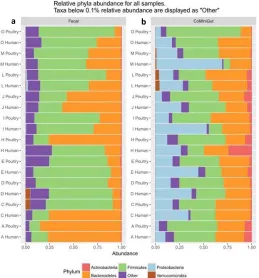
biological replicates (n = 30 per strain). The initial bacterial community composition varied 128
between fecal samples with either Firmicutes or Bacteriodetes being the dominant 129
phylum (Fig. 4a). The abundance of Proteobacteria increased in all samples during 130
CoMiniGut culture, most likely due to the experimental conditions favoring fast-growing 131
bacteria, but the magnitude of this increase varied markedly between samples (Fig. 4b). 132
on April 5, 2019 by guest
http://aac.asm.org/
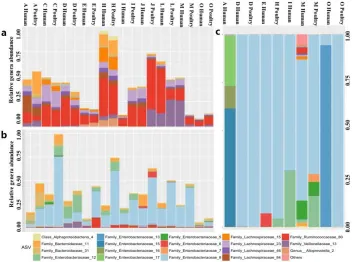
Abundance of relative amplicon sequence variants (ASV) found in sorted transconjugants 133
was compared to abundance of those ASVs in the fecal samples and CoMiniGut samples. 134
The most recovered ASVs in sorted transconjugants were not common in the initial fecal 135
community and only moderately enriched after 24 h incubation in the CoMiniGut yet the 136
plasmid was acquired predominantly by specific ASVs from Enterobacteriaceae (Fig. 5). 137
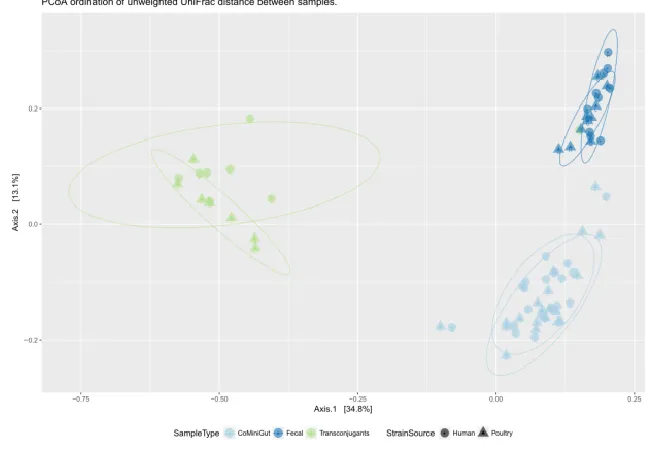
Principal Coordinates Analysis (PCoA) of the unweighted UniFrac distance matrix based 138
on ASV counts for all samples showed that the bacterial communities from the initial 139
fecal sample, after 24 h CoMiniGut incubation and from sorted transconjugants formed 140
tight clusters and that this grouping was significant (p-value<0.001) based on 141
permutational multivariate analysis of variance of the UniFrac distance matrix (Fig. 6). 142
143
Bacterial recipients of plasmids 144
The diversity of transconjugants was investigated by 16S rRNA gene amplicon sequencing 145
of the green cells isolated by FACS (gate P7). This was done on samples in which the 146
transconjugant population was at least 0.1% of the 100,000 bacteria that were analyzed 147
by FACS (D, E, H, M and O for 1061-1-GM, and A, D, E, I, M and O for C20-GM). The most 148
abundant ASVs belonged to the Enterobacteriaceae with multiple sequence variants 149
detected in all samples except for sample D after inoculation of both strains and sample O 150
after inoculation of 1061-1-GM. The transconjugants detected in sample M after 151
inoculation of C20-GM were more diverse compared to other samples and included 152
Gram-negative Bacteroidaceae Alloprevotella and Gram-positive Lachnospiraceae and 153
Ruminococcaeae (Fig. 6). 154
on April 5, 2019 by guest
http://aac.asm.org/
Additionally, non-red cells (n=106) were sorted from all CoMiniGut cultures after 24 h and 155
plated on blood agar plates supplemented with kanamycin and cefotaxime for isolation of 156
presumptive transconjugants. Isolates where the presence of the donor plasmid was 157
confirmed by PCR targeting the region upstream and downstream of the GFP cassette and 158
by confocal microscopy for green fluorescence were identified to the species level by 159
MALDI-TOF MS. Following inoculation of 1061-1-GM, transconjugants were isolated from 160
samples D (n=24), E (n=15), H (n=8) and M (n=46), and all transconjugant isolates were 161
identified as E. coli. After inoculation of C20-GM, transconjugants were detected in 162
samples D (n=22), E (n=10), H (n=16), M (n=30) and O (n=12), and all transconjugant 163
isolates were E. coli with the exception of transconjugants from sample O that were 164
identified as Hafnia alvei, another member of the Enterobacteriaceae family. 165
166
Discussion 167
We investigated horizontal gene transfer of the GFPmut3-tagged IncI1/pST12 CMY-2-168
encoding plasmids from exogenous E. coli of human and poultry origin to the fecal 169
bacterial communities from 10 human donors. GFPmut3-expressing transconjugant cells 170
were isolated by FACS, allowing transconjugant detection and identification in spite of 171
their relative low abundance in the CoMiniGut model. This model was used to simulate 172
the colon environment and mimic the effect of ingesting exogenous CMY-2-producing E. 173
coli from contaminated food or by the fecal-oral route. Our results indicate that CMY-2-174
encoding IncI1 plasmids can readily transfer to the indigenous fecal microbiota at 175
inoculum concentrations as low as 100 CFU (Fig. S1 and S2). This finding highlights the 176
on April 5, 2019 by guest
http://aac.asm.org/
possibility that low numbers of exogenous strains are sufficient to transfer blaCMY-2 to the
177
resident gut microbiota, provided that the strains are able to survive the gastric 178
environment of the stomach and reach the colon. 179
Gut colonization by exogenous strains is not a prerequisite for plasmid transfer as 180
indicated by the early detection of transconjugants shortly (2 h) after strain inoculation in 181
eight of the ten fecal samples tested. Accordingly, even a brief transit of exogenous E. coli 182
through the colon may lead to acquisition of CMY-2-encoding IncI1 plasmids by the 183
indigenous microbiota. This is important from a public health point of view because once 184
the plasmid has transferred to a resident recipient; the resulting transconjugant can itself 185
act as donor. 186
The numbers of strain detected in FACS after 6 h and 24 h in the fecal microbiota from 187
human volunteers indicated that the human strain survived better compared to the strain 188
isolated from poultry meat (Fig. 2 and Fig. S3). Based on multilocus sequence typing 189
(MLST), both strains belonged to sequence types (ST155 and ST10 for the human and 190
poultry strain, respectively) frequently detected among E. coli from food, animals and 191
humans worldwide (9, 10). Even though the general composition of the fecal microbiota is 192
similar between humans and other vertebrates, the poultry fecal microbiota significantly 193
differs from human fecal microbiota (11). Perhaps the strain from human UTI was more 194
adapted to survive within human fecal microbiota than the poultry meat strain. However, 195
this observation cannot be generalized since only single strains of human and poultry 196
origin were tested. 197
on April 5, 2019 by guest
http://aac.asm.org/
The numbers of transconjugant detected from poultry meat strain were higher than from 198
human UTI strain. The transconjugant/donor ratio was also higher for the poultry meat 199
strain because of the high numbers of transconjugants and lower numbers of donors than 200
the human strain for all samples except one (D) (Fig 2 and Fig. S3). The plasmid transfer 201
efficiency was likely similar for both strains in human fecal microbiota. Indeed, in the in 202
vitro experiments with lab strain both strains had the transfer efficiency 10-5 203
transconjugant per donor cell (12). The plasmid transfer thus was not dependent on the 204
concentration of the exogenous strain but on transconjugant survival and secondary 205
transfer. Relatively high conjugation frequencies in the range of 10-2-10-6 206
transconjugants/recipients have been previously reported for IncI1 plasmids (13), which 207
are highly prevalent in Enterobacteriaceae (14). 208
Several studies have documented in vivo plasmid transfer from a donor of animal origin to 209
a human recipient strain (15–18) but in all these experiments the in vivo models were fed 210
with high numbers of donor and recipient strains (107-109 CFU). Such high numbers of E. 211
coli are unlikely to be ingested via food in real life. A previous study conducted in Belgium 212
reported 7% and 3% likelihood of humans being exposed to 10 CFU or 100 CFU ESBL-213
producing E. coli from poultry meat, respectively (19). Evers et al. (2016) showed only a 214
6.9% chance that humans can be exposed to 1 CFU of bacteria through consumption of 215
poultry meat (20). Thus, the inoculum size of 102CFU/mL (500 CFU) used in our study is 216
more realistic considering the information on human exposure to this type of bacteria, 217
and the expected reduction of the initial inoculum present on poultry meat due to 218
on April 5, 2019 by guest
http://aac.asm.org/
washing and/or cooking, as well as to the low pH in the stomach (pH=2), which acts as a 219
natural barrier to ingested microbes. 220
The FACS-sorted transconjugants were predominantly identified as members of 221
Enterobacteriaceae, which is consistent with the narrow host range of IncI1 plasmids (14) 222
(Fig. 6). Various anaerobic phyla seemed to acquire the IncI1 plasmid from the human UTI 223
strain in sample M. However, these presumptive anaerobic transconjugants were not 224
verified by cultivation as the agar plates were only incubated under aerobic conditions. 225
The presence of IncI1 plasmids in species other than Enterobacteriaceae has not been 226
shown before but most of the previous studies relied on culture-based detection of 227
transconjugants and did not investigate the fate of these plasmids in complex bacterial 228
communities such as those residing in human feces. 229
Correlation coefficients between the initial Enterobacteriaceae population and donor 230
survival along with plasmid transfer indicated a moderate negative correlation for both 231
1061-1-GM and C20-GM (Fig. 4). E. coli are less efficient at establishing themselves in 232
microbiomes when there are higher numbers of Enterobacteriaceae already present in 233
the population possibly because they compete for the same ecological niche. 234
As the experimental setup was limited to 24 h, it is impossible to determine whether the 235
magnitude of plasmid transfer and the number of bacterial taxa involved would have 236
increased if the experiment was continued for a longer period. It should be noted that our 237
experimental setup cannot differentiate between primary transconjugants that have 238
obtained the plasmid from the exogenous donor strain and those that have acquired the 239
plasmid from primary transconjugants acting as donors. In addition, our approach cannot 240
on April 5, 2019 by guest
http://aac.asm.org/
distinguish between horizontal and vertical transfer since the transconjugants detected in 241
our experiment may well represent the offspring of transconjugants transmitting the 242
acquired plasmid vertically. Consequently, the observed variations in numbers of 243
transconjugants do not necessary directly reflect the plasmid transfer frequencies, which 244
are generally estimated within one or two bacterial generation times. Another limitation 245
of the study is the antibiotic concentration used for the culture-based detection of 246
transconjugants, which was selected based on breakpoints specific for 247
Enterobacteriaceae. Thus, transconjugants belonging to other bacterial families could fail 248
to grow at these antibiotic concentrations because resistance genes are usually poorly 249
expressed in distantly related heterologous hosts (21). 250
ASV sequences identified in transconjugants, belonging predominantly to 251
Enterobacteriaceae were present at very low abundance in the initial fecal sample. Such 252
Enterobacteriaceae populations increased after 24 h incubation in the CoMiniGut, but the 253
transfer of plasmids primarily to Enterobacteriaceae also points towards the narrow host 254
range of IncI1 plasmids (Fig. 5). The enrichment of the Proteobacteria in CoMiniGut 255
cultures was mainly due to the experimental conditions (24 h culture) because they are 256
among the fastest growing bacteria. 257
We conclude that the foodborne and fecal-oral transmission is a possible route for 258
transfer of antibiotic resistance IncI1 CMY-2-encoding plasmids carried by exogenous E. 259
coli, provided that the host strain survives cooking and stomach pH, even if in small 260
numbers. To further assess this risk, in vivo quantitative studies are needed to evaluate 261
on April 5, 2019 by guest
http://aac.asm.org/
the effect of the stomach environment on concentrations of E. coli strains transiting 262
through the gut. 263
264
Methods 265
Strains and media 266
The two genetically modified human and poultry meat E. coli strains used in this study 267
(C20-GM and 1061-GM, respectively) were constructed and validated previously (12). The 268
strains are typed as ST155 (C20-GM) and ST10 (1061-GM) by MLST and harbor blaCMY-2 on
269
IncI1 plasmids of sequence type (pST) 12 sharing 99% nucleotide identity over 97% of the 270
length of the plasmid (European Nucleotide Archives accession number PRJEB9625) (5). 271
The strains were genetically modified by inserting a mCherry fluorescent marker (red) in 272
the pseudogene ybeM on the chromosome and GFP fluorescent marker (green) in a non-273
coding region on the IncI1 plasmid (12). 274
Media used were Luria Bertani broth (LB-B), Luria Bertani agar (LB-A), MacConkey agar, 275
5% blood agar (Oxoid Ltd.,Roskilde, Denmark), and complex colon media were prepared 276
according to Macfarlane et al. (1998) (22). Antibiotics were used at the following 277
concentrations throughout the work unless mentioned otherwise: 1 mg/L of cefotaxime 278
and 50 mg/L of kanamycin. 279
Phosphate buffer saline (PBS) 1 M, pH = 7 was prepared as follows (g/L): NaCl, 8; KCl, 0.2; 280
Na2HPO4·2H2O, 1.44; KH2PO4, 0.24 in distilled H2O. PBS 0.1 M pH = 5.6 was prepared from
281
the PBS 1 M stock. NaCl 0.9% solution (g/L) in distilled H20. All chemicals were obtained
282
on April 5, 2019 by guest
http://aac.asm.org/
from the company Sigma-Aldrich (Søborg, Denmark) unless otherwise stated. All solutions 283
were autoclaved before using. 284
285
Fecal samples 286
Fecal samples were collected from 10 healthy human volunteers not exposed to 287
antibiotics during the last six months. Their ages ranged from 5 to 68 years. Ethical 288
permission for collection of these samples was waived by the Danish National committee 289
on health research ethics. The samples were delivered to the laboratory immediately 290
after collection and kept at -20 °C until processing. All samples were processed within 24 291
h after they were received. Feces were weighed and equal amount w/v of 20% 292
glycerol/0.1 M PBS solution was added prior to homogenization in a stomacher for 2 x 60 293
sec. The resulting fecal suspensions were labeled and frozen in cryotubes at -80 °C. 294
Immediately before the start of the experiment, each suspension was thawed and diluted 295
1:5 with 0.1 M PBS at pH 5.6 (working stock). 296
297
CoMiniGut experiments 298
CoMiniGut is an in vitro system that simulates the colon passage of the human gut (23). 299
The CoMiniGut has five vessels running in parallel. Each vessel, which has a total of 5 ml 300
volume comprising of media, fecal sample and donor strain, was inoculated with 10% v/v 301
of fecal sample in the complex colon medium. During 24 h the pH increased from 5.7 to 302
6.0 in the first 8 h to simulate the proximal colon. Then in the following 8 h it increased to 303
6.5 to represent transverse colon and finally it reached 6.9 in the last 8 h to simulate 304
on April 5, 2019 by guest
http://aac.asm.org/
distal colon environment. Preliminary experiments were performed using the human 305
strain C20-GM to determine the strain inoculum concentration. These experiments were 306
performed in oxic and anoxic conditions. Briefly, three fecal samples (A, E, O) were 307
randomly selected and challenged with C20-GM to reach five different concentrations of 308
C20-GM (108, 106, 104, 102 and 10 CFU/mL) in each CoMiniGut vessel. 309
The lowest inoculum concentration for which the donor was detected 24 h after 310
inoculation was selected for the final experiment, where all the 10 fecal samples were 311
independently challenged with C20-GM and 1061-1-GM under anoxic conditions. The 312
experimental design was set up to mimic the colon environment of human gut. A volume 313
of 300 µl was collected from each vessel 2, 6 and 24 h after strain inoculation in the 314
CoMiniGut. All experiments were run in two biological replicates. The average value from 315
biological replicates was used for further analysis. 316
317
Cell collection and multiple-gated FACS of transconjugants 318
All samples from the CoMiniGut experiments were analyzed by flow cytometer FACSAria 319
IIIu (Becton Dickinson Biosciences, San Jose, CA, USA). Samples from anoxic cultures were 320
diluted 100-fold in 1M PBS pH 7 and exposed to oxygen by shaking at 110 rpm at 4 °C for 321
up to 3 h. This allowed the fluorescent proteins to mature properly before FACS analysis 322
(24). The settings used were the same as described by Anjum et al., (2018) (12). All 323
samples were diluted in 0.9% NaCl to ~2000 counting events s1 before FACS to assure for 324
optimal detection of donors and sorting of transconjugants. Control laboratory strains 325
expressing only mCherry or GFP or without any fluorescent marker were used to design 326
on April 5, 2019 by guest
http://aac.asm.org/
gates for analysis with FACS. Six gates were defined in bivariate plots to sort for detection 327
of donors and sorting for transconjugants. On the side scatter-A vs forward scatter-A plot, 328
a gate for only particles of bacterial size was selected. On the PE-Texas Red-A vs side 329
scatter-A plot a gate was set that covered all red fluorescent particles and on the 330
duplicate plot the same gate was set to detect and sort non-red fluorescent particles. On 331
the FITC-A vs side scatter-A plot, a gate was set that covered all green fluorescent 332
particles. As the particles from fecal sample and media auto-fluoresced, thus interfering 333
with the gates selected for detection of mCherry and GFPmut3, a more stringent gate (P7) 334
was selected for sorting as follows. On the FITC-A vs side scatter-A plot a gate was set up 335
based on GFP expressing control lab strain in complex colon media that covered 336
transconjugants with highest GFP expression. An additional non-red gate on the PE-Texas 337
Red-A vs FITC-A plot, ensured exclusion of small auto-fluorescent particles from fecal 338
sample, media or leaking donors to sort out only transconjugants. This may have resulted 339
in loss of sorting of some transconjugants that did not have a high GFP expression but 340
ensured that the cells sorted were indeed the correct transconjugants. The threshold for 341
detection was set at 100,000 counting events thereby the numbers of donors and 342
transconjugants from FACS analysis are given out of 105 cells analyzed in FACS. 343
For each sample sorted, a minimum of 15,000 and a maximum of 30,000 transconjugants 344
were sorted. The cut off for sorting of transconjugants was set so that it was performed 345
only for the samples from one time point, in which the numbers of transconjugants 346
detected were at least 0.1% of the whole population in gate P7. Sorted cells were 347
on April 5, 2019 by guest
http://aac.asm.org/
collected in 5 mL sterile polystyrene round-bottom Falcon tubes with 0.5 mL of 0.9% NaCl 348
solution. 349
Sorting was also performed for isolation of 106 cells that were not red for all samples from 350
both biological replicates. This fraction was plated on blood agar plates containing 351
cefotaxime and kanamycin and incubated in anoxic conditions at 37 °C overnight. All 352
colonies were observed with confocal microscopy to detect green and red fluorescence. 353
The green colonies were subjected to PCR targeting the region on plasmid where the 354
GFPmut3 cassette was inserted using primers Fwd pC20/1061-1 confirm and Rev 355
pC20/1061-1 confirm (12). All PCR-positive colonies were identified to species level by 356
matrix-assisted laser desorption/ionization time-of-flight mass spectrophotometry 357
(MALDI-TOF MS) (BioMérieux, France). 358
359
Sequence-based analysis of fecal microbiota 360
Microbial community profiling was performed on fecal samples prior to CoMiniGut 361
experiments, after 24 hour CoMiniGut incubation and on the FACS-sorted transconjugants 362
(from gate P7) by 16S rRNA marker gene amplicon sequencing. 363
DNA from the original fecal sample and from the 24-hour CoMiniGut culture was 364
extracted by DNeasy Power Soil kit (Qiagen, Denmark) according to manufacturer’s 365
instructions. DNA was used for amplicon high throughput sequencing of the 16S rRNA 366
gene using a MiSeq benchtop sequencer (Illumina, CA, USA). Amplicon libraries were 367
obtained after a PCR reaction targeting the hypervariable V3 region of the 16S rRNA gene. 368
on April 5, 2019 by guest
http://aac.asm.org/
Amplicon libraries for transconjugants analysis were performed by PCR of the cell pellets 369
using the GenePurgeDirect (Nimagen) direct PCR kit. Sorted cells were transferred to 1.5 370
mL Eppendorf tubes and centrifuged at 10 000 g for 30 min to collect cell pellets. The 371
supernatant was carefully removed, cell pellet suspended in 20 µl of GenePurgeDirect 372
lysis matrix. The cell lysis mixture slurries were then transferred to 0.2 mL amplification 373
tubes. Cell lysis was performed in the thermal cycler using manufacturer’s instructions. 374
PCR reactions were performed with 5µL of lysis mixture using primers targeting bacterial 375
and archaeal 16S rRNA gene V3 region with overhanging adapters compatible with the 376
Nextera Index Kit (Illumina): rNXt_388_F:5’- 377
TCGTCGGCAGCGTCAGATGTGTATAAGAGACAGACWCCTACGGGWGGCAGCAG -3’ and 378
NXt_518_R: 5’GTCTCGTGGGCTCGGAGATGTGTATAAGAGACAGATTACCGCGGCTGCTGG -379
3’ (adapters in bold) the PCR reactions and library preparations were conducted as 380
described previously (25). All individual sample libraries were then pooled in equimolar 381
proportion and sequenced using MiSeq v2 sequencing kit producing 2x250 bp paired-end 382
reads on an Illumina MiSeq benchtop sequencer following manufacturer’s guidelines. 383
Amplicon sequences were analyzed using phyloseq R package (26) and used the following 384
additional R packages: vegan, ggplot2 (27, 28). Unweighted UniFrac distances where 385
computed using phyloseq implementation of Fast Unifrac (29). Raw amplicon reads were 386
denoised and clustered in ASV using DADA2 (30) implementation in QIIME2. Each unique 387
sequence is classified against SILVA NR99 rel. 132 SSU database (31) using q2-feature-388
classifier naïve Bayes classifier (32) at the lowest taxonomical rank up to the Genus level 389
with a confidence threshold of 0.7. Each ASV sequence present above a cumulated 390
on April 5, 2019 by guest
http://aac.asm.org/
abundance of 0.05% of reads in transconjugants samples were further identified manually 391
using manual BLAST searches (Table S2). 392
393
Culture-based analysis of fecal samples 394
For the culture-based analysis of species diversity within Enterobacteriaceae, 100 µl from 395
the working stock solution of each fecal sample was spread MacConkey agar plates with 396
or without cefotaxime. At least one colony per morphology observed on MAC agar plate 397
was analyzed by MALDI-TOF. 398
399
Statistical methods 400
The Pearson correlation coefficient was calculated using Microsoft Excel software to 401
assess the relationship of inoculum concentrations with number of donors and 402
transconjugants and transconjugants/donors ratio. The cut off for negative correlation 403
was set at r = > -0.25 and for positive correlation r = < 0.25. 404
The Gardner-Altman two-group mean-difference plots were drawn using web application: 405
http://www.estimationstats.com/#/, which is based on data analysis using
Bootstrap-406
coupled ESTimation (DABEST) (33). Statistical significance was set at p < 0.05. The 407
reference group in all analysis was assigned to the 1061-1-GM strain and the 408
experimental group was C20-GM strain. 409
410
on April 5, 2019 by guest
http://aac.asm.org/
Funding: This work was funded by the University of Copenhagen Research Center for 411
Control of Antibiotic Resistance (UC-Care, www.uc-care.ku.dk) and by the Center for 412
Research in Pig Production and Health (CPH Pig, http://cphpig.ku.dk). The work by JSM, JN 413
and SJS was funded by the Joint Programming Initiative on Antimicrobial Resistance and 414
the Danish Innovation Foundation (JPIAMR CoFund 2016, DARWIN Project 7044-00004B) 415
and the Lundbeckfonden (SHARE, R250-2017-1392). 416
417
Conflict of Interest: The authors declare that they have no conflict of interest. 418
419
Ethical Approval: This article does not contain any studies with human participants or 420
animals performed by any of the authors. Ethical permission for collection of fecal 421
samples from human volunteers was waived by the Danish National committee on health 422
research ethics. 423
424
References 425
1. Report AJ. 2017. ECDC/EFSA/EMA first joint report on the integrated analysis of the 426
consumption of antimicrobial agents and occurrence of antimicrobial resistance in 427
bacteria from humans and food-producing animals. EFSA J 15:4872. 428
2. Mathers AJ, Peirano G, Pitout JDD. 2015. Escherichia coli ST131: The quintessential 429
example of an international multiresistant high-risk clone. Adv Appl Microbiol 19:109-154. 430
3. Dierikx CM, Van Der Goot JA, Smith HE, Kant A, Mevius DJ. 2013. Presence of 431
ESBL/AmpC -producing Escherichia coli in the broiler production pyramid: A descriptive 432
on April 5, 2019 by guest
http://aac.asm.org/
study. J Antimicrob Chemother 68:60-67. 433
4. Bortolaia V, Hansen KH, Nielsen CA, Fritsche TR, Guardabassi L. 2014. High diversity of 434
plasmids harbouring blaCMY-2 among clinical Escherichia coli isolates from humans and 435
companion animals in the upper Midwestern USA. J Antimicrob Chemother 69:1492– 436
1496. 437
5. Hansen KH, Bortolaia V, Nielsen CA, Nielsen JB, Schonning K, Agerso Y, Guardabassi L. 438
2016. Host-specific patterns of genetic diversity among IncI1-I gamma and IncK plasmids 439
encoding CMY-2 beta-Lactamase in Escherichia coli Isolates from humans, poultry meat, 440
poultry, and dogs in Denmark. Appl Environ Microbiol 82:4705–4714. 441
6. Börjesson S, Jernberg C, Brolund A, Edquist P, Finn M, Landén A, Olsson-Liljequist B, 442
Tegmark Wisell K, Bengtsson B, Englund S. 2013. Characterization of plasmid-mediated 443
ampc-producing E. coli from swedish broilers and association with human clinical isolates. 444
Clin Microbiol Infect 19:E309-E311. 445
7. de Been M, Lanza VF, de Toro M, Scharringa J, Dohmen W, Du Y, Hu J, Lei Y, Li N, 446
Tooming-Klunderud A, Heederik DJJ, Fluit AC, Bonten MJM, Willems RJL, de la Cruz F, van 447
Schaik W. 2014. Dissemination of cephalosporin resistance genes between Escherichia coli 448
strains from farm animals and humans by specific plasmid lineages. PLoS Genet 449
10:e1004776. 450
8. Berg ES, Wester AL, Ahrenfeldt J, Mo SS, Slettemeås JS, Steinbakk M, Samuelsen, Grude 451
N, Simonsen GS, Løhr IH, Jørgensen SB, Tofteland S, Lund O, Dahle UR, Sunde M. 2017. 452
Norwegian patients and retail chicken meat share cephalosporin-resistant Escherichia coli 453
and IncK/blaCMY-2 resistance plasmids. Clin Microbiol Infect 23:407.e9-e15. 454
on April 5, 2019 by guest
http://aac.asm.org/
9.Manges AR, Johnson JR. 2012. Food-borne origins of escherichia coli causing 455
extraintestinal infections. Clin Infect Dis 55:712–719. 456
10. Skurnik D, Clermont O, Guillard T, Launay A, Danilchanka O, Pons S, Diancourt L, 457
Lebreton F, Kadlec K, Roux D, Jiang D, Dion S, Aschard H, Denamur M, Cywes-Bentley C, 458
Schwarz S, Tenaillon O, Andremont A, Picard B, Mekalanos J, Brisse S, Denamur E. 2016. 459
Emergence of antimicrobial-resistant Escherichia coli of animal origin spreading in 460
humans. Mol Biol Evol 33:898–914. 461
11. Lee JE, Lee S, Sung J, Ko G. 2011. Analysis of human and animal fecal microbiota for 462
microbial source tracking. ISME J 5:362-365 463
12. Anjum M, Madsen JS, Espinosa-Gongora C, Jana B, Wiese M, Nielsen DS, Sørensen SJ, 464
Moodley A, Bortolaia V, Guardabassi L. 2018. A culture-independent method for studying 465
transfer of IncI1 plasmids from wild-type Escherichia coli in complex microbial 466
communities. J Microbiol Methods 152:18–26. 467
13. Mo SS, Sunde M, Ilag HK, Langsrud S, Heir E. 2017. Transfer Potential of Plasmids 468
Conferring Extended-Spectrum-Cephalosporin Resistance in Escherichia coli from Poultry 469
83:1–11. 470
14. Carattoli A. 2009. Resistance plasmid families in Enterobacteriaceae. Antimicrob 471
Agents Chemother. 472
15. Moubareck C, Bourgeois N, Courvalin P. 2003. Multiple antibiotic resistance gene 473
transfer from animal to human Enterococci in the digestive tract of gnotobiotic mice. 474
Antimicrob Agents Chemother 47:2993–2996. 475
16. Trobos M, Lester CH, Olsen JE, Frimodt-Møller N, Hammerum AM. 2009. Natural 476
on April 5, 2019 by guest
http://aac.asm.org/
transfer of sulphonamide and ampicillin resistance between Escherichia coli residing in 477
the human intestine. J Antimicrob Chemother 63:80–86. 478
17. Faure S, Perrin-Guyomard A, Delmas JM, Chatre P, Laurentie M. 2010. Transfer of 479
plasmid-mediated CTX-M-9 from Salmonella enterica serotype virchow to 480
Enterobacteriaceae in human flora-associated rats treated with cefixime. Antimicrob 481
Agents Chemother 54:164–169. 482
18. Sparo M, Urbizu L, Solana M V., Pourcel G, Delpech G, Confalonieri A, Ceci M, Sánchez 483
Bruni SF. 2012. High-level resistance to gentamicin: Genetic transfer between 484
Enterococcus faecalis isolated from food of animal origin and human microbiota. Lett Appl 485
Microbiol 54:119–125. 486
19. Depoorter P, Persoons D, Uyttendaele M, Butaye P, De Zutter L, Dierick K, Herman L, 487
Imberechts H, Van Huffel X, Dewulf J. 2012. Assessment of human exposure to 3rd 488
generation cephalosporin resistant E. coli (CREC) through consumption of broiler meat in 489
Belgium. Int J Food Microbiol 159:30–38. 490
20. Evers EG, Pielaat A, Smid JH, Van Duijkeren E, Vennemann FBC, Wijnands LM, Chardon 491
JE. 2017. Comparative exposure assessment of ESBL-producing Escherichia coli through 492
meat consumption. PLoS One 12:e0169589. 493
21. Glick BR. 1995. Metabolic load and heterologous gene expression. Biotech Adv 494
13:247–261. 495
22. Macfarlane GT, Macfarlane S, Gibson GR. 1998. Validation of a three-stage compound 496
continuous culture system for investigating the effect of retention time on the ecology 497
and metabolism of bacteria in the human colon. Microb Ecol 35:180–187. 498
on April 5, 2019 by guest
http://aac.asm.org/
23. Wiese M, Khakimov B, Nielsen S, Sørensen H, van den Berg F, Nielsen DS. 2018. 499
CoMiniGut—a small volume in vitro colon model for the screening of gut microbial 500
fermentation processes. PeerJ 6:e4268. 501
24. Pinilla-Redondo R, Riber L, Sørensen SJ. 2018. Fluorescence recovery allows the 502
implementation of a fluorescence reporter gene platform applicable for the detection and 503
quantification of horizontal gene transfer in anoxic environments. Appl Environ Microbiol 504
84:e02507-17. 505
25. Krych Ł, Kot W, Bendtsen KMB, Hansen AK, Vogensen FK, Nielsen DS. 2018. Have you 506
tried spermine? A rapid and cost-effective method to eliminate dextran sodium sulfate 507
inhibition of PCR and RT-PCR. J Microbiol Methods 144:1–7. 508
26. McMurdie PJ, Holmes S. 2013. Phyloseq: An R Package for Reproducible Interactive 509
Analysis and Graphics of Microbiome Census Data. PLoS One 8. 510
27. Wilkinson L. 2011. ggplot2: Elegant Graphics for Data Analysis by Wickham, H. 511
Biometrics 67:678–679. 512
28. Oksanen AJ, Blanchet FG, Friendly M, Kindt R, Legendre P, Mcglinn D, Minchin PR, 513
Hara RBO, Simpson GL, Solymos P, Stevens MHH, Szoecs E, Wagner H. 2018. Package ‘ 514
vegan ’(Version 2.4-0). 515
29. Hamady M, Lozupone C, Knight R. 2010. Fast UniFrac: Facilitating high-throughput 516
phylogenetic analyses of microbial communities including analysis of pyrosequencing and 517
PhyloChip data. ISME J 4:17–27. 518
30. Benjamin J Callahan, Paul J McMurdie, Michael J Rosen, Andrew W Han, Amy Jo A 519
Johnson and SPH. 2016. DADA2: High resolution sample inference from Illumina amplicon 520
on April 5, 2019 by guest
http://aac.asm.org/
data 13:581–583. 521
31. Christian Quast, Elmar Pruesse, Pelin Yilmaz, Jan Gerken, Timmy Schweer, Pablo Yarza 522
JP and FOG. 2013. The SILVA ribosomal RNA gene database project: improved data 523
processing and web-based tools. Psychiatr Danub 41:D590–D596. 524
32. Bokulich NA, Kaehler BD, Rideout JR, Dillon M, Bolyen E, Knight R, Huttley GA, Gregory 525
Caporaso J. 2018. Optimizing taxonomic classification of marker-gene amplicon sequences 526
with QIIME 2’s q2-feature-classifier plugin. Microbiome 6:1–17. 527
33. Ho J, Tumkaya T, Aryal S, Choi H, Claridge-Chang A. 2018. Moving beyond P values: 528
Everyday data analysis with estimation plots. bioRxiv 377978.(PREPRINT) 529
530 531
532
533
on April 5, 2019 by guest
http://aac.asm.org/
534
D- A D- E D- O TC - A TC - E TC - O - 0 . 5
0 . 0 0 . 5 1 . 0 1 . 5
S a m p l e
P e a r s o n c o r r e la t io n c o e f f ic ie n t ** **** **
ns ns ns
D- A D- E D- O TC - A TC - E TC - O - 1 . 0
- 0 . 5 0 . 0 0 . 5 1 . 0 1 . 5
S a m p l e
P e a r s o n c o r r e la t io n c o e f f ic ie n t * ** ns ns ns ns 535
Figure 1: Pearson correlation coefficient (y-axis) between the inoculum concentration and 536
the number of donor cells (D) (black bars), transconjugants (TC) (grey bars) in fecal 537
samples A, E, and O under a) anoxic (An) and b) oxic (O) conditions. ns = non-significant; * 538
= p < 0.05; **= p < 0.005 and **** = p < 0.0001. 539
540
a b
on April 5, 2019 by guest
http://aac.asm.org/
541
542
543
Figure 2: Gardner-Altman two-groups mean-difference plot showing the difference 544
between donors (D) transconjugants (TC) and transconjugants/donors (TC/D) ratios at (a) 545
a
b
p-value = 0.5 p-value = 0.09
p-value = 0.2
p-value = 0.005 p-value = 0.7
p-value = 0.03
p-value = 0.03 p-value = 0.2 p-value = 0.009
c
on April 5, 2019 by guest
http://aac.asm.org/
2 h, (b) 6 h and (c) 24 h for the poultry meat strain 1061-1-GM (blue) and the human 546
strain C20-GM (orange) in CoMiniGut cultures. The left axis shows the number of donors 547
detected by FACS. On the right axis the filled curve indicates the complete ∆ distribution, 548
given the observed data. The human strain C20-GM survives better than poultry strain 549
1061-1-GM however more transconjugants are detected from poultry meat strain than 550
human UTI strain. The low and high bias corrected and accelerated bootstrap interval 551
values are shown as a density plot on the right side. The confidence interval of the mean 552
differences at 95% is illustrated by the thick black line. Significance was determined by 553
Mann-Whitney U test. 554
555
on April 5, 2019 by guest
http://aac.asm.org/
P- 2 h
r
P- 6 h
r
P- 2 4h
r H- 2
hr H- 6
hr H- 2
4h r - 0 . 6
- 0 . 4 - 0 . 2 0 . 0
E x o g e n o u s s t r a i n
P e a r s o n c o r r e la t io n c o e f f ic ie n t n s n s n s n s * * n s * *
P- 2 hr
P- 6 hr
P- 2 4h
r H- 2
hr H- 6
hr H- 2
4h r - 0 . 6
- 0 . 4 - 0 . 2 0 . 0 0 . 2
T r a n s c o n j u g a n t s
P e a r s o n c o r r e la t io n c o e f f ic ie n t n s n s n s n s n s * 556
Figure 3: Pearson correlation coefficient (y-axis) indicating the relationship between initial 557
Enterobacteriaceae counts in the fecal samples and a) numbers of the exogenous strain 558
poultry strain (black bars) and human strain (grey bars), b) transconjugants that acquired 559
their plasmids over time. After 24 h, the numbers of the two exogenous strains negatively 560
correlated with the counts of pre-existing Enterobacteriaceae in the original fecal sample 561
(a). A significant negative correlation was also seen between counts of pre-existing 562
Enterobacteriaceae and the numbers of transconjugants that received the plasmid from 563
poultry strain after 24 h. ns = non-significant; * = p < 0.05 564
a b
on April 5, 2019 by guest
http://aac.asm.org/
565
Figure 4: Relative abundance at phylum level in 10 fecal samples (A to O) before (a) and 566
24 h after inoculation of the two exogenous strains of human and poultry origin in the 567
corresponding CoMiniGut culture (b). The figure shows that the abundance of 568
Proteobacteria increased after inoculation of the exogenous strains, even though with 569
marked differences between individual fecal samples. 570
a b
on April 5, 2019 by guest
http://aac.asm.org/
571
Figure 5: Relative ASV abundance as a function of fecal donor and strain source only ASVs 572
detected in the sorted transconjugants from CoMiniGut culture are shown. ASV < 0.05% 573
relative abundance are grouped in “other”. a) Fecal sample b) CoMiniGut samples c) 574
Sorted transconjugants. Annotation in figure legend shows the lowest taxonomic rank 575
(Family/Class/Genus) that could be confidently attributed to each amplicon sequence 576
variants using Bayesian classification. 577
578
on April 5, 2019 by guest
http://aac.asm.org/
579
Figure 6: Unweighted UniFrac-based Principal Coordinates Analysis (PCoA) showing the 580
clustering of bacterial communities according to the sample type and strain source. The 581
strains source is human donor assay (circles) or poultry donor assay (triangles). The 582
sample types are CoMiniGut cultures after 24 h (light blue), fecal samples before 583
inoculation (dark blue) and sorted transconjugants from both assays (green). Each dot 584
represents a sample. 585
a
on April 5, 2019 by guest
http://aac.asm.org/