Article
1
Experimental study on the cycle performance
2
characteristics of the CO
2heat pump system under the
3
cooling condition
4
5
Hee Jeong Kang1, Zhen Huan Wang1, Jun Son1, Sun-Joon Byun 2 and Young-Chul Kwon 3,*
6
1 Graduate student, Department of Mechanical Engineering, Sunmoon University,70 sunmoon-ro 221
beon-7
gil, Tangjeong-myeon, Asan-si, Chungcheongnam-do 31460, Republic of Korea;
[email protected](H.-8
J.K.), [email protected](Z.-H.W.), [email protected](J.S.)
9
2 SFR NSSSS System Design Division, Korea Atomic Energy Research Institute, 111 Daedeok-daero 989
10
beon-gil, Yuseong-gu, Daejeon 34057, Republic of Korea; [email protected] (S.-J.B.)
11
3 Graduate student, Department of Mechanical Engineering, Sunmoon University,70 sunmoon-ro 221
beon-12
gil, Tangjeong-myeon, Asan-si, Chungcheongnam-do 31460, Republic of Korea; [email protected]
13
(Y.-C.K.)
14
* Correspondence: [email protected]; Tel.: +82-41-530-2396
15
Abstract: Developing high performance HVAC system using natural refrigerants including carbon dioxide
16
(CO2) has been important in respect of environmental preservation and associated technologies. Thus studies
17
to optimize the HVAC (heating ventilation air conditioner) system using natural refrigerants through clarifying
18
the cycle performance characteristics are necessary. The CO2 heat pump system using air and water sources
19
was consisted to examine its performance characteristics, and by varying conditions of several factors that
20
affect or characterize the system performance like the amount of refrigerant charge, EEV (electronic expansion
21
valve) opening, and internal heat exchanger under cooling mode. The performance characteristics of CO2 heat
22
pump system were tested by using an air enthalpy calorimeter. In the case of the CO2 heat pump system
23
without internal heat exchanger, the opening of #3 EEV and #4 EEV was 60% and refrigerant charge amount
24
was 5,600g. However, in the case of that with internal heat exchanger, the best performance was obtained when
25
the opening of #2 EEV is 20%. From the present studies, it was observed that the performance variation and
26
operational characteristics of the CO2 heat pump system were affected by design factors like refrigerant charge
27
amount, EEV opening, and internal heat exchanger and thereby, the configuration on an optimal operation
28
conditions of the system was enabled.
29
Keywords: Capacity, Cooling and heating, CO2, Cycle performance, EEV, Heat pump, Internal heat
30
exchanger
31
32
1. Introduction
33
CFC and HCFC refrigerants, which are used as refrigerant for the heating and cooling system, are
34
already regulated for production and use due to ozone depletion problem. The optimal design of the
35
heat pump system using natural refrigerant is important for this solution, and it is necessary to
36
understand the cycle characteristics of the heat pump and the performance change of the internal heat
37
exchanger. Natural refrigerants are mostly innoxious and uninfluential to ozone layer destruction or
38
global warming. And these materials are chemically stable and are mixed with mineral oil easily
39
exhibiting their excellent thermodynamic properties. Studies on the application of HVAC system
40
employed natural refrigerants have been actively conducted in developed countries; and among
41
them, studies examining technologies to apply carbon dioxide refrigerant (R-744, CO2) to heat pumps
42
for motor vehicles or for hot water supplying system are representative ones.
43
Ways to improve the performance of HVAC system using CO2 have been explored by studies
44
broadly carried out since it was reported by Lorentzen and Pettersen [1] for the first time. In Japan,
45
CO2 refrigerant has been applied to domestic hot water supplying system. However, the performance
46
of HVAC system or hot water supplying system employed CO2 refrigerant are greatly vulnerable to
47
types and conditions of varied heat sources to be evaporated or to be condensed. Thus such systems
48
employed CO2 refrigerant generally show comparatively poor cyclic performance comparing to
49
systems using conventional refrigerant (R-22) due to the great performance variation characteristics
50
induced by varied types or conditions of heat sources. Therefore, studies exploring ways to improve
51
the cyclic efficiency of systems employed CO2 as refrigerant have been carried out broadly since
52
1990’s. The development of high performance HVAC system employed natural refrigerants is
53
especially important in respect of environmental and technological aspects and accordingly, the
54
optimization studies intended for the development of systems employing natural refrigerant like CO2
55
and investigation of cycle performance characteristics thereof are needed.
56
Lorentzen and Pettersen [2] have compared the performance of HVAC system employed CO2
57
with that of conventional system using R-12 and identified the competing performance of the system
58
employed natural refrigerant of CO2 and, Gentner [3] also demonstrated the competing performance
59
of HVAC system of CO2 to that of the HVAC system employed conventional R-134a and, they all
60
have reported the systems adopted the refrigerant of CO2 as an alternative environmentally friendly
61
HAVC systems that could replace conventional HVAC systems. Experimental studies conducted by
62
Yin et al. [4] and McEnaney et al. [5] have compared the conventional HVAC system with another
63
system employed CO2 as a refrigerant and have also exhibited the high capacity and COP of HVAC
64
systems of CO2 in an environment of low temperature despite the low level of heat transfer and COP
65
of the HVAC system of CO2 situated in an environment of high ambient temperature. Nekså et al. [6]
66
have applied the refrigerant of CO2 to hot water supplying system of which maximum pressure in
67
high pressure area reached 11MPa through experiment; and Hwang and Radermacher [7] conducted
68
a theoretical study that applied CO2 to hot & chilled water supplying system as a refrigerant and
69
demonstrated the performance enhancement of about 10% of the system compared to conventional
70
system employed the R-22 refrigerant. Kauf [8] have identified the presence of discharge pressure
71
enabling the maximum performance coefficient in the system employed CO2 as a refrigerant and
72
derived an experimental formula of optimized discharge pressure. Baek et al. [9] performed the study
73
simultaneously explored the cyclic performance variation corresponded to the varied compression
74
ratios of 1- and 2-stage compression in a two-stage compression intercooling cycle and the cyclic
75
performance enhancement through the employment of expander. Cho et al. [10, 11] and Lee [12] et
76
al. examined internal heat exchangers to improve the performance thereof and investigated
77
performance characteristics of the system in accordance with varied conditions of the operation of
78
respective systems. Chen [13] et al. have carried out an analytical study on cyclic pressure changes
79
and resulting performance of gas cooler employed an internal heat exchanger; and Boewe [14] have
80
suggested that an optimal operation of HVAC system of CO2 can be enabled solely by the control of
81
opening of electronic expansion valves.
82
Thus, more comprehensive and systematic studies on cycle characteristics of CO2 heat pump
83
system are required to develop the performance of HVAC system using CO2. The study on the
84
optimal operation conditions of CO2 heat pump system is necessary to develop a compact and high
85
performance HVAC system. In the present study, the performance characteristics in a cooling cycle
86
of CO2 heat pump system that employed heat sources of air and water are investigated
87
experimentally. To investigate optimal operation conditions of CO2 heat pump under a cooling
88
condition, a CO2 cycle loop is constructed. And factors of refrigerant charge amount, EEV opening
89
and performance of CO2 heat pump by internal heat exchanger are examined and measured through
90
an air enthalpy calorimeter. These results can be utilized in the design of a compact HVAC system
91
2. Experimental equipment and method
93
2.1. CO2 heat pump system
94
The CO2 heat pump system consisted of the inverter rotary compressor of 13.0 cc/rev BLDC type,
95
the outdoor unit equipped with 3-columns fin tube heat exchanger, the indoor unit of cassette ducted
96
type equipped with 1-column fin tube heat exchanger, the 4-way valve, and EEVs (electronic
97
expansion valves) to evaluate the performance characteristics of the system.
98
To measure the temperature and pressure in the CO2 cycle, the thermocouple of t-type and
99
pressure gauge were installed; and to measure the power consumption of the whole system including
100
the compressor, the digital power-meter was used. Measurements of pressure gauges and
101
thermometers installed in each interval were obtained through the connected data acquisition
102
system. To supply fluids of different conditions to the gas cooler and evaporator, the constant
103
temperature water bath and the constant temperature - humidity chamber with 2 rooms were
104
employed. Besides, the multi-nozzles enabled the measurement of air flow rate, dry bulb
105
temperature, wet bulb temperature, and differential pressure was used to measure the air flow rate
106
and enthalpy.
107
2.2. Experimental method
108
The CO2 heat pump system employed in the performance test was the refrigerant-to- water
109
system. Under the condition of cooling operation, the refrigerant charge amount, opening of EEV,
110
and performance factors of internal heat exchanger were tested. For the acquisition of data to be used
111
for the analysis and evaluation of system performance, the data corresponded to conditions of
112
temperature variation range of ±0.1℃, pressure variation range of ±5kPa, and flow rate variation
113
range of ±0.2g/s lasted for over 15 minutes were obtained through the data acquisition system. Table
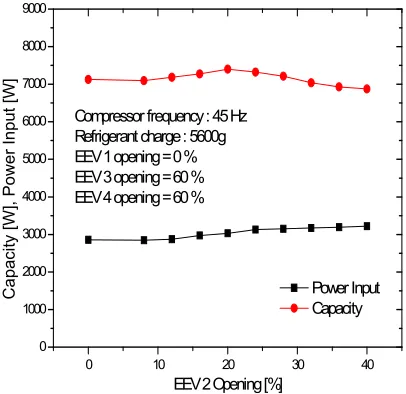
114
1 represents the conditions applied to the performance test.
115
116
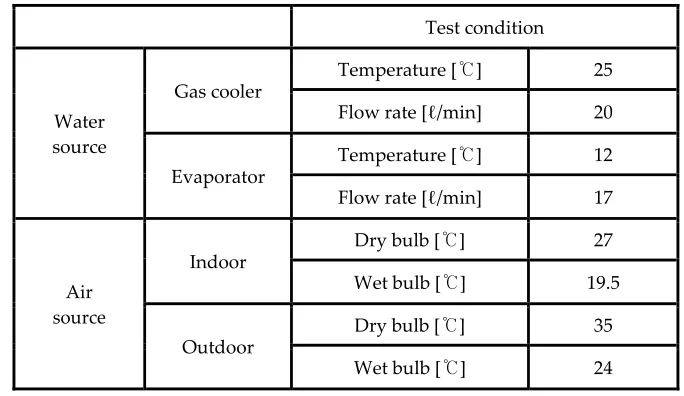
Table 1. Test condition of air and water source heat pump
117
Test condition
Water source
Gas cooler
Temperature [℃] 25
Flow rate [ℓ/min] 20
Evaporator
Temperature [℃] 12
Flow rate [ℓ/min] 17
Air source
Indoor
Dry bulb [℃] 27
Wet bulb [℃] 19.5
Outdoor
Dry bulb [℃] 35
Wet bulb [℃] 24
118
119
The cooling capacity of CO2 heat pump system can be obtained from the flow rate and difference
120
in temperatures between inlet and outlet of air side of evaporator. The heat balance of the heat
121
transfer rate measured from air side of and water side was remaining within ±4%. The heat transfer
122
= (( ) )+ (1)
124
125
Here, , , ℎ , ℎ , , , and respectively denote the whole heat quantity
126
determined for the cooling of indoor side (W), measurement of indoor side air flow rate of the system
127
(m3/s), intake enthalpy of indoor side (J/kg), discharge enthalpy of indoor side (J/kg), specific volume
128
at the point of air flow rate measurement (m3/kg), absolute humidity at the point of air flow rate
129
measurement (kg/kg), and heat penetration (W) of the measurement device.
130
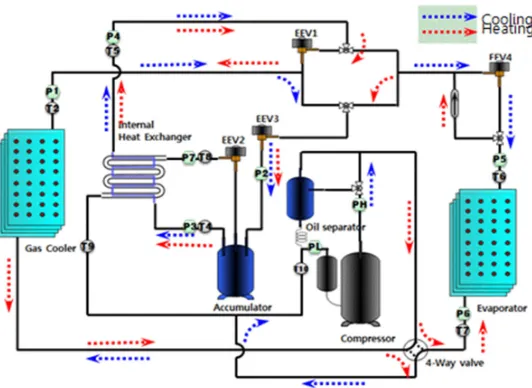
4 EEVs were employed to optimize the cooling cycle of CO2 system, and the configuration of
131
EEVs enables an independent control of each valve. EEVs of 1, 3, and 4 were designed for the function
132
of optimization of cooling cycle; and EEV 2 was designed for the function to optimize the internal
133
heat exchanger. Specifications applied to the CO2 heat pump system are summarized in Table 2. The
134
optimal point of efficiency of cooling system was explored through the test of cycle optimization
135
carried out by varying the amount of refrigerant and opening of EEVs. Under the standard
136
temperature condition for the cooling, the test started with the compressor frequency of 45Hz that
137
yields the highest energy efficiency and the initial amount of 2,800g of refrigerant charge that varied
138
by each increment of 200g for the test. The configuration of cycle optimization test is illustrated in
139
Figure 1.
140
141
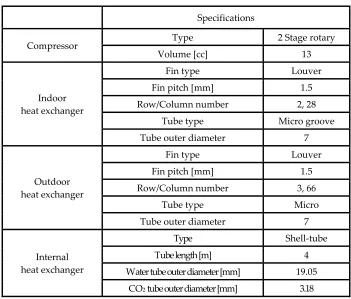
Table 2. Specifications of CO2 heat pump system
142
Specifications
Compressor Type 2 Stage rotary
Volume [cc] 13
Indoor heat exchanger
Fin type Louver
Fin pitch [mm] 1.5
Row/Column number 2, 28
Tube type Micro groove
Tube outer diameter 7
Outdoor heat exchanger
Fin type Louver
Fin pitch [mm] 1.5
Row/Column number 3, 66
Tube type Micro
Tube outer diameter 7
Internal heat exchanger
Type Shell-tube
Tube length [m] 4
Water tube outer diameter [mm] 19.05
CO2tube outer diameter [mm] 3.18
144
Figure 1. Schematic diagram of CO2 refrigerant cycle
145
3. Results and Discussion
146
3.1. Refrigerant charge amount and EEV
147
The performance of heat pump system depends on the amount of refrigerant charged. To
148
observe the changes in cooling capacity corresponded to varied amount of refrigerant charge, the
149
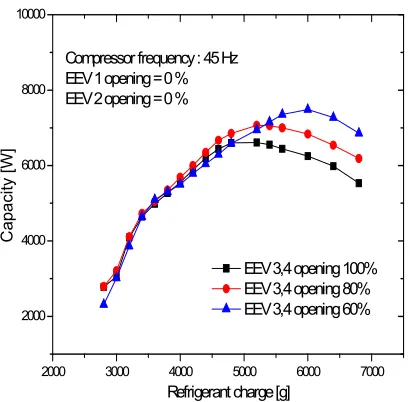
amount of refrigerant charge was increased by 200g from the initial charge of 2,800g to 6,800g. Figure
150
2 shows the changes of cooling capacity corresponded to the varied amount of refrigerant charge
151
under the compressor frequency of 45Hz. The cooling capacity tended to increase along with the
152
increase of the amount of refrigerant charge to the level of 5,000g∼5,600g and thereafter, it tended to
153
decrease gradually. This was owing to the decreased cooling capacity of heat pump caused by the
154
reduction of superheating region at the extent beyond certain level of the amount of refrigerant
155
charge, despite that the cooling capacity of heat pump increased owing to the heat transfer
156
enhancement of the evaporator, when the amount of refrigerant charge increased. Since the
157
temperature of refrigerant at the outlet of the expansion device(that is, at the inlet of evaporator) was
158
increased by the increased opening of EEV, the temperature difference between refrigerant side and
159
air side was reduced and then the cooling capacity of CO2 heat pump system decreased. And the
160
power consumption of compressor was increased along with the increase of refrigerant charge
161
amount that caused the increase of mass flow rate of refrigerant flown into the compressor. The inlet
162
and outlet pressure and temperature of compressor changed according to varied amount of
163
refrigerant were measured and thereby the increase of inlet and outlet pressure of compressor was
164
observed. The difference between measurements of inlet and outlet pressure of compressor was
165
increasing along with the increased amount of refrigerant charge that brought about the increase of
166
power consumption. At the level of 100% of the opening of EEVs 3 and 4, the outlet pressure of
167
compressor marked the level of about 2.2 times of inlet pressure with the 6,800g of charged amount
168
of refrigerant; and with the increase of the charged amount of refrigerant from 2,800g to 6,800g, both
169
the measurements of inlet (35kgf/cm2 → 47kgf/cm2) and outlet (77kgf/cm2 → 103kgf/cm2) pressures
170
172
Figure 2. Variations of cooling capacity with refrigerant charge amount
173
174
Figure 3 shows the changes of COP according to varied amount of refrigerant charge at 45Hz of
175
compressor frequency. As it was illustrated in Figure 2, the COP of heat pump increased gradually
176
and peaked in the range of about 5,000g∼5,600g of charged refrigerant amount and then tended to
177
decrease by the increase of power consumption and changes in cooling capacity. This result means
178
that the increase of refrigerant charge amount can increase the cooling capacity of heat pump to a
179
certain extent but, it also increases the level of power consumption thus the optimal level of
180
refrigerant charge amount should be identified for the cycle optimal operation. COP also increased
181
together with the decreased opening of EEVs. This result suggests the COP of system can be
182
dependent on the varied opening of EEVs and there can be certain levels of refrigerant charge amount
183
and opening of electronic expansion valves for the optimal system operation. In this study, the
184
optimal levels of refrigerant charge amount and openings of EEVs of 3 and 4 were obtained to be
185
5,600g and 60%.
186
187
Figure 3. Variations of COP with refrigerant charge amount
188
189
2000 3000 4000 5000 6000 7000
2000 4000 6000 8000 10000
C
apa
ci
ty [W]
Refrigerant charge [g]
EEV 3,4 opening 100% EEV 3,4 opening 80% EEV 3,4 opening 60% Compressor frequency : 45 Hz
EEV 1 opening = 0 % EEV 2 opening = 0 %
2000 3000 4000 5000 6000 7000 0.5
1.0 1.5 2.0 2.5 3.0 3.5
Compressor frequency : 45 Hz EEV 1 opening = 0 % EEV 2 opening = 0 %
EEV 3,4 opening 100% EEV 3,4 opening 80% EEV 3,4 opening 60%
CO
P
Figure 4 shows the temperature changes of outlet sides of compressor which were greater than
190
those of inlet sides of compressor varied at each level of the opening of EEVs (opening : 100%, 80%,
191
and 60%) and the amount of refrigerant charge. The temperature increase of inlet sides of compressor
192
was about 16℃ along with the increased amount of refrigerant charge, and contrarily, the outlet
193
temperature decreased greatly by about 55℃.
194
195
Figure 4. Variations of temperature with refrigerant charge amount and opening of EEV
196
197
Figure 5. Variation of P-h diagram with refrigerant charge amount
198
199
Figure 5 shows the status of each part of the system plotted on the P-h diagram that represents
200
changes of each part corresponded to each level of 2,800g, 4,200g, 5,600g, and 6,400g of refrigerant
201
charge amount. In the case of refrigerant charge amount of 2,800g, the difference in enthalpy between
202
outlet sides of compressor and gas cooler was small and thereby the decrease in cooling capacity was
203
observed. On the contrary, the big increase in cooling capacity was identified with the increase of the
204
charged amount of 4,200g of refrigerant despite the small difference in outlet pressure. However,
205
when the amount of refrigerant charge increased above 5,600g, the degree of the increase of cooling
206
capacity became smaller or almost constant. Also, the decrease of refrigerant quality at the inlet of
207
evaporator was identified in accordance with the increase of refrigerant charge amount. In particular,
208
2000 3000 4000 5000 6000 7000
0 10 20 30 40 50 60 70 80 90 100 110 120
T
e
m
perat
ure [
oC]
Refrigerant charge [g]
Compressor Suction Temp. EEV 3,4 opening 100% EEV 3,4 opening 80% EEV 3,4 opening 60% Compressor frequency : 45 Hz EEV 1 opening = 0 % EEV 2 opening = 0 %
2000 3000 4000 5000 6000 7000
Compressor Discharge Temp. EEV 3,4 opening 100% EEV 3,4 opening 80% EEV 3,4 opening 60%
100 200 300 400 500 2
4 6 8 10 12
60o
C 30oC
-10oC
Pr
ess
ur
e [MPa]
h [kJ/kg] 10oC
Compressor frequency : 45Hz EEV openings : 60%
the refrigerant quality decreased greatly with the increase of refrigerant charge amount from 2,800g
209
to 4,200g. As the CO2 heat pump system has the characteristics of great change of refrigerant quality
210
of inlet of evaporator depending on changes of pressure of gas cooler, the optimal cooling capacity
211
of CO2 system can be secured with the pressure of gas cooler increased beyond certain level.
212
213
3.2. Internal heat exchanger
214
The heat exchanger applied to the heat pump system decreases the temperature of the inlet of
215
EEVs by the heat exchange between high pressure refrigerant at the outlet of gas cooler and the
216
refrigerant of low temperature at the outlet of evaporator. This reduces the refrigerant quality of the
217
inlet of evaporator and thereby increases the cooling capacity of system. The power consumption of
218
system also increases, but, as the outlet temperature of compressor is increased. In the present study,
219
the opening of EEV 2 that influences the internal heat exchanger was varied to evaluate the
220
performance of heat pump system employed the internal heat exchanger. By the results obtained
221
from the previous experiment on refrigerant charge amount and EEV, the values of refrigerant charge
222
amount and opening of EEV placed at evaporator side were determined to be 5,600g and 60%
223
respectively.
224
Figures 6 and 7 show the power consumption and cooling capacity of the system varied in
225
accordance with the increase of the opening of EEV 2 that influenced the internal heat exchanger. In
226
the case of the increase of opening of EEV, the temperature of refrigerant at the outlet of gas cooler
227
decreased by the heat exchange between refrigerants of the outlets of gas cooler and evaporator. This
228
also caused the increase of cooling capacity by the decrease of inlet temperature of EEV. By the
229
increased opening of EEV, however, the opening of EEV for the optimal COP exists because of the
230
differential degree of increase in cooling capacity and power consumption. The opening of EEV for
231
optimal COP was 20%, and then the increase in cooling capacity was about 4.4%. And the power
232
consumption of system also increased by about 4.0% due to the increased temperature and pressure
233
of compressor. Thus, the increase of COP was about 0.5%.
234
Figure 8 shows the pressure and temperatures of the inlet and outlet of internal heat exchanger
235
varied in accordance with the changes in the opening of EEV 2. As showed in the figure, the pressure
236
changes and temperatures of the inlet and outlet of internal heat exchanger decreased along with the
237
increased opening of EEV. At the extent beyond the level of 30% of the opening of EEV, the constant
238
temperature difference due to heat exchange was observed and the difference in pressure drop due
239
to the internal heat exchanger was not observed.
240
241
242
Figure 6. Variation of cooling capacity, power input with opening of EEV 2
243
0 10 20 30 40
0 1000 2000 3000 4000 5000 6000 7000 8000 9000
Compressor frequency : 45 Hz Refrigerant charge : 5600g EEV 1 opening = 0 % EEV 3 opening = 60 % EEV 4 opening = 60 %
Ca
paci
ty [
W
], Po
we
r
In
put [W
]
EEV 2 Opening [%]
244
Figure 7. Variation of COP with opening of EEV 2
245
246
Figure 8. Variation of temperature, pressure with opening of EEV 2
247
248
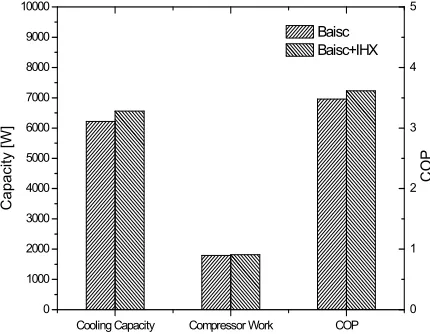
Figure 9. Variation of cool capacity, compressor work and COP according to internal heat
249
exchanger in the cooling mode
250
251
0 5 10 15 20 25 30 35 40 2.0
2.2 2.4 2.6 2.8 3.0
COP
EEV 2 opening [%] Compressor frequency : 45 Hz Refrigerant charge : 5600g EEV 1 opening = 0 % EEV 3 opening = 60 % EEV 4 opening = 60 %
0 10 20 30 40 0
5 10 15 20 25 30 35
Compressor frequency : 45 Hz Refrigerant charge : 5600g EEV 1 opening = 0 % EEV 3 opening = 60 % EEV 4 opening = 60 %
Pre
ssu
re
[Mpa
], T
e
mp
erature
[
oC]
EEV 2 opening [%]
P3 : IHX in P4 : IHX out T4 : IHX in T5 : IHX out
0 1 2 3 4 5
Cooling Capacity Compressor Work COP 0
1000 2000 3000 4000 5000 6000 7000 8000 9000 10000
Ca
pacity [W]
Baisc Baisc+IHX
CO
Figure 9 shows the results of performance experiment of CO2 heat pump system with internal
252
heat exchanger. The application of internal heat exchanger brought about the increase of cooling
253
capacity of about 4%. In the case of the heating system employed the internal heat exchanger, the
254
temperature at outlet side of gas cooler would be decreased by the heat exchange with the
low-255
pressure stage at outlet side of evaporator. And in the case of small opening of EEV, the outlet
256
pressure and temperature of compressor would be increasing and thereby the difference in
257
temperature of refrigerant of gas cooler also increases. By the reduced opening of EEV, but, the flow
258
rate of refrigerant would be decreasing.
259
260
5. Conclusions
261
In this study, the experiments to investigate cycle performance characteristics and the optimal
262
operation conditions of CO2 heat pump system employed heat sources of air and water were carried
263
out under a cooling condition. The performance of heat pump system varied in accordance with
264
changes in the amount of refrigerant charge, opening of EEVs, and internal heat exchanger was
265
examined through the air enthalpy calorimeter. From the present experimental work, the following
266
conclusions are summarized as follows:
267
(1) The cooling capacity tended to increase along with the increase of the amount of refrigerant charge
268
and thereafter it tended to decrease gradually. In the range below 5,000g of the amount of
269
refrigerant charge, the increasing trends of cooling capacity were almost similar to each other
270
irrespective of the degree of opening of EEVs, however, in the range beyond the amount of 5,000g
271
of refrigerant charge, the cooling capacity was changing according to changes of the opening of
272
EEVs.
273
(2) The cooling capacity of heat pump system was decreasing with the increase of the opening of
274
EEVs. As the power consumption of compressor was increased by the increase of charged amount
275
of refrigerant, the COP performance curve appeared to be reducing greatly at the extent over
276
5,000g of the amount of refrigerant charge. From the experiment results, the optimal opening (of
277
60%) of EEV and the amount (of 5,600g) of refrigerant charge for the optimization of system
278
operation were identified.
279
(3) The temperature change of the outlet side of compressor by the change of amount of refrigerant
280
charge and opening of EEVs appeared about 3.5 times larger than that of the inlet side of
281
compressor. Besides, the opening of EEV 2 that influences the internal heat exchanger affects the
282
cooling capacity and power consumption of heat pump system. The cooling capacity of heat pump
283
system would be increasing in accordance with the increased opening of EEV. However, owing
284
to the differential increase of cooling capacity and power consumption, there will be an optimal
285
opening of EEV which should be reflected in the system design as an operational factor. The
286
present experiment results showed that opening of EEV identified the optimal COP was about
287
20% and then the cooling capacity was increased about 4.4%.
288
289
Acknowledgments: This work was supported by the Sun Moon University Research Grant of 2014.
290
References
291
1. Lorentzen, G. and Pettersen, J., A new efficient and environmentally benign system for car air-conditioning,
292
Int. J. Refrigeration, 1992, 16(1), 4-12.
293
2. Lorentzen, G., Revival of carbon dioxide as a refrigerant, Int. J. Refrigeration, 1994, 17(5), 292-301.
294
3. Gentner, H., Passenger car air conditioning using carbon dioxide as refrigerant, In Proceedings of the
IIR-295
Gustav Lorentzen Conference on Natural Working Fluids, Oslo, Norway, 1994, 303-313.
296
4. Yin, J., Bullard, C. and Hrnjak, P., Design strategies for R744 Gas coolers, Proceedings of the 4th IIR-Gustav
297
5. McEnaney, R., Park, Y. C., Yin, J. M. and Hrnjak, P. S., Performance of the prototype of a transcritical R744
299
mobile A/C system, SAE paper 1999-01-0872.
300
6. Nekså, P., Rekstad, H., Zakeri, G. R. and Schiefloe, P. A., CO2-heat pump water heater: characteristics,
301
system design and experimental results. Int. J. Refrigeration, 1998, 21(3), 172-179.
302
7. Hwang, Y. and Radermacher, R., Experimental evaluation of CO2 water heater, In Natural Working
303
Fluids'98, Proceeings of the IIR-Gustav Lorentzen Conference, 1998 June 2-5 Oslo, Norway. 321-328.
304
8. Kauf, F., Determination of the optimum high pressure for transcritical CO2-refrigeration cycles. Int. J.
305
Thermal Science, 1999, 38, 325-330.
306
9. Baek J, Groll E, Lawless P, Piston-cylinder work producing expansion device in a transcritical carbon
307
dioxide cycle. Part I: experimental investigation, Int. Journal of Refrigeration, 2005, 28(2), 141-151.
308
10. Cho, H. H., Ryu, C. G. and Kim, Y. C., Experimental study on the cooling performance of a variable speed
309
CO₂cycle with internal heat exchanger and electronic expansion valve, Korean Journal of Air-Conditioning
310
and Refrigeration Engineering, 2005, 17(3), 209-216.
311
11. Cho, H. H., Ryu, C. G., Lee, H. S. and Kim, Y. C., Experimental Study on the Variation of the Optimal
312
Charge with cycle option in the CO Refrigeration, Proceedings of the SAREK, 2005, 398-403.
313
12. Lee, E. C., Baek, C. H., Kang, H., Kim, Y. C., Cho, H. H. and Cho, S. W., Experimental Study on the
314
Performance of a CO Heat Pump Water Heater, Korean Journal of Air-Conditioning and Refrigeration
315
Engineering, 2009,21(6), 367-372.
316
13. Chen, Y., Gu, J., The Optimum High Pressure for CO2 Transcritical Refrigeration System with Internal Heat
317
Exchanger, Int. Journal of Refrigeration, 2005, 28(8), 1238-1249.
318
14. Boewe, D. E., Bullard, C. W., Yin, J. M. and Hrnjak, P. S., Contribution of internal heat exchanger to
319