final
re
port
p
In submitting this report, you agree that Meat & Livestock Australia Limited may publish
the report in whole or in part as it considers appropriate.
Project code: B.NBP.0352
Prepared by: Dr Athol Klieve
Department of Primary Industries and Fisheries, Queensland
Date published: April 2008
ISBN: 9 781 741 913 095
PUBLISHED BY
Meat & Livestock Australia Limited Locked Bag 991
NORTH SYDNEY NSW 2059
Feeding to increase
productivity and reduce
greenhouse gas emissions
Northern Beef Program
Abstract
Executive Summary
Methane is a by-product in the digestion of plant material by all cattle and sheep. Effectively it is wasted feed material and energy that could otherwise be available for animal production. Methanogenesis is a microbiological mechanism that removes hydrogen (produced by the fermentation of feed) from the rumen. Methane is also a major greenhouse gas contributing heavily to global warming with a warming potential 21 times greater than carbon dioxide. Cattle and sheep contribute 53% of Australia’s total methane emissions (3 million tonnes annually or the equivalent of 63 million tonnes of carbon dioxide) (NGGIC 2007) and 14% of the nation’s total greenhouse gas emissions. Beef cattle alone contribute 50% of these emissions.
It has been estimated that, if three quarters of the methane generated could be channelled into animal product, instead of lost to the atmosphere, 10% of Australia’s greenhouse gas emissions could be permanently eliminated. At the same time $150 million worth of production annually (calculated as beef cattle equivalence) could be generated by Queensland’s primary producers alone.
Many lipid containing feed materials are known to reduce methane generation and are attractive as nutritional supplements due to the high proportion of concentrated energy and/or protein they contain. Coconut oil has been shown to significantly suppress methane production. Studies have shown that on average, methane suppression could be equated to an increase in capture of ingested energy of up to 27%. The impact of the commonly used feed supplement, cottonseed (which contains a large proportion of lipids) on methane generation had not been previously studied.
Oils and lipids also reduce ruminal protozoal numbers. While ruminal protozoa are a normal inhabitant of the rumen, they reduce the efficiency of feed utilisation in the rumen through predation on ruminal bacteria and also harbour methane producing bacteria responsible for 9-25% of ruminal methane emissions. Predation on bacteria reduces the amount of microbial protein that flows from the rumen and is available to the animal. As 80% or more of the animals’ protein requirement comes from microbial protein, a reduction in the amount flowing from the rumen can have significant consequences on production.
These positive benefits of using oil/lipid based feed additives have to be balanced with some negative impacts, particularly on plant fibre breakdown in the rumen. The project aimed to optimise methane reduction in association with improving productivity.
Specific objectives were to:
• Evaluate and compare the ability of coconut oil, coconut flesh and cottonseed to reduce methane generation and methanogen species composition in in vitro, rumen based, fermentation experiments; and
• Confirm and quantify the impact of the feed additives on rumen methanogenesis in cattle and determine performance benefits when fed with a production ration.
A large number of in vitro fermentor based experiments were undertaken to determine the impacts of coconut oil, coconut flesh (as a more economic method of delivering the oil) and ground cottonseed on methane generation, methanogen populations (numbers and diversity) and important rumen digestion parameters such as volatile fatty acid (VFA) production and the extent of plant fibre digestion. Fermentations were performed at a number of differing
concentrations (3 or 7% - coconut oil; 3, 5 or 7 % - coconut flesh; 5, or 7% - cottonseed (w/w)) as well as with no additive controls to establish what might be an optimum level of inclusion in a diet.
Whole desiccated coconut flesh was similar to purified coconut oil. Flesh delivering 3% oil had a minor impact on methane production whereas at 5 and 7% it had a marked impact, reducing methane by approximately 50%. VFA production was reduced but the impact of coconut flesh on digestion of plant fibre was less pronounced, compared to coconut oil. Coconut flesh appeared to be an effective mechanism for the delivery of coconut oil in feed as it delivered the same methane suppression but with less deleterious effects on forage digestion. Cottonseed at 7% oil inclusion in the diet had a similar impact on methanogenesis to that of 7% coconut oil. However, while methane was reduced the impact of cottonseed on dry matter digestion and VFA production was less adverse than with the coconut products.
The impact of these feed supplements was then tested in cattle in a pen trial. Given the variable impact of both coconut and cottonseed oils on methane emissions and methanogen numbers in
vitro it was decided that a response curve approach relating oil intake to liveweight gain and
methane emission would relate these factors across the spectrum of oil concentrations. Commercial Brahman crossbred weaner heifers (42 in total), approximately 10-12 months of age, were used in a randomised complete block design with 2 basal diets (pangola grass hay with and without molasses), 2 supplement types (cottonseed and copra meals fortified with their respective oils) and 3 rates of supplement feeding (to deliver approximately 2, 4 and 6% oil in the diet). Liveweight and intake (total, hay and supplement) were measured throughout the experiment (duration 7 weeks) and rumen samples were collected to determine the impact on ruminal fermentation and microbial populations, specifically methanogens and protozoa. At the end of the main part of the trial (to determine the impact on liveweight gain) a 10 day intensive methane measurement program was undertaken using the sulphur hexafluoride tracer technique. The inclusion of oil fortified copra and cottonseed meals increased liveweight gain in cattle by up to 20 kg without the addition of molasses and up to 30 kg with molasses added, over a 7 week period. Concomitant with the increased productivity there was no overall change in methane emissions per head but a substantial decrease in methane emitted per unit of production (1500 g CH4/Kg ADG to less that 100 g CH4/Kg ADG). Thus, not only was it possible to increase the growth rates of cattle and decrease the methane produced per unit of product (meat) but this was achieved without increasing per head methane emissions. Unlike with many other feeding technologies (where reduction per unit product are often accompanied by increases per head) the advantages of increased production and lowered emissions per unit of production will not increase overall on farm emissions meaning that to capitalise on these reductions will not require a reduction in herd numbers to offset any per head or per unit area increases in emissions (as is often the case with other strategies).
Contents
Page
1
Background ...7
2
Project Objectives ...8
3
Methodology...8
3.1
In vitro determination of optimum level of inclusion of
feed additives ... 8
3.1.1
Operation of the fermentor and sampling ... 8
3.1.2
Real-Time PCR and DGGE... 9
3.2
Pen study: Effect of supplements containing different
oils on the growth and methane production of cattle ... 10
3.2.1
Animals, treatments and experimental design... 10
3.2.2
Procedures ... 11
3.2.3
Methane measurement ... 12
3.2.4
Chemical analysis ... 12
3.2.5
Statistical methods ... 13
4
Results and Discussion ...13
4.1
In vitro studies – coconut oil... 13
4.1.1
Effect on fibre utilisation ... 13
4.1.2
VFA production ... 14
4.1.3
Methane production... 14
4.1.4
Methanogen population density and diversity ... 15
4.1.5
Summary... 16
4.2
In vitro studies – effect of coconut flesh... 17
4.2.1
Effect on fibre utilisation ... 17
4.2.2
VFA production ... 18
4.2.3
Methane production... 18
4.2.4
Methanogen population density and diversity ... 19
4.3
In vitro studies – ground cottonseed ... 21
4.3.1
Effect on fibre utilisation ... 21
4.3.2
VFA production ... 23
4.3.3
Methane production... 23
4.3.4
Methanogen population density and diversity ... 24
4.3.5
Summary... 25
4.4
Pen study: Effect of supplements containing different
oils on the growth and methane production of cattle ... 25
4.4.1
Cattle growth and methane production... 25
4.4.2
Rumen microbial observations ... 31
4.4.2.1 Protozoal population ... 31
4.4.2.2 Methanogen population densities ... 31
4.4.2.3 Methanogen diversity ... 32
5
Success in Achieving Objectives...33
5.1
Overall ... 33
5.2
Specific Objectives ... 34
6
Impact on Meat and Livestock Industry –
now & in five years time ...34
7
Conclusions and Recommendations...35
7.1
Conclusions... 35
7.2
Recommendations ... 36
1 Background
Methane is a by-product in the digestion of plant material by all cattle and sheep. Effectively it is wasted feed material and energy that could otherwise be available for animal production. Methanogenesis is a microbiological mechanism that removes hydrogen (produced by the fermentation of feed) from the rumen. It has been estimated that, if three quarters of the methane generated could be channelled into animal product, instead of lost to the atmosphere, 10% of Australia’s greenhouse gas emissions could be permanently eliminated. At the same time $150million worth of production annually (calculated as beef cattle equivalence) could be generated by Queensland’s primary producers alone. This would represent a major boost to rural economies and communities.
Methane is also a major greenhouse gas contributing heavily to global warming with a warming potential 21 times greater than carbon dioxide. Cattle and sheep contribute 53% of Australia’s total methane emissions (3 million tonnes annually or the equivalent of 63 million tonnes of carbon dioxide) (NGGIC 2007) and 14% of the nation’s total greenhouse gas emissions. Beef cattle alone contribute 50% of these emissions.
Globally, livestock are responsible for the generation of 90 million tonnes of methane (equivalent to 1.9 billion tonnes of carbon dioxide) annually.
Australia, as a signatory to the Kyoto protocol, is required to limit total greenhouse emissions in 2008-2012 to 108% of the 1990 emission levels. Methane has been specifically identified as a greenhouse gas for which policies and strategies are required to be developed to reduce emissions (Howard, 1997). In addition, from a global warming perspective, reducing methane emissions is seen as highly advantageous in delivering near-term climate benefits as methane has a high radiative forcing potential (21 times that of CO2) but a relatively short atmospheric life, approx. 10 years. Therefore, reductions in methane emissions could be expected to result in measurable reductions in the concentration of atmospheric methane and slow the rate of climate change within decades (Weitang, 2003).
Animal production produces more greenhouse gas per $GDP than other activities (Howden and Reyenga, 1999), increasing the pressure to reduce emissions from the sector and the risk of potential punitive measures (e.g., a “carbon tax”) without identified reductions. ABARE calculate that a “carbon tax” would reduce livestock production by 8% by 2010 and production costs would increase considerably. Major negative impacts on rural economies, rural community viability and rural employment could be expected.
While a wide range of strategies has been suggested to reduce enteric methane (BRS, 1999), few are currently being developed and these are likely to be available only in the long-term. The use of specific feed additives that have significant production advantages, and reduce methane emissions, is a strategy that could be available in the short to medium term.
Many lipid containing feed materials are known to reduce methane generation and are attractive as nutritional supplements due to the high proportion of concentrated energy and/or protein they contain. Historically, Czerkawski et al. (1966) demonstrated that oleic acid (18: 1), linoleic acid (C18: 2) and linolenic acid (C18: 3), when individually infused into the rumen of sheep, reduced methane generation. More recently, Machmuller et al. (1998 and 2000) investigated and compared the effects, both in vitro and in vivo, of differing feeds with high fat contents on rumen fermentation and methane production. It was found that linseed and sunflower seed additions reduced methane release by up to 40%. Comparatively, the use of coconut oil (predominantly C12 and C14 fatty acids) completely eliminated ciliate protozoa, as well as significantly suppressing methane production both in vitro and in vivo. At supplementation levels of 3% and 6% of the total diet, coconut oil reduced emissions by 43% and 57%, respectively. A third in vivo
supplemented at 3.5 and 7%of the diet, of 28 and 73% respectively. On average, methane suppression in these studies could be equated to an increase in capture of ingested energy of 27%.
Lipids also reduce ruminal protozoal numbers. While ruminal protozoa are a normal inhabitant of the rumen, they reduce the efficiency of feed utilisation in the rumen through predation on ruminal bacteria (Bird 1989, Leng et al. 1992). This predation reduces the amount of microbial protein that flows from the rumen and thereby becomes available to the animal. As 80% or more of the animals’ protein requirement comes from microbial protein (Firkins 1996), a reduction in the amount of bacteria flowing from the rumen can have significant consequences on production. Removal of protozoa, or defaunation, has been demonstrated to have positive production responses in some production systems, e.g. increases in wool growth in sheep of up to 10% have been reported (Bird 1989).
Furthermore, about 20% of the ruminal methanogen population are associated symbiotically with ciliate protozoa (Strumm et al. 1982) and produce 9-25 % of ruminal methane emissions (Newbold 1995). Hence, defaunation (the removal of the ciliate protozoa) would increase production through increased microbial protein production and decreased methane generation.
These positive benefits of using lipid based feed additives will have to be balanced with some negative impacts, particularly on plant fibre breakdown in the rumen. It is generally accepted that inclusion of 5% or greater lipid in the diet can limit fibre digestion (Orskov et al. 1978). The proposed project was aimed at optimising methane reduction in association with improving productivity.
2 Project
Objectives
The purpose of the project was to investigate the impact of coconut oil, whole coconut flesh (as an economic method of delivering the oil) and whole cottonseed supplementation on the suppression of both methane emissions and the protozoal populations, and improvements in the growth rate of steers fed C4 grasses and molasses.
Specifically we:
• Evaluated and compared the effect of coconut oil, whole coconut flesh and whole cottonseed in reducing methane generation and methanogen species composition in in
vitro, rumen based, fermentation experiments; and
• Confirmed and quantified the impact of the feed additives on rumen methanogenesis in cattle and determined performance benefits when fed in a ration
3 Methodology
3.1 In vitro determination of optimum level of inclusion of feed additives
3.1.1 Operation of the fermentor and sampling
The methodology associated with using the fermentor is well established and the basic operation was similar to that published in relation to the production of a live inoculum for cattle grazing
Leucaena (Klieve et al., 2002). A large set of starter cultures was created from a fermentation of
Fermentation was commenced with a 100 mL starter culture being added to 3 L of a rumen-fluid-based (RF) medium. At commencement of the fermentation 45 g of finely ground speargrass was added as substrate for the fermentor. On the second day of fermentation the amount of ground hay added daily was reduced to 15 g. Each day, half of the fermentor liquid was removed and replaced with anaerobic culture medium that had been modified by the removal of most nutrients to leave a balanced salts solution. The fermentor vessel was maintained at 39oC and continuously bubbled with a mixture of CO2:H2 (95:5 v/v) to maintain anaerobic conditions. On the fifth day the diet was changed to include coconut oil, coconut flesh or ground cottonseed to deliver the oil component at 0, 3 or 7% (coconut oil), 0, 3, 5 or 7% (coconut flesh) or 0, 5, or 7% (cottonseed) (w/w) of the ration.
To determine effects of plant fibre digestion in the ruminal environment, 12 nylon bags on two metal supports were inserted into the fermentor. Each bag contained a pre-weighed amount of ground spear grass (approx 1 g). At zero time and at two day intervals, two bags were removed to determine dry matter disappearance as a measure of plant fibre digestion.
Total fermentation time per experiment was 11 days.
Each day, at the time of replacement of fermentor liquor with fresh salts solution, samples of fermentor liquor were collected for determination of volatile fatty acid production (as per Ouwerkerk and Klieve, 2001), to enumerate total methanogens (by Real-Time PCR for archaea) and to profile methanogen populations (by denaturing gradient gel electrophoresis (DGGE)). Methane concentrations in the outflow gas from the fermentor were measured continuously throughout the experiments using an Environmax NDIR Methane Analyser (Liston Scientific).
3.1.2 Real-Time PCR and DGGE
Total genomic DNA was extracted from thawed samples of fermentor liquor, using a bead-beating protocol (Yu and Forster 2005). Partial 16S rRNA genes of archaea were amplified from the extracted genomic DNA by PCR. A nested PCR procedure was used with primers Arch46F (Ovreas et. al. 1997) and Arch1017R (Barns et. al., 1994) used in the first round of amplification. The resulting PCR product was used as template in the second PCR which amplified across the variable regions 2 and 3 (V2V3) of the 16S rRNA gene using the primers Arch344F-GC (Raskin
et. al., 1994) and Univ522R (Amann et. al. 1995). DGGE through a 30–60% gradient was used
to separate the resulting PCR products and the gel silver stained (Kocherginskaya et al. 2005) to show which DNA bands (corresponding to methanogen species) were present in the fermentor.
A partial 16S rRNA gene clone library (50 clones) was established to determine which species were present and to determine relative abundance within the archaeal community. The PCR product (approx 950 bp) from the first PCR amplification was cloned using the TOPO TA cloning kit. The extracted plasmids were used in the second PCR to amplify the V2V3 region which was analysed by DGGE to determine which band of the profile it represented. A number of representative clones were DNA sequenced and the resulting sequence data was run through the GenBank database using BLAST analysis to determine their identities.
3.2 Pen study: Effect of supplements containing different oils on the growth and
methane production of cattle
3.2.1 Animals,
treatments
and experimental design
The experiment was carried out at “Brian Pastures” Research Station via Gayndah, Qld between August and October 2007. Commercial Brahman crossbred weaner heifers approximately 10-12 months of age and weighing 165.2 ± 1.29 (± SE) kg liveweight (at trial commencement), were sourced from Swans Lagoon Research Station in North Queensland. They were vaccinated against tick fever and also tetanus, blackleg, malignant oedema, black’s disease & enterotoxaemia (5-in-1) and bovine ephemeral fever. They also received an application of Cydectin® Pour-on to reduce any parasitic burdens prior to commencement of the experiment.
The experimental design was a randomised complete block incorporating a 2 x 2 x 3 factorial, with 2 basal diets, 2 supplement types and 3 rates of supplement feeding. The basal feeds were pangola grass (Digitariaeriantha) hay fed ad libitum or the same hay fed at 0.75% of liveweight (W; as fed basis)/day plus a molasses mix comprising molasses (100 parts w/w, as fed), urea (3), Kynophos (1) and salt (1) fed ad libitum. The supplements were cottonseed meal plus cottonseed oil or copra meal plus coconut oil, both formulated to contain 20% oil (DM basis). For each basal feed type there was an unsupplemented control and the two supplements were fed at 0.2, 0.4 and 0.6%W/day. There were three heifers for each treatment making a total of 42 heifers. The treatment plan is summarised below:
Feed type and level of intake
Pangola hay Molasses
mix
Supplement
H* Ad libitum Nil Nil 0
H-CS2 Cottonseed meal + oil 0.2%W
H-CS4 0.4%W
H-CS6 0.6%W
H-Cop2 Copra meal + oil 0.2%W
H-Cop4 0.4%W
H-Cop6 0.6%W
MH 0.75%W (as fed) Ad libitum Nil 0
MH-CS2 Cottonseed meal + oil 0.2%W
MH-CS4 0.4%W
MH-CS6 0.6%W
MH-Cop2 Copra meal + oil 0.2%W
MH-Cop4 0.4%W
MH-Cop6 0.6%W
* - H – hay; M – molasses; CS – cottonseed meal/cottonseed oil (80/20); Cop – copra meal/coconut oil (80/20); W - liveweight
3.2.2 Procedures
The experiment consisted of a 7 day equilibration period followed by a 49 day growth study and a 10 day methane collection period. During the equilibration period the heifers were fed pangola
hay ad libitum only in group pens of four heifers. The heifers were weighed full and fasted (24 h
off feed, 16 h off water) at the end of this equilibration period and allocated to treatments by stratified randomisation on the basis of this fasted liveweight (day 0). Heifers were divided into three weight classes at allocation with each class representing a replicate in the above pen structure.
During the growth study, the hay was fed daily and residues collected once weekly. Hay was chaffed to lengths averaging 5 cm. For groups receiving the basal diet of hay alone, the hay was fed to each heifer at a level estimated to provide about 15% in excess of its intake on the previous day, thereby maintaining ad libitum intake. For other groups receiving the molasses mix as well, the hay was fed at a restricted rate of 0.75% of bodyweight (W)/day with the hay intake re-calculated once weekly for each heifer based on its most recent liveweight determination. During week 1 the hay was initially provided to this group ad libitum and then gradually reduced to treatment intake over the next 4 days. The molasses mix was prepared by mechanically mixing the various ingredients, without water addition, in a paddle mixer for at least 25 min or until no granules of urea could be seen or felt in the mix. This molasses mix was provided in a separate feeder to the hay and fed as regularly as required, usually twice weekly, to ensure uninterrupted access by the animal to the mix and thereby maintain ad libitum intake. Each week, to coincide with residuing of the hay, the molasses mix remaining in the feeders was weighed but not discarded except at the end of weeks 3, 5 and 7 when residual mix was weighed and discarded.
The supplements were fed daily separate from the hay and molasses mix. The cottonseed and copra meals were first analysed to determine their lipid content (by ether extraction), which were
ca. 3.4 and 9.8% DM, and then the required amounts of cottonseed or coconut oil, respectively, were added so that the final oil content in both mixed meals was 20% (w/w, on a DM basis). This required addition of ca. 20.4 g cottonseed oil and 12.2 g coconut oil per 100 g to cottonseed or copra meal (as fed), respectively. The oil was gradually added to the meal in a cement mixer and the 2 components were thoroughly mixed over at least 10 min. To encourage intake, the supplements were fed ca. 30 min prior to the hay or molasses. Supplement allowances were adjusted once weekly for each steer based on the most recent liveweight. Where supplements were not totally consumed they were residued once weekly, at the same time as the hay, or more often if residue amounts became excessive during the week. Owing to poor acceptance of these supplements by some heifers, molasses (45-90 g/day, as fed) and lucerne chaff (Medicago
sativa; 35 g/day, as fed) were added to the supplements of some heifers from days 7-14 and
17-21, respectively. From day 22 the supplements were fed without additives.
Heifers were weighed, unfasted, once per week in the morning prior to feeding (8 am). The amount of hay fed to each heifer receiving molasses, and of supplement fed to all heifers, was adjusted each week on the basis of this liveweight measurement.
Representative samples of the hay, molasses mix and supplements were taken at each feeding, and of the hay and supplement refusals at the time of collection, and dried to constant weight at 60oC to determine dry matter (DM) content. Separate samples of the feed sources and their components were taken at the same time and bulked over weeks 1-5 and 6-9 for chemical analysis. Hay and meal samples were milled through a 1 mm screen prior to analysis.
and divided into several samples, viz., (i) 15 mL acidified to pH< 3 with concentrated sulphuric acid for determination of the concentration and molar proportions of volatile fatty acids (VFAs); (ii) 4 mL added to equal volume of 0.2N hydrochloric acid to determine ammonia (NH3-N) concentration; (iii) 4 mL added to 16 mL of formal saline for later enumeration of protozoa and (iv) 1 mL taken and centrifuged at 13200 rpm for 10 minutes and the pellet frozen for subsequent molecular diversity work. The amount of supplement and molasses, but not hay, consumed between feeding and sampling was also determined.
From day 43 to 49 (inclusive) all faeces on the floor (concrete) of each pen of heifers receiving the hay only basal diet was collected (21 heifers) daily. This collection was undertaken twice daily. Each day the total faeces for each heifer was weighed, thoroughly mixed and a representative 10% by weight sub-sample taken and frozen. After the final collection, the daily sub-samples for each individual heifer were thawed, bulked and mechanically mixed. A further sub-sample was taken and dried to constant weight at 60oC over at least 7 days and faecal DM output and the digestibility of DM (DMD) were determined.
3.2.3 Methane
measurement
The methane collection phase was undertaken with the 21 heifers which received the hay only basal feed, with and without supplements. It commenced one day after the completion of the growth study. The feeding regime during this period was maintained the same as that used for the growth phase. Methane production was determined using the sulphur hexafluoride (SF6) tracer approach of Johnson et al. (1994) as modified by Hegarty et al. (2007). High flow permeation tubes releasing SF6 at precise, gravimetrically determined rates (115.1± [SE] 1.2 mg SF6/day) were inserted per os into the rumen of each of the heifers using a balling gun. The next day, evacuated aluminium canisters (560 x 100 x 75 mm) were attached to the back of the animal using a Velcro strap and connected using 1/8” tubing to sampling tubes held over the nose of the animal by attachment to a halter. Cattle had been fitted with sampling halters for one week during the latter stages of the growth phase to accustom them to the equipment. After 48 h canisters were changed for new evacuated canisters and the old canisters (mean vacuum remaining = 54 kPa) were taken for analysis. Four consecutive two-day collection periods were used with canisters evacuated and flushed twice between uses. Samples were withdrawn from methane collection canisters into 5 L tedlar bags using a dry piston pump (Welch Rietschle Thomas; Skokie IL, USA: Model 2581) prior to analysis. Samples from the collection canisters were analysed for SF6 using an electron capture detector with methane being analysed using an Innova 1312 photoacoustic multigas analyser. The heifers were weighed each time the canisters were changed over. Hay and supplement intake were determined every 2 days coinciding with the collection period of each canister.
3.2.4 Chemical
analysis
Ash: Ash content was determined by combusting dry samples in an electric muffle furnace (Thermogravimetric Analyser TGA-601, LECO Corporation) at 600oC for 2 h.
Total N: Samples were analysed for total N by a combustion method (Sweeney 1989) using an
ELEMENTAR RapidN Analyser (ELEMENTAR ANALYSENSYSTEME, Germany).
NDF and ADF: Samples were analysed for NDF and ADF content using a FIBRETEC 2021
Fibrecap system (FOSS TECATOR). The NDF content was expressed on an ash-free basis but was uncorrected for residual protein.
Ammonia-N (NH3-N) in rumen fluid: NH3-N concentration was determined using an Olympus
Reply Clinical Analyser, based on a reaction described by Boller et al. (1961).
3.2.5 Statistical
methods
Responses to amount of supplement (% liveweight/day) were described using general linear models. For each variable considered the models initially included terms for replicate, pen size and pen side, and separate quadratic response curves for each type of diet. As expected the terms for pen size and pen side were not statistically significant (P = 0.05) so these were removed for subsequent analyses. The models were then refined by successively removing other terms (except replicate) which were not statistically significant (P = 0.05), to reduce the degree of the response curve and/or to fit common response curves for the two supplement types within basal diet type (hay or hay/molasses), until all terms in the final model for the variable were statistically significant (P < 0.05). As part of the model fitting the assumptions of homogeneity of variance and absence of outliers were checked by examining plots of residuals against fitted values. All analyses were done using the statistical package GenStat (2007).
4 Results and Discussion
4.1 In vitro studies – coconut oil
4.1.1 Effect
on
fibre utilisation
Summary results are presented in Figure 1.
Figure 1. Percent reduction of ground spear grass from nylon bags over time in the fermentor. Each curve is the average of three fermentations. Bars show standard deviation from the mean. Arrow indicates the day addition of coconut oil began.
The addition of coconut oil did reduce the fibrolytic activity within the fermentor. As expected the reduction was greatest with the higher concentration of oil (7%). The total reduction was in the vicinity of 20% below the maximum reached in the control fermentations but may have been greater had the oil been introduced earlier. Whether this effect is significant in the overall nutrition of cattle is open as it may be off set by the increase in energy density of the diet.
0 10 20 30 40 50 60 70
Control/Day1 Day3 Day5 Day7 Day9 Day11
% DM
dis
a
ppeara
n
ce
Control
4.1.2 VFA
production
The daily production of total VFA, acetate, propionate and butyrate are presented in Figure 2.
Figure 2. Daily average total VFA (a), acetate (b), propionate (c) and butyrate (d) production. Results of three fermentations for each concentration of oil were averaged. Bars represent one standard deviation. Coconut oil was added to the diet from day 5 onwards.
The addition of coconut oil appeared to have a marked impact on VFA production and the proportions of VFA’s as acetate, propionate or butyrate. Total VFA production was suppressed to about 50% by 7% coconut oil mainly through a reduction in both acetate and propionate. 3% inclusion of coconut oil also suppressed total VFA, acetate and propionate but to a lesser extent than 7% coconut oil, as would be expected. Although a more minor component of the total VFA pool (about 10%), the proportion of VFA produced as butyrate was actually increased by the presence of coconut oil.
4.1.3 Methane
production
Daily methane produced by the fermentations is presented in Figure 3.
Daily Total VFA production
0.00 20.00 40.00 60.00 80.00 100.00 120.00
4 5 6 7 8 9 10 11
Day mmo l/ d a y Control 3% Coconut Oil 7% Coconut Oil
Acetate 0 10 20 30 40 50 60 70
4 5 6 7 8 9 10 11
Day mm o l/ d a y Control 3% Coconut Oil 7% Coconut Oil
Propionate 0.00 5.00 10.00 15.00 20.00 25.00 30.00 35.00 40.00
4 5 6 7 8 9 10 11
Day mmo l/ d a y Control 3% Coconut Oil
7% Coconut Oil
Butryrate -4.00 -2.00 0.00 2.00 4.00 6.00 8.00
4 5 6 7 8 9 10 11
Day mm o l/ d a y Control
3% Coconut Oil
Figure 3. Daily methane production from fermentations with coconut oil added to the diet. Oil was added to the feed from day 5 onwards.
Unfortunately, reliable methane data was only achieved later in the project and data from one run with each level of inclusion is presented. From day 4 onwards the daily methane production without addition of coconut oil remained stable with between 40 and 45 mmol of methane produced each day. The production from the 3% oil addition was also stable and this level of inclusion appears to have had little effect as the overall daily production was lower in this fermentation than with the control. However, inclusion at 7% of the diet appears to have had a dramatic effect reducing methane generation at the end of the fermentation period to just 20% of that in the control fermentation.
4.1.4 Methanogen
population density and diversity
The total numbers of methanogens, as determined by real-time PCR, present in the fermentor runs are presented in Figure 4.
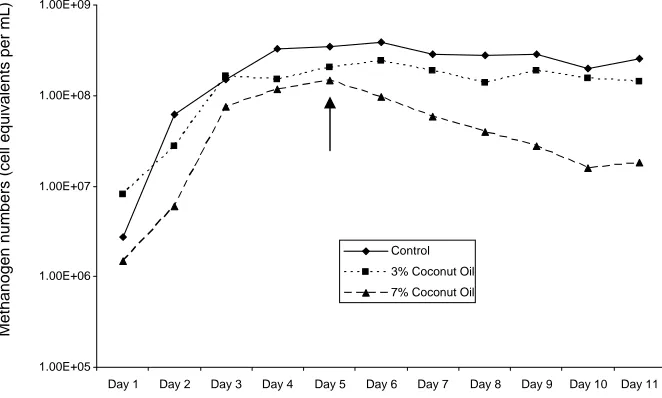
Figure 4. Cell equivalents of total archaeal numbers in fermentation liquor. Curves are averages of three fermentations each. Coconut oil was added to the diet from day 5 onwards (first day of addition indicated with an arrow).
0 10 20 30 40 50 60
day4 day5 day6 day7 day8 day9 day10
Methane pr
oduction (m mo
l)
0% Coconut Oil Run 4 3% Coconut Oil Run 3 7% Coconut Oil Run 4
1.00E+05 1.00E+06 1.00E+07 1.00E+08 1.00E+09
Day 1 Day 2 Day 3 Day 4 Day 5 Day 6 Day 7 Day 8 Day 9 Day 10 Day 11
Methanogen
nu
mbers (cell equivalents per mL)
The numbers of methanogens in control fermentations rapidly increased over the first four days of fermentation to stabilise at just above 108 cell equivalents per mL of fermentor liquor. This community density was maintained for the remainder of the fermentation. The addition of 3% coconut oil had no noticeable impact on the population density of the methanogens, whereas 7% coconut oil had an immediate impact and the density steadily decreased throughout the remainder of the fermentation. By the end of the fermentation the community density of methanogens in fermentations with 7% coconut oil was only 10% of that in the controls (and the 3% fermentations).
Typical DGGE gels of the archaeal community within the fermentor during a control fermentation and a 7% oil fermentation are presented in Figure 5.
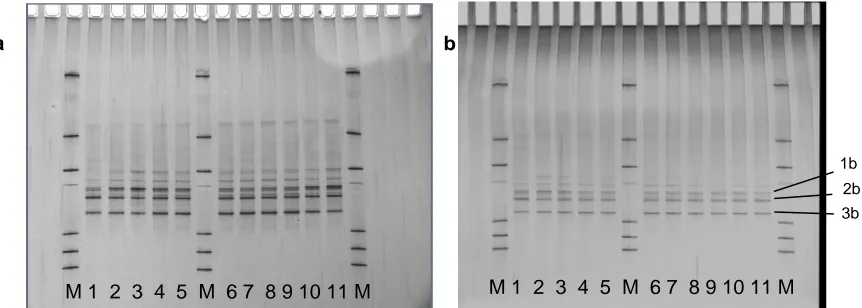
Figure 5. DGGE profiles of the archaeal community in fermentors without coconut oil addition (a) and with 7% addition (b). M – Markers. Numbers correspond to day of fermentation. 1b, 2b and 3b were bands selected for DNA sequencing.
It is evident from Fig. 5 that the diversity amongst the methanogen community changed very little throughout each fermentor run with and without the addition of coconut oil. Although not presented, all of the other fermentor runs, be they control, 3% or 7% coconut oil gave similar results to the two gels in Fig. 5. A limited clone library of 50 clones was made from extracted DNA from a control fermentor run and 96% of the clones were represented by the three species corresponding to bands 1b, 2b and 3b. DNA sequencing of clones representative of these bands found that the three were closely related to two different Methanobrevibacter sp. (currently unnamed), one isolated in Western Australia and the other in New Zealand. The closest related named species was Methanobrevibacter thauri.
It appears that the negative impact that 7% oil had on the methanogen community was equally shared across the species present.
4.1.5 Summary
Coconut oil at 3% inclusion in the diet had very little impact on methane production or the methanogen community within the fermentor although it did alter VFA production and may have reduced fibrolytic activity slightly. Increasing the addition of coconut oil to 7%, however, had a marked impact on methane generation (reduction of 80%) primarily through an across the board reduction in the numbers of methanogens (reduced to 10% of the number in control fermentations). This level of inclusion also moved VFA production away from acetate and propionate and towards butyrate but with an overall depression in VFA production. It also reduced fibrolytic activity.
M 1 2 3 4 5 M 6 7 8 9 10 11 M M 1 2 3 4 5 M 6 7 8 9 10 11 M
a b
1b
2b
4.2 In vitro studies – effect of coconut flesh
4.2.1 Effect
on
fibre utilisation
Summary results are presented in Figure 6.
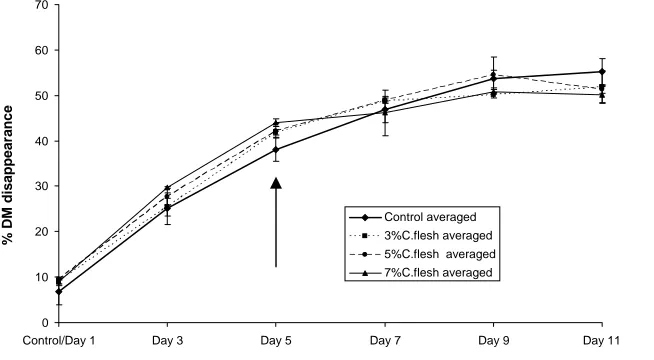
Figure 6. Percent reduction of ground spear grass from nylon bags over time in the fermentor. Each curve is the average of two fermentations. Bars show standard deviation from the mean. Arrow indicates the day addition of desiccated coconut flesh began.
The addition of desiccated coconut flesh did not appear to reduce fibrolytic activity within the fermentor.
0 10 20 30 40 50 60 70
Control/Day 1 Day 3 Day 5 Day 7 Day 9 Day 11
% DM
dis
a
ppeara
n
ce
4.2.2 VFA
production
The daily production of total VFA, acetate, propionate and butyrate are presented in Figure 7.
Acetate 0.00 10.00 20.00 30.00 40.00 50.00 60.00
4 5 6 7 8 9 10 11
Day mmo l/ d a y Control Runs 3%C.flesh 5%C.flesh 7%C.flesh Butyrate -6 -4 -2 0 2 4 6 8 10
4 5 6 7 8 9 10 11
Day m m o l/d a y Control Runs 3%C.flesh 5%C.flesh 7%C.flesh
Figure 7. Daily average total VFA (a), acetate (b), propionate (c) and butyrate (d). Results of two fermentations for each concentration of desiccated coconut flesh. Bars represent one standard deviation. Whole coconut flesh was added to the diet from day 5 onwards.
The addition of desiccated coconut flesh did affect VFA production and the proportions of VFA’s as acetate, propionate or butyrate. Total VFA production was suppressed to about 50% by coconut flesh delivering 7% oil mainly through a reduction in both acetate and propionate. Lesser concentrations of flesh in the diet reduced the overall impact on VFA production but not markedly. Although a minor component, the concentration of butyrate was increased considerably by the presence of coconut flesh (up to 100% increase with coconut flesh delivering 7% oil to the diet). The impact of coconut flesh on VFA production appears similar to that of oil alone at similar concentrations of oil in the diet.
4.2.3 Methane
production
Daily methane produced by the fermentations is presented in Figure 8.
c
Daily Total VFA production
0 10 20 30 40 50 60 70 80 90 100
4 5 6 7 8 9 10 11
Day mm o l/ d a y Control Runs 3%C.flesh 5%C.flesh 7%C.flesh Propionate -5 0 5 10 15 20 25 30 35 40
4 5 6 7 8 9 10 11
Day mmo l/ d a y Control Runs 3%C.flesh 5%C.flesh 7%C.flesh
Methane Production
0.0 10.0 20.0 30.0 40.0 50.0 60.0
Day 4 Day 5 Day 6 Day 7 Day 8 Day 9 Day 10
m mo
l C
H4
Control Run 4 3% Flesh
5% Flesh
7% Flesh
Figure 8. Daily methane production from fermentations with whole coconut flesh added to the diet. Coconut flesh was added to the feed from day 5 onwards. Data is from duplicate fermentations, except for the control and 3% oil equivalent diet where reliable data was available from one fermentation only. Bars show standard deviation from the mean.
Reliable methane data was only obtained from one control fermentation (see earlier data) and one fermentation with coconut flesh delivering 3% oil. From day 4 onwards the daily methane production without addition of coconut flesh remained stable with between 40 and 45 mmol of methane produced each day. The production from the fermentation with flesh delivering 3% oil was also stable and this level of inclusion appears to have had little effect as the overall daily production was similar at the end of fermentation to the level on day 5 (prior to addition of coconut flesh). However, inclusion of coconut flesh to deliver 5 and 7% oil to the diet appears to have had an effect reducing methane generation at the end of the fermentation period to less than 50% of that on day 5.
4.2.4 Methanogen
population density and diversity
The total numbers of methanogens, as determined by real-time PCR, present in the fermentor runs are presented in Figures 9 and 10.
Figure 9. Cell equivalents of total archaeal numbers in fermentation liquor. Curves are averages of two (three for controls) fermentations each. Coconut flesh was added to the diet from day 5 onwards (first day of addition indicated with an arrow).
1.00E+05 1.00E+06 1.00E+07 1.00E+08 1.00E+09
Day 1 Day 2 Day 3 Day 4 Day 5 Day 6 Day 7 Day 8 Day 9 Day 10 Day 11 Control
3%C.flesh 5%C.flesh 7%C.flesh
M
e
th
a
n
e
p
roduc
ti
o
n
(m m
o
l)
Methanogen
nu
The numbers of methanogens in control fermentations rapidly increased over the first four days of fermentation to stabilise at just above 108 cell equivalents per mL of fermentor liquor. This community density was maintained for the remainder of the fermentation. The inclusion of coconut flesh reduced methanogen populations. However, the methanogen populations in fermentations with flesh delivering 3 and 7% oil, in particular, did not reach the same initial, pre-treatment, density as in the control (and 5%) fermentations, therefore, the impact of inclusion is better gauged by comparing the final population density with the density at day five. When this is done, inclusion to deliver 3% oil had only a minor impact whereas both 5 and 7% reduced populations by approximately a half to two thirds of a log, or 50–75%. This is comparable with earlier fermentations with 7% purified oil in diets.
Also, treated fermentations showed a lag of 24 hours before populations increased; this did not happen in the first two control fermentations but it did with the third. The reason for this lag could be due to the length of frozen storage of the starter cultures, resulting in some death of methanogens in storage, as the first (control) fermentations were unaffected but all later fermentations have shown this lag. A better comparison is shown in Fig. 10, where only the control fermentation that was affected by the lag is included.
Figure 10. Cell equivalents of total archaeal numbers in fermentation liquor. Curves are averages of two fermentations except for the control which is only for control run 4. Coconut flesh was added to the diet from day 5 onwards (first day of addition indicated with an arrow).
A comparison between methanogen numbers and methane production shows a reasonably good general agreement between fermentations with the highest methanogen numbers corresponding with the highest methane emissions.
Typical DGGE gels of the archaeal community within the fermentor during a control fermentation and a whole coconut flesh (7% oil) fermentation are presented in Figure 11.
1.00E+05 1.00E+06 1.00E+07 1.00E+08 1.00E+09
Day 1 Day 2 Day 3 Day 4 Day 5 Day 6 Day 7 Day 8 Day 9 Day 10 Day 11
Methanogen
Nu
mbers (cell equivalents per mL)
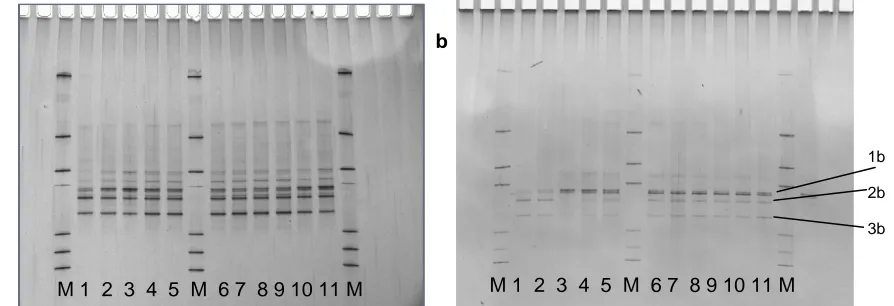
Figure 11. DGGE profiles of the archaeal community in fermentors without whole coconut flesh addition (a) and with sufficient coconut to deliver 7% oil (b). M – Markers. Numbers correspond to day of fermentation. 1b, 2b and 3b were bands from which for DNA sequence was obtained previously.
It is evident from Fig. 11 that although the diversity amongst the methanogen community changed very little throughout each fermentor run with and without the addition of whole coconut flesh, the dominance of species is not identical between the early control fermentations and later fermentations. In particular, the later runs showed a different community structure on the first two days of the run, during the lag, than later in the run, which tends to re-affirm the point made above about length of storage of starter cultures. However, once established and prior to addition of coconut flesh (days 3 – 5) the population structure was stable and remained so despite the addition of coconut flesh. Although not presented, the other fermentor runs, with coconut flesh to deliver 3, 5 or 7% oil gave similar results to gel b in Fig. 11. It appears that the impact of coconut flesh (as with purified oil) was equally shared across the methanogen community.
4.2.5 Summary
The impact of whole desiccated coconut flesh on the methanogen population was similar to that observed with purified oil. Flesh delivering 3% oil had a minor impact on methane production and the methanogen community, whereas flesh delivering 5 and 7% oil had a marked impact, reducing methanogen numbers by 50–75% and methane production by approximately 50%. VFA production was reduced, quite markedly at times, but the impact of coconut flesh as compared to the purified oil, on the digestion of plant fibre was less pronounced. This is probably due to the provision of protein and other nutrients with the coconut flesh that was not present in the oil. Therefore, coconut flesh does appear to be an effective mechanism for the delivery of coconut oil in feed in that it delivers the same methane suppression as the oil itself but has less impact on ruminal fibre digestion.
4.3 In vitro studies – ground cottonseed
4.3.1 Effect
on
fibre utilisation
Summary results are presented in Figure 12.
M 1 2 3 4 5 M 6 7 8 9 10 11 M M 1 2 3 4 5 M 6 7 8 9 10 11 M
a b
1b
2b
Figure 12. Percent reduction of ground spear grass from nylon bags over time in the fermentor. Each curve is the average of three fermentations. Bars show standard deviation from the mean. Arrow indicates the day addition of ground cottonseed began.
At day 11, 58% of the plant fibre was digested in the control treatment. The addition of ground cottonseed reduced fibrolytic activity within the fermentor when fed at a concentration that delivered 7% oil in the diet. Below this concentration (i.e. at 5% inclusion) cottonseed appeared to have no impact on reducing fibre digestion in the fermentor. The reduction at 7% oil concentration was relatively small with an approximate reduction in digestibility of 10% compared with the control fermentations.
0 10 20 30 40 50 60 70
Control/Day1 Day3 Day5 Day7 Day9 Day11
% DM Disappea
rance
4.3.2 VFA
production
The addition of ground cottonseed depressed daily VFA production slightly (approximately 20%) and more so with 7% than 5% cottonseed oil (Figure 13).
Figure 13. Daily average total VFA (a), acetate (b), propionate (c) and butyrate (d). Results of three fermentations for each concentration of cottonseed. Bars represent one standard deviation. Ground cottonseed was added to the diet from day 5 onwards.
The proportions of VFA’s as acetate, propionate or butyrate were also slightly lowered comparative to the controls. This was particularly interesting in comparison to coconut oil and whole coconut flesh as the reductions were less for total VFA, acetate and propionate but unlike the coconut products which increased butyrate production, cottonseed reduced butyrate production (slightly).
4.3.3 Methane
production
From day 4 onwards the daily methane production without addition of ground cottonseed remained stable with between 40 and 50 mmol of methane produced each day (Figure 14).
a b
d
Total Daily VFA Production
0 20 40 60 80 100 120 140
4 5 6 7 8 9 10 11
Day m m o l/d a y Control 5% Cottonseed 7% Cottonseed Propionate 0 5 10 15 20 25 30 35 40 45 50
4 5 6 7 8 9 10 11
Day
mmo
l/
d
a
y Control5% Cottonseed
7% Cottonseed Butyrate -10 -8 -6 -4 -2 0 2 4 6
4 5 6 7 8 9 10 11
Day mm o l/ d a y Control 5% Cottonseed 7% Cottonseed Acetate 0 10 20 30 40 50 60 70 80
4 5 6 7 8 9 10 11
Methane Production
0.0 10.0 20.0 30.0 40.0 50.0 60.0
Day 4 Day 5 Day 6 Day 7 Day 8 Day 9 Day 10
m mo
l
C
H4
Control 5% Cotton Seed 7% Cotton Seed
Figure 14. Daily methane production from fermentations with ground cottonseed added to the diet. Cottonseed was added to the feed from day 5 onwards. Data is from triplicate fermentations. Bars show standard deviation from the mean.
The results from the fermentations with cottonseed delivering either 5 or 7% oil indicate reduced total methane emitted, with the higher level of oil having a greater effect. The effect on methane production was immediate with a reduction observed within one day of adding ground cottonseed. It should be noted that there was considerable variability between runs and one run with 5% oil equivalent was particularly low in emissions and this run may have skewed the data for the 5% inclusion to lower than it otherwise would have been. The methane reducing capacity of ground whole cottonseed appeared to be lower, on a percentage oil content basis, than with coconut products but also it did not appear to inhibit other fermentation parameters, as indicated by VFA production and dry matter utilisation, as did coconut oil in particular.
4.3.4 Methanogen
population density and diversity
The total numbers of methanogens, as determined by real-time PCR, present in the fermentor runs are presented in Figure 15.
Figure 15. Cell equivalents of total archaeal numbers in fermentation liquor. Curves are averages of three fermentations each. Ground cottonseed was added to the diet from day 5 onwards (first day of addition indicated with an arrow).
The numbers of methanogens in control fermentations rapidly increased over the first four days of fermentation to stabilise at just below 108 cell equivalents per mL of fermentor liquor. This
1.00E+04 1.00E+05 1.00E+06 1.00E+07 1.00E+08
Day 1 Day 2 Day 3 Day 4 Day 5 Day 6 Day 7 Day 8 Day 9 Day 10 Day 11
Methanogen
Nu
mbers (cell equivalents per mL)
S2 Control Runs 5% Cottonseed Runs 7% Cottonseed Runs
Methane pr
oduct
community density was maintained for the remainder of the fermentation. The inclusion of ground cottonseed at 5% oil in the diet appeared to have no effect on methanogen numbers, while 7% oil in the diet reduced the population markedly at times, although the impact was highly variable.
Methanogen numbers and methane production are in reasonably good general agreement, for fermentations with 7% oil, with low methanogen numbers and low methane emissions. Fermentations with 5% oil were more variable for methane emissions and this amount of oil appeared to have no direct effect on methanogen numbers.
Typical DGGE gels of the archaeal community within the fermentor during a control fermentation and a ground cottonseed (7% oil) fermentation are presented in Figure 16.
Figure 16. DGGE profiles of the archaeal community in fermentors without cottonseed addition (a) and with sufficient cottonseed to deliver 7% oil (b). M – Markers. Numbers correspond to day of fermentation. 1b, 2b and 3b were bands from which for DNA sequence had been obtained previously.
It is evident from Figure 16 that the diversity amongst the methanogen community changed very little throughout each fermentor run with and without the addition of cottonseed. It appears that the impact of cottonseed, as with the coconut products previously investigated, was equally shared across the methanogen community.
4.3.5 Summary
The impact of ground cottonseed on methanogenesis at 7% oil inclusion in the diet was similar to that with 7% coconut oil (milestone 2 report). However, while measurable reductions in methane occurred, the impact of cottonseed on dry matter digestion and VFA production was less adverse than with the coconut products. Cottonseed inclusion at 5% oil content of the diet appeared to have a minimal impact on fermentations including on the reduction in methane emissions.
4.4 Pen study: Effect of supplements containing different oils on the growth and
methane production of cattle
Given the variable impact of both coconut and cottonseed oils on methane emissions and methanogen numbers in vitro it was decided to use a response curve approach relating oil intake to liveweight gain and methane emission that would relate these factors across the spectrum of oil concentrations.
4.4.1 Cattle growth and methane production
After an initial equilibration period, intakes of the cottonseed meal/oil supplement approached the prescribed intakes. However, with the copra meal/coconut oil, supplement intakes were well below desired levels and the average intake across heifers was relatively low and intakes were closely grouped, as is shown below.
M 1 2 3 4 5 M 6 7 8 9 10 11 M M 1 2 3 4 5 M 6 7 8 9 10 11 M
a b
1b
2b
Cumulative live weight gains in cattle fed the different concentrations of oil in the diet are presented in Figure 17.
0 1 2 3 4 5 6 7
Cum
u
la
ti
ve l
ivew
e
ight change (
k
g)
-10 0 10 20 30
40 H H-CS2
H-CS4 H-CS6 H-Cop2 H-Cop4 H-Cop6
Time (weeks)
0 1 2 3 4 5 6 7
-10 0 10 20 30
40 MHMH-CS2
MH-CS4 MH-CS6 MH-Cop2 MH-Cop4 MH-Cop6
Time (weeks)
A
B
Figure 17. Effect of supplements on the cumulative liveweight change of heifers given a basal diet of (A) low quality
pangola grass hay ad libitum or (B) pangola grass hay (0.75%W/d) + molasses/urea mix ad libitum. Symbols
represent means for treatment groups.
On the hay only basal diet, the hay control (H) maintained live weight over the 7 week growth study. Heifers receiving cottonseed meal (CS) and to a lesser extent copra meal (Cop) showed steady response to supplement inclusion. With the hay plus molasses diet heifers showed an initial decline in live weight, which on past experience is normal for animals on this diet type and probably relates to gut fill effects, and subsequently gained at a greater rate than those on hay only diets.
For both basal diet types growth rate increased with increasing supplement intake and there was no difference (P>0.05) in the response pattern with the CS or Cop supplements (Figure 18). However, the response tended to be greater on the molasses-based diet compared to hay alone diets. Differences between diet types were not analysed, however, as the main interest was in the responses within diet type. The response relationships for the two diet types are shown below and in Figure 18. A single linear relationship applies for both supplement types.
Hay basal diet:
CS/Cop: Average daily gain (kg) = 0.014 + 0.909 SI, (R2 = 0.690; RSD = 0.115; P<0.001);
Molasses/hay basal diet:
CS/Cop: Average daily gain (kg) = 0.026 + 1.225 SI, (R2 = 0.690; RSD = 0.115; P<0.001);
Supplement DM intake (%W/d)
0.0 0.1 0.2 0.3 0.4 0.5 0.6
Av
er
age daily
gain (k
g)
-0.3 -0.2 -0.1 0.0 0.1 0.2 0.3 0.4 0.5 0.6 0.7
CS Copra
Supplement DM intake (%W/d)
0.0 0.1 0.2 0.3 0.4 0.5 0.6 -0.3
-0.2 -0.1 0.0 0.1 0.2 0.3 0.4 0.5 0.6 0.7
CS Copra
A
B
Figure 18. Effect of supplement intake on the average daily gain of heifers given a basal diet of (A) low quality pangola
grass hay ad libitum or (B) pangola grass hay (0.75%W/d) + molasses/urea mix ad libitum. Symbols represent values
for individual heifers.
Previous studies, e.g., NAP3.122, have also shown similar responses to copra meal and cottonseed meal. This occurs despite the copra meal having only half the protein content of cottonseed meal thereby indicates a much higher response per unit protein intake for copra meal compared with cottonseed meal. However, the earlier studies have shown a curvilinear response to increasing protein meals in the diet when lower quality forages are used, the high response at low intake reflecting a correction of a rumen degradable nitrogen deficiency in the rumen. The slightly higher quality, i.e., N content, of the hay in the present study may have produced the observed difference between the different experiments. The higher liveweight response to supplement for the molasses diets compared to hay alone diets reflect a greater availability of digestible organic matter and thereby higher capacity for response to nitrogen supplementation with the molasses diets.
As the oil content of the two supplements was constant at 20% of supplement DM, the effect of oil intake (%W/d) on average daily gain is reflected in above trends as well. Live weight gain as a function of the supplement oil intake of the heifers is presented in Figure 19. With the hay only basal diet, the supplement oil concentrations in total DM intake ranged from 0 to about 6.5%, the higher values being for CS which was more readily consumed than with Cop. The corresponding range for the molasses/hay diets was 0 to about 4.5%. There was a linear relationship between oil intake and growth rate which generally reflected the previous relationships between supplement DM intake and growth rate, as would be expected given that the oil represented 20% of the supplement DM. Within basal diet type, there was no difference between supplement types in these relationships (P>0.05). The most significant finding here was that even at the highest oil contents in the diet growth rate was not apparently affected. The linear relationships between growth rate and supplement oil intake are as follows:
Hay basal diet:
CS/Cop: Average daily gain (kg) = 0.026 + 0.063 Oil%, (R2 = 0.600; RSD = 0.131; P<0.01);
Molasses/hay basal diet:
where Oil% is percentage supplement oil in total DM intake. The R2 and RSD apply to the model for the full data set representing both diet types.
Oil in diet (%DMI)
0 1 2 3 4 5 6 7
-0.1 0.0 0.1 0.2 0.3 0.4 0.5 0.6 0.7
CS Cop
Oil in diet (%DMI)
0 1 2 3 4 5 6 7
Aver
ag
e d
a
ily
ga
in
(k
g)
-0.1 0.0 0.1 0.2 0.3 0.4 0.5 0.6 0.7
CS
Cop
A
B
Figure 19. Effect of supplement oil content in the total DM on the average daily gain of heifers given a basal diet of (A)
low quality pangola grass hay ad libitum or (B) pangola grass hay (0.75%W/d) + molasses/urea mix ad libitum.
Symbols represent values for individual heifers.
The impacts of supplements on the intake of hay and total DM are presented in Figure 20. With the hay only basal diet (Figure 20A), CS increased hay intake at low levels of supplement intake, presumably as the supplement corrected a rumen degradable nitrogen deficiency, then reduced it at higher intakes. This effect described a quadratic relationship between supplement and hay intake. Total intakes followed a similar quadratic pattern. It would be expected that total ME intakes would have increased across the full range of supplement intakes given the higher energy content of the oil-enriched supplements relative to the hay. Low intakes of Cop make it difficult to draw conclusions on its effect but the trend was for a linear depression in hay intake but no effect on total intake over the full range of supplement intakes. Once again energy intake would have increased with supplement intake and this is reflected in the increases in cattle growth rates. These effects are typical of the substitution effects usually observed when supplements and forages are fed together.
With the hay plus molasses basal diet (Figure 20B), hay intake was held constant at 0.75%W/d. There was no consistent or significant effect of either supplement or total intake.
The equations defining the various relationships between supplement intakes and the intake of hay or total DM intakes are shown below.
Hay basal diet:
CS: Hay DM intake (%W/d) = 1.349 + 2.161 SI - 5.71 SI2, (R2 = 0.461; RSD = 0.211; P<0.01);
Total DM intake (%W/d) = 1.337 + 3.362 SI - 6.17 SI2, (R2 = 0.499; RSD = 0.199; P<0.01);
Cop: Hay DM intake (%W/d) = 1.349 - 1.134 SI - 5.71 SI2, (R2 = 0.451; RSD = 0.149; P<0.05);
Molasses/hay basal diet:
No significant effects of supplements on intake.
Supplement DM intake (%W/d)
0.0 0.1 0.2 0.3 0.4 0.5 0.6
D M intak e (%W /d) 0.4 0.6 0.8 1.0 1.2 1.4 1.6 1.8 2.0 2.2 2.4 2.6
CS: Hay intk Cop: Hay intk CS: Total intk Cop: Total intk
A
Supplement DM intake (%W/d)
0.0 0.1 0.2 0.3 0.4 0.5 0.6 0.4 0.6 0.8 1.0 1.2 1.4 1.6 1.8 2.0 2.2 2.4 2.6
CS: Hay intk Cop: Hay intk CS: Total intk Cop: Total intk
B
Figure 20. Effect of supplement intake on the intake of hay and total DM for heifers given a basal diet of (A) low quality
pangola grass hay ad libitum or (B) pangola grass hay (0.75%W/d) + molasses/urea mix ad libitum. Symbols
represent values for individual heifers. The dashed and solid lines represent the hay and total DM intakes respectively, with treatments represented by the same colour as for the corresponding symbols.
The dry matter digestibility (DMD) of diets for heifers given a basal diet of low quality pangola grass hay averaged 55.4% and there was no effect of supplement type or intake on this measurement.
For the hay-based diets, inclusion of both supplements decreased the concentration of total volatile fatty acids (VFAs) in the rumen fluid of the heifers (P<0.05) but there was no effect with steers given the molasses and hay diets. The average concentration of VFAs was 67.0 and 72.8 mmol/L for the two diet types, respectively. For steers receiving no supplement the average molar proportion of acetate, propionate, butyrate and other VFAs in the rumen fluid were 706, 154, 117 and 2.3 mmol/mol and 608, 223, 144 and 2.4 mmol/mol for the hay only and molasses + hay diets, respectively.
decreased butyrate proportion in the VFAs for diets including molasses; there was no effect of CS. For hay-based diets the proportion of other VFAs was increased linearly with increasing intake of both supplement types, with no difference between supplements, whilst on the molasses/hay-based diets Cop increased the proportion of other VFAs (quadratically) but CS did not. The equations describing these responses for total VFA concentration and the molar proportions of the individual VFAs are shown below. No equation is shown where the effect of a particular supplement type was not significant.
Hay basal diet:
CS/Cop: Total VFA conc. (mmol/L) = 75.50 - 45.8 SI, (R2 = 0.107; RSD = 12.75; P<0.05); CS/Cop: Acetate (mmol/mol) = 725.7 - 224.8 SI, (R2 = 0.263; RSD = 36.21;
P<0.001);
CS/Cop: Propionate (mmol/mol) = 138.3 + 165.7 SI, (R2 = 0.389; RSD = 42.13; P<0.05); CS/Cop: Other VFAs (mmol/mol) = 1.951 + 3.29 SI, (R2 = 0.263; RSD = 0.947; P<0.05);
Molasses/hay basal diet:
Cop: Propionate (mmol/mol) = 234.6 - 932 SI + 3813 SI2, (R2 = 0.433; RSD = 72.1; P<0.01);
Cop: Butyrate (mmol/mol) = 150.3 + 873 SI - 3320 SI2, (R2 = 0.428; RSD = 54.6; P<0.001);
Cop: Other VFAs (mmol/mol) = 2.309 + 20.14 SI – 63.5 SI2, (R2 = 0.196; RSD = 1.58; P<0.05);
When CS was fed, there was a quadratic relationship between methane production (g/d) and supplement intake whereby the amount of methane produced initially increased and then declined as CS intake increased (Figure 23A). The data were quite variable, as indicated by the low R2 values for the regression. One heifer (Pen 35; treatment H-CS2) had a much higher methane production than its counterparts. However, the quadratic nature of the relationship did not change when the data were analysed without inclusion of this animal. The relationship, including all heifers, is described by the following equation.
Hay basal diet:
CS: Methane production (g/d) = 56.9 + 236.5 SI - 528 SI2, (R2 = 0.447; RSD = 17.32; P<0.01);
where SI is supplement intake (%W/d).
There was no significant effect of Cop on methane production but the low range of intakes of this supplement limited the scope of the analysis.
The data relating methane production to average daily gain are also shown in Figure 22 (B). In this plot, all data relating to heifers with a supplement intake less than 0.05%W/d have been excluded as these animals in general had negligible liveweight gain (sometimes negative) but reasonably high methane production resulting in extremely high and ‘unrealistic’ ratios of methane production to daily growth rate. With both supplement types methane production followed an exponential decay curve as supplement intake increased. This agrees with the ‘normal’ trend of methane production reducing per unit ADG as growth rates increase (Kurihara
et al. 1997). However, the general rule is that while methane emissions reduce per unit of
Supplement DM intake (%W/d)
0.0 0.1 0.2 0.3 0.4 0.5 0.6
Me th an e pr odu ctio n (g/d ) 40 50 60 70 80 90 100 110 120 130 H CS Cop
A
Supplement DM intake (%W/d)
0.0 0.1 0.2 0.3 0.4 0.5 0.6
Meth an e pro d u c tion /kg AD G (g ) 0 250 500 750 1000 1250 1500 CS Cop
B
Figure 22. Effect of supplements on (A) absolute methane production and (B) methane production per unit of average
daily gain (ADG) for heifers given a basal diet of low quality pangola grass hay ad libitum. Symbols represent values
for individual heifers. The solid lines represent the total data set whilst the dotted lines represent the data excluding one heifer (outlier).
Within the data, there were two outliers (not shown in Figure 22) which consistently produced considerably more methane (or grew considerably more poorly) than would have been expected from their feed intake and therefore may represent genetic variants or extremes that could have provided valuable insights into the factors that control methanogenesis in ruminants. It would have been interesting to have followed up on these heifers and consideration should be given in future studies to enable further or continued studies on “unusual” animals.
4.4.2 Rumen microbial observations
4.4.2.1 Protozoal population
The numbers of protozoa in the rumen of heifers receiving the hay-based diets averaged 0.43 x 10⁵/mL and were not affected by the inclusion of either supplement type in the diet.
4.4.2.2 Methanogen population densities
The average methanogen population densities in heifers in each treatment group are presented in Figure 23.
1.00E+08 1.00E+09 1.00E+10 Animal groups M e th an o g e n n u m b ers a verag ed p e rt rea tm e n t g ro u
p control group
H-CS2 H-CS4 H-CS6 H-Cop2 H-Cop4 H-Cop6 1.00E+08 1.00E+09 1.00E+10 1 M e th a n o g en n u m b er s a ver a g ed p e rt re at m e n t g ro u
p Molasses control group
Mol-Cop2 group Mol-Cop4 group Mol-Cop6 group Mol-CS2 Mol-CS4 Mol-CS6
Figure 23. Average population densities of methanogens in the rumen of heifers for each intended level of copra (Cop) or cottonseed (CS) supplement while they were fed a basal diet of hay (A) or hay plus molasses (B).
Initial perusal of the hay only diet appears to show a step wise reduction in the methanogen population for concentrations of CS above H-CS2. With copra meal on this diet all average populations were below the controls but methanogen density was highest at the highest level of Cop inclusion. This latter point could be erroneous given that the heifers fed this diet did not consume the supplement well and the actual oil intakes were less than expected.
The molasses fed heifers appeared quite unusual in that the average methanogen density in all groups, except the highest inclusion of copra (MH-Cop6), was higher than the control group. On the other hand the molasses control group was low in comparison to the hay only control group. While the in vitro work presented earlier would suggest that oil inclusion could be expected to reduce methanogen population numbers and within each series (inclusion level by basal diet) the average numbers appear to decrease with increasing oil content, the between animal variability (see Figure 24) would preclude any such conclusion from being made.
1.00E+08 1.00E+09 1.00E+10
Averaging over several RT reactions
M
e
th
a
nog
en de
ns
it
y
ce
ll
s
/m
L
of
r
u
m
e
n co
nt
e
n
ts