Pituitary pathology and gene expression in acromegalic cats
Christopher J. Scudder, Samantha M. Mirczuk, Karen M. Richardson, Victoria J. Crossley, Jacob T.C. Regan, Ruth Gostelow, Yaiza Forcada, Katarina Hazuchova, Norelene
Harrington, Imelda M. McGonnell, David B. Church, Patrick J. Kenny, Márta Korbonits, Robert C. Fowkes, Stijn J.M. Niessen
Journal of the Endocrine Society Endocrine Society
Submitted: July 27, 2018 Accepted: October 10, 2018 First Online: October 16, 2018
Advance Articles are PDF versions of manuscripts that have been peer reviewed and accepted but not yet copyedited. The manuscripts are published online as soon as possible after acceptance and before the copyedited, typeset articles are published. They are posted "as is" (i.e., as submitted by the authors at the modification stage), and do not reflect editorial changes. No
corrections/changes to the PDF manuscripts are accepted. Accordingly, there likely will be differences between the Advance Article manuscripts and the final, typeset articles. The
manuscripts remain listed on the Advance Article page until the final, typeset articles are posted. At that point, the manuscripts are removed from the Advance Article page.
DISCLAIMER: These manuscripts are provided "as is" without warranty of any kind, either express or particular purpose, or non-infringement. Changes will be made to these manuscripts before publication. Review and/or use or reliance on these materials is at the discretion and risk of the reader/user. In no event shall the Endocrine Society be liable for damages of any kind arising references to, products or publications do not imply endorsement of that product or publication.
ADVANCE ARTICLE:
JOURNAL OF THE ENDOCRINE SOCIETY
ADVANCE ARTICLE
Pituitary gene expression in acromegalic cats
Pituitary pathology and gene expression in acromegalic cats
Christopher J. Scudder1,2, Samantha M. Mirczuk2, Karen M. Richardson2, Victoria J. Crossley2,
Jacob T.C. Regan2, Ruth Gostelow1, Yaiza Forcada1, Katarina Hazuchova1, Norelene
Harrington4, Imelda M. McGonnell4, David B. Church1, Patrick J. Kenny1,5, Márta Korbonits6,
Robert C. Fowkes2,4‡, Stijn J.M. Niessen1,7‡
1. The Diabetic Remission Clinic, Department of Clinical Science and Services, Royal Veterinary College,
North Mymms, United Kingdom, AL9 7TA.
2.
Endocrine Signalling Group, Department of Comparative Biomedical Sciences, Royal Veterinary College, London, United Kingdom, NW1 0TU.
3. Pathobiology and Population Sciences, Royal Veterinary College, London, United Kingdom, NW1 0TU. 4. Comparative Biomedical Sciences, Royal Veterinary College, London, United Kingdom, NW1 0TU. 5.
SASH Vets, Neurology and Neurosurgery, Sydney, NSW 1670, AUS
6. Endocrinology, William Harvey Research Institute, Barts and The London School of Medicine, Queen
Mary University of London, London, United Kingdom, EC1M 6BQ.
7.
The Diabetes Research Group, Institute of Cellular Medicine, University of Newcastle, Newcastle, Tyne and Wear, United Kingdom, NE2 4HH
ORCiD numbers:
0000-0002-9896-9893
Scudder
Christopher John
0000-0002-2222-2056
Fowkes
Robert C
Received 27 July 2018. Accepted 10 October 2018.
‡
Equal contribution
The prevalence of growth hormone secreting pituitary tumours in domestic cats (Felis catus) is ten times greater than in humans. The predominant inhibitory receptors of growth hormone-secreting pituitary tumours are somatostatin receptors (SSTRs) and dopamine receptor 2 (DRD2). The expression of these receptors is associated with the response to somatostatin analogue and dopamine agonist treatment in human patients with acromegaly. The aim of this study was to describe pathological features of pituitaries from domestic cats with acromegaly, pituitary receptor expression and investigate correlates with clinical data including pituitary volume, time since diagnosis of diabetes, insulin requirement and serum IGF1 concentration. Loss of reticulin structure was identified in 15/21 pituitaries, of which 10/15 exhibited acinar hyperplasia. SSTR1, SSTR2, SSTR5 and DRD2 mRNA were identified in the feline pituitary while SSTR3 and SSTR4 were not. Expression of SSTR1, SSTR2 and SSTR5 was greater in
ADVANCE ARTICLE:
JOURNAL OF THE ENDOCRINE SOCIETY
ADVANCE ARTICLE
acromegalic cats compared to controls. A negative correlation was identified between DRD2 mRNA expression and pituitary volume. The loss of DRD2 expression should be investigated as a mechanism allowing the development of larger pituitary tumours.
3. Introduction
Acromegaly is typically caused by a functional growth hormone (GH)-secreting pituitary
adenoma in humans, and results in increased circulating insulin-like growth factor 1 (IGF1) 1.
Medical management therapies for acromegaly include GH receptor antagonists, dopamine receptor agonists (DRA) and somatostatin analogues, with the latter being the medical therapy of
choice in most cases 2,3. However, 30 to 65 % of patients with acromegaly receiving somatostatin
analogues for 12 months fail to achieve biochemical disease control 4–6. This limited response to
therapy is justification for ongoing research to develop therapies which improve outcomes in
medically managed patients 7.
Animal models can provide insight into disease pathophysiology and are used for therapeutic drug development. Transgenic rats, mice and rabbits are commonly used as induced acromegalic models by over-expression of GHRH or aryl hydrocarbon receptor-interacting protein knockout
8–11
. However, these models do not replicate GH-secreting pituitary adenomas identified in most human patients with acromegaly, and this might limit the predictability of pharmacological studies of tumorous pituitary GH-secretion inhibition when using them. Additionally, the study of a naturally occurring disease from an animal which lives in a similar environment to humans would be favourable to account for the potential environmental effects on pituitary dysfunction. Spontaneous acromegaly / hypersomatotropism (HST) in domestic cats (Felis catus) is ten
times more prevalent than in humans, affecting an estimated 1 in 800 cats 12–14. Acromegaly in
cats parallels the disease in humans in-so-far-as being diagnosed in middle aged to older subjects
and is associated with insulin resistance, acral growth and cardiovascular complications 12,15.
Cats affected by acromegaly have achieved long-term clinical and biochemical response to
pasireotide and cabergoline but no other medical therapies 16–19. The somatostatin and dopamine
receptor profile of feline GH-secreting adenomas is not known. The receptor expression profile of these tumours might explain the poor response of feline acromegalics to octreotide, which has high binding affinity for and preferentially binds to SSTR2, and L-deprenyl, a monoamine oxidase B inhibitor which prolongs the activity of dopamine, but favourable response to
pasireotide treatment 16,20,21.
The aim of the study was to investigate whether cats with naturally occurring acromegaly are a suitable model for the human disease, as well as a species of interest from a veterinary
perspective. The study aimed to describe the pituitary pathological findings, hormone, somatostatin and dopamine receptor expression of cats with and without acromegaly. Additionally, the receptor expression data were compared to clinical data.
4. Materials and Methods
The study was approved by the Royal Veterinary College (RVC) Ethics and Welfare Committee (URN 2014 1306).
Animals
Written informed consent was obtained from owners of all enrolled cats. Cats had a diagnosis of acromegaly on the basis of appropriate clinical history, serum IGF1 concentration > 1000 ng/mL (reference interval 200 – 700 ng/mL) which has a 95% positive predictive value for acromegaly
12
, and pituitary enlargement diagnosed using intra-cranial imaging (contrast enhanced computed
ADVANCE ARTICLE:
JOURNAL OF THE ENDOCRINE SOCIETY
ADVANCE ARTICLE
tomography) or post-mortem examination 12. All acromegalic cats had concurrent diabetes
mellitus which was likely to be secondary to acromegaly, and were receiving lente insulin (Caninsulin, MSD Animal Health), protamine zinc insulin (Prozinc, Boehringer Ingelheim) or glargine insulin (Lantus, Sanofi) (HST group). Non-acromegalic cats who did not have a clinical history consistent with acromegaly nor pituitary enlargement, but had undergone post-mortem examination and whose owners consented to be enrolled in the study were consecutively
recruited. All cats had previously been patients of the Queen Mother Hospital for Animals, RVC, Beaumont Animals’ Hospital, RVC or People’s Dispensary for Sick Animals in London, UK. All cats had been neutered which is common in the UK for patient health and population control.
Cat pituitary tissue
Pituitary tissue was obtained at the time of post-mortem examination or therapeutic
hypophysectomy. Tissue was fixed in RNAlaterTM (Sigma-Aldrich, Dorset, UK) or snap frozen
in liquid nitrogen and stored at - 80 oC until processed in batches. A section of pituitary tissue
was also fixed in 10% w/v neutral buffered formalin, dehydrated in decreasing concentrations of ethanol then embedded into paraffin blocks and stored at room temperature (RT). A summary of clinical characteristics of the enrolled cats is presented in Table 1.
Reticulin staining
Tissue sections were cut, deparaffinised and rehydrated as follows: 4 µm sections were cut using a manual rotary microtome (Leica RM2235, Leica Biosystems Ltd., Newcastle upon Tyne, UK)
and air dried onto microscope slides (SuperfrostTM Microscope Slides, Thermo Fisher Scientific);
deparaffinisation of the sections was performed by heating slides to 60 oC for 5 min followed by
2 x 5 min immersion in HistoClear (National Diagnostics, Atlanta, GA, USA) or xylene (Sigma-Aldrich) and rehydration of tissues in decreasing concentrations of ethanol. A commercially available reticulin staining kit (Reticulin Stain ab150684, Abcam, Cambridge, UK) was used, and the procedure performed as per manufacturer guidelines apart from use of 1 M ammonium hydroxide where the kit describes use of ‘concentrated ammonium hydroxide’ to make the ‘working ammoniacal silver solution’. A feline kidney tissue section was used as a positive control for each batch of reticulin fibre staining.
Ten control pituitary samples were used to develop a reference interval for the number of nuclei within each acinus and area of each acinus. Ten acini from each sample were randomly selected from each pituitary. This resulted in 100 acini being used for reference interval
determination. This reference interval was then tested using two other control pituitary samples. Three assessors (Dr Christopher Scudder (CJS), Ms Katarina Hazuchova [KH] Veterinary Internal Medicine Specialist and Ms Norelene Harrington [NH] Specialist in Veterinary
Pathology) were used to determine whether pituitary acinar morphology was altered in pituitaries from cats with acromegaly. Each assessor was asked the following questions: Is the acinar
structure altered?; Are the acini increased in size?; Is there loss of acinus structure?; Is the distribution focal, multi-focal or diffuse? Loss of acinus structure would be consistent with adenomatous change and an increased size of acini would be consistent with acinar hyperplasia. The upper reference limit for acinar size is described in ‘Reticulin staining’ results and the response to the above questions was used to determine a consensus between assessors.
Immunohistochemistry
All pituitary samples used for immunohistochemistry had previously undergone haematoxylin and eosin staining. Pituitary tissue embedded in paraffin blocks was cut into 4 µm sections and
air dried on positively charged slides (SuperfrostTM Plus Microscope Slides, Thermo Fisher
ADVANCE ARTICLE:
JOURNAL OF THE ENDOCRINE SOCIETY
ADVANCE ARTICLE
Scientific, Loughborough, UK). Immunohistochemistry was performed as previously described
22
by deparaffinisation and rehydration of the sections as per reticulin staining. Antigen retrieval for GH immunostaining was not necessary. Antigen retrieval for PRL and SSTR2 quantification and was required. For PRL immunostaining, slides were immersed in a pH 9.0 Tris-
Ethylenediaminetetraacetic acid (EDTA) Buffer (10mM Tris Base, 1mM EDTA Solution, 0.05% Tween 20), followed by microwave heating at 650 W for 4 min x 4. For SSTR2 immunostaining, slides were immersed in 10 mM citrate buffer pH 6 and microwave heating at 650 W for 4 min x
4. Slides were cooled to RT over 30 minutesfollowed by blocking of endogenous peroxidase by
immersion in 3 % v/v H2O2for 10 min. Non-specific protein binding was blocked by immersion
in a buffer containing PBS (Gibco, ThermoFisher Scientific, Loughborough, UK), 5 % goat serum (Sigma-Aldrich, Dorset, UK), 1 % BSA (Sigma-Aldrich, Dorset, UK), 0.1 % w/v Triton™ X-100 (Sigma-Aldrich, Dorset, UK) and 0.05 % Tween® 20 (ThermoFisher Scientific,
Loughborough, UK).
Primary antibody incubation was performed overnight in a cold room. Rabbit anti-porcine
GH and rabbit anti-porcine PRL antibodies were used 23,24. The primary antibodies were
delivered lyophilised and reconstituted using PBS to a concentration of 1 mg/mL for anti-porcine GH antibody and 300 µg/mL for anti-porcine PRL antibody as per manufacturers guidelines. Primary antibody incubation using anti-porcine GH at 1:6000 dilution, anti-porcine PRL at
1:4000 dilution and anti-SSTR2 25 at 1:1600 dilution. Secondary antibody incubation was
performed using species-specific biotinylated antibodies (Vector Laboratories, Peterborough, UK) for 30 mins at RT followed by incubation with Avidin / Biotin Complex (Vector
Laboratories, Peterborough, UK) for 30 mins at RT. Slides were then incubated with DAB chromogen (Vector Laboratories, Peterborough, UK) for 2 min, followed by counterstaining using Gill’s Haematoxylin for 40 s at RT. Between each step the slides were washed in PBS and 0.05 % Tween 20 for 5 min x 3. Tissues were dehydrated in increasing concentrations of ethanol then slides were cover slipped using Vectashield Antifade Mounting Medium (Vector
Laboratories, Peterborough, UK) and analysed. Negative control samples underwent
immunohistochemistry as described above but without addition of the primary antibody and positive control samples were sections from a healthy mouse pituitary for GH and PRL, and from a healthy human pituitary for SSTR2 immunostaining.
Representative immunostaining for GH and PRL are presented in Figure 1. The percentage DAB immunoreactivity of each tissue section was determined by obtaining high resolution photomicrographs at x100 magnification (Leica DM4000 B, Leica Microsystems Ltd, Milton Keynes, UK) and stitching images from each tissue together using photo editing software (Microsoft Image Composite Editor 2.0 for Windows, Redmond, WA, USA) to create a digital copy of the tissue. Area measurements were performed using Volocity version 6.3.0 (Perkin Elmer, Waltham, MA, USA). The area of DAB labelling was detected by thresholding of hue and saturation. Any contiguous object smaller than five pixels was considered noise and
excluded before the total area of the detected object was calculated. The total tissue area was also detected and used to calculate percentage DAB positivity of each tissue. Scoring of sections which used anti-SSTR2 antibodies as the primary antibody was also performed by three
individuals in a blinded manner using a semi quantitative scale as previously described 26.
Immunoreactivity intensity was graded 0 to 3 (0 = absent; 1 = cytoplasmic staining; 2 = membranous staining in less than 50 % cells or incomplete membranous staining; and 3 = circumferential membranous staining in >5 % cells, see Figure 2 for examples). If there was a
ADVANCE ARTICLE:
JOURNAL OF THE ENDOCRINE SOCIETY
ADVANCE ARTICLE
conflict of the pituitary score between one reviewer but two agreed then the agreed score was used, and if all three reviewers disagreed then the average score was used.
Pituitary RNA extraction, analysis and selection of reference genes
Pituitary RNA was extracted from 10 cats without pituitary disease using the phenol chloroform technique. The RNA pellet was re-suspended in RNase free water and underwent on-column DNase treatment using a commercially available kit and following manufacturer’s instructions (RNeasy Maxi Kit, Qiagen, Manchester, UK). RNA quantity and integrity was assessed using the Nanodrop™ 1000 Spectrophotometer (Thermo Fisher Scientific, Hemel Hempstead, UK) and Agilent 2100 Bioanalyzer (Agilent Biotechnologies, Craven Arms, UK).
An aliquot of 100 ng of total pituitary RNA was used to synthesise first-strand cDNA using 1
µl Oligo dTprimer (Promega, Madison, WI, USA) and ImProm-IITM Reverse Transcription
System (Promega, Madison, WI, USA) per the manufacturer’s instructions with added
magnesium chloride (Bioline 50mM MgCl2, London, UK). The cDNA was eluted using 100 µl of RNase free water and stored at -20 C until batch use. A non-reverse transcribed (nRT) sample was prepared as a control for each sample. The selection of the reference genes for GeXP
multiplex was performed using the geNorm algorithm 27 and feline geNorm 6 gene kit for use
with SYBR green (Primerdesign, Southampton, UK). An m value of < 0.5 was the cut off for selection. RPL18 and SDHA were chosen as the reference genes.
Multiplex RT-qPCR
Three custom designed GeXP multiplexes (Beckman Coulter GenomeLab Gene Expression Profiler, Wycombe, UK) were used to quantify gene expression. Multiplex 1 consisted of
primers designed for AIP, CGA, FSHβ, GHRHR, LHβ, PRL, POU1F1, TSHβ, RPL18 and SDHA,
multiplex 2 consistent of primers designs for POMC, GH1, RPL18 and SDHA and multiplex 3
consisted of primers for SSTR1, SSTR2, SSTR3, SSTR4, SSTR5, DRD2, RPL18 and SDHA28.
There were two primer sets for the measurement of PRL, labelled as PRLa and PRLb to
investigate the precision of gene amplification using the GeXP technique. The GeXP multiplex
was performed as previously described and in accordance with manufacturer’s instructions 29,30.
This procedure uses the GeXP Start-up Kit (Beckman Coulter, Wycombe, UK) to synthesise cDNA using gene specific anti-sense primers with a 3’ universal tag reverse sequence and 100
ng total pituitary RNA using a G-Storm GS1 thermal cycler and the following protocol; 48 oC, 1
min, 42 oC, 60 mins, and 95 oC, 5 mins. Following first-strand cDNA synthesis, an aliquot from
each reaction was added to a PCR master mix containing GenomeLab kit PCR master mix and DNA polymerase (Thermo-Start DNA Polymerase, Thermo Fisher Scientific Loughborough, UK). PCR reaction was performed using G-Storm GS1 thermal cycler and the following
protocol; 95 oC for 10 mins, followed by 35 cycles of 94 oC for 30 secs, 55 oC for 30 secs for
multiplex 1 and 3 and 65 oC for multiplex 2, and 70 oC for 60 secs. Products were analysed by
separation using capillary electrophoresis followed by fluorescence spectrophotometry and quantified using CEQTM 8000 Genetic Analysis System, and GenomeLab Fragment Analysis software (Beckman Coulter, Wycombe, UK). Examples of electropherograms for multiplex 1 and 3 are presented in Figure 3. Due to many samples having SDHA and POMC expression below the level of detection, RPL18 was used as the sole reference gene and the difference between groups of POMC expression was not undertaken.
Statistical analysis
Data was visually assessed for normal distribution using histograms and by performing Shapiro-Wilk tests. Normally distributed data are described as mean and standard deviation (S.D.) and
ADVANCE ARTICLE:
JOURNAL OF THE ENDOCRINE SOCIETY
ADVANCE ARTICLE
non-normally distributed data as median and interquartile range (IQR). Statistical significance was determined using an unpaired t-tests and Mann Whitney tests. Spearman’s rank or Pearson’s correlation was used to test the association between gene expression and clinical variables. Agreement of SSTR2 scores between observers was assessed using a two-way random effects single measures intra-class correlation coefficient for absolute agreement model. A chi squared test was used to test the SSTR2 scores between acromegalic and control groups. A value of P < 0.05 was considered significant and Holm-Bonferroni adjustment was used for adjustment of multiple comparisons where appropriate. Statistical software analyses were performed using GraphPad Prism version 7.02 for Windows (GraphPad Software, CA, USA) and IBM SPSS Statistics for Windows version 22 (IBM Corp., NY, USA).
5.Results
Reticulin staining
The reticulin staining in the control pituitary glands demonstrated an acinar and cords pattern
(Figure 4). This pattern is the same as described in the healthy human pituitary gland 31. The
upper reference interval for the number of nuclei per acinus in the control pituitary samples was
66, and the upper reference interval for the area of each acinus was 12650 µm2. The
two-remaining control pituitary samples were assessed using this scoring system and both were considered within normal limits. A spectrum of altered reticulin staining was identified in the HST pituitary samples including enlargement of acini, disrupted reticulin staining and loss of reticulin staining (Figure 5). Compression of the normal pituitary parenchyma adjacent to neoplastic tissue was also identified which created a ring of cords of reticulin staining in some tissue samples. Three assessors reported 7/21 pituitaries exhibited loss of acinus structure, which was described as diffuse or multifocal in all cases. Of the remaining pituitaries, two assessors (CS and KH for all 8 cases) described as loss of acinus structure in 8/14 cases, which was focal in 4/8 and multifocal or diffuse in the remaining 4/8. All three assessors described an increased in size of acini in 5/21 pituitaries. Of the remaining pituitaries, two assessors (KH and NH for all five pituitaries) described 5/16 pituitaries as having enlarged acini. There were no distinguishing clinical features of the 10 cats who were described to exhibit pituitary acinar enlargement
(acromegaly cat numbers 7, 14, 22, 24, 25, 32, 34, 35, 36 and 38).
GH and PRL expression
There was no difference of patient gender (chi squared P = 0.334) or patient age (median control vs HST was 11 vs 11 years, Mann-Whitney U test, P = 0.870) between groups but there a
difference in body weight (median control vs HST was 4.3kg vs 5.4kg, Mann-Whitney U test, P = 0.006). The difference in body weight between groups was expected and likely due to the acromegalic state.
There was significantly greater GH protein expression in the HST compared to control group (mean 50 ± 27 vs 30 ± 21 %, t(51) = 2.914, P = 0.005), Table 2. Although gene expression of GH1 was greater in cats with acromegaly than controls, this was not statistically significant (median control vs HST was 3.1 vs 6.2, Mann-Whitney U test, P = 0.071). There was no difference of PRL protein or gene expression between the HST and control group (median protein expression 1.5 % IQR 10.9 vs 4.1 % IQR 4.2, Mann-Whitney U test P = 0.122 and median relative gene expression 2.099 IQR 1.7 vs 2.196 IQR 0.73, Mann-Whitney U test P = 0.033). There was no correlation between patient age and GH or PRL expression, nor was there an association between age and any pituitary gene expression in this study.
SSTR2 expression
ADVANCE ARTICLE:
JOURNAL OF THE ENDOCRINE SOCIETY
ADVANCE ARTICLE
The was no difference of patient gender (chi squared P = 0.150), age (mean controls vs HST 10.5 ± 5.9 vs 11 ± 3, t(34) = 0.392 , P = 0.687) but there was a difference of body weight between groups (median control vs HST was 4.1 vs 5.5 kg, P = 0.004).
There was agreement between observers for tissue SSTR2 scores (intra-class correlation 0.57, 95 % confidence intervals 0.34 – 0.73, P < 0.001). Due to the low number of tissues having scores of 0 and 3, groups 0 -1 and 2 -3 were grouped together. There was no difference of
proportions of SSTR2 scores between acromegalic and control groups. The tissue percentage DAB positivity results are shown in Table 2. The percentage DAB positive tissue for SSTR2 immunoreactivity was greater in the acromegalic group than controls (0.20 % vs 0.016 %, P = 0.026). Nine samples had both SSTR2 expression data and SSTR2 immunohistochemistry data. A positive correlation between SSTR2 gene expression and percentage tissue DAB staining was
detected (r2 = 0.76, P < 0.001).
Expression of remaining anterior pituitary hormone and regulatory receptor genes
Five cats with HST had previously received pasireotide treatment. There was no difference of any gene expression data in pasireotide treated and untreated cats, therefore pasireotide treated patients were not excluded. There were no differences between gender or ages of patients
between groups for expression data of CGA, GH1, FSHβ, PRL, TSHβ, DRD2, SSTR1, SSTR2 and
SSTR5.
Expression of FSHβ, PRL and TSHβ was detected in all pituitaries (Table 2). Expression of
CGA was not detected in one control pituitary and LHβ expression was not detected in one control and four HST pituitaries. There were no significant differences of hormone expression between control and HST pituitaries. In the HST group, there were strong correlations of gene expression between the following hormones after adjustment of the P value for multiple testing: CGA and FSHβ, CGA and TSHβ, FSHβ and TSHβ and moderate correlation between PRL and TSHβ (Table 3).
The results of the expression of the SSTR1, SSTR2, SSTR5 and DRD2 for individuals with HST are in Figure 6. The expression of SSTR3 or SSTR4 was not detected. All remaining receptors were detected in 14/19 of the HST group with SSTR5 and DRD2 detected in all the HST group. There was significantly greater expression of SSTR1, SSTR2 and SSTR5 in the HST group compared to controls (0.093 vs 0.008, MannWhitney P = 0.007; 0.036 vs 0.002, t[25]= -3.34, P < 0.001; 0.151 vs 0.034, Mann Whitney P = 0.004; respectively) (Figure 3A). There was highly variable inter- and intra-patient expression of SSTR1, SSTR2 and SSTR5 mRNA in control and HST cats; there was moderate correlation between SSTR1 and SSTR5 expression in the HST group (Spearman’s rho 0.65, P = 0.005); in the control group this correlation was not statically significant (Spearman’s rho 0.71, P = 0.18). No other receptor expression was correlated with one another. There was a moderate negative correlation between DRD2 expression and pituitary volume within the HST group (Spearman’s rho -0.52, P = 0.041). There was no association between somatostatin receptor expression and IGF1 reduction due to pasireotide treatment in the cats which had received pasireotide prior to pituitary tissue collection. There was also no
association between somatostatin receptor expression and insulin dose or length of time receiving exogenous insulin therapy.
6. Discussion
Human and feline acromegaly share many clinical commonalities and the disease appears to be increasing in prevalence in both populations. This might in part be due to increased clinical awareness and improved diagnostic tests. This study describes reticulin staining patterns,
ADVANCE ARTICLE:
JOURNAL OF THE ENDOCRINE SOCIETY
ADVANCE ARTICLE
hormone and regulatory receptor expression in the normal and acromegalic feline pituitary for the first time. A description of the normal feline pituitary gland was required because of the paucity of current available information.
The percentage of GH and PRL positive cells in the normal cat pituitary was lower than
reported in adult humans (28 vs 45 % and 4 vs 15 to 25 % respectively) 32,33. As predominant cell
type of acidophils are GH-secreting cells, the distribution of acidophils within a H&E stained anterior pituitary section largely reflects the distribution of the GH-producing cells within the feline pituitary gland in health.
There was no consistent pattern of distribution of GH-producing cells in the normal feline pituitary. These cells were seen to cluster or be evenly distributed throughout the anterior pituitary. This pattern differs to the human pituitary where somatotrophs are predominantly
located within the lateral wings 33. PRL-producing cells tended to form clusters of up to 20 cells.
This pattern differs to the distribution in humans where they typically occur singularly. However, in concordance to humans there was no specific location within the gland the PRL-producing
cells were seen 32
Mixed GH- and PRL- adenomas or mammosomatotroph adenomas account for up to 30 % of
cases of acromegaly in humans 34,35. PRL positive cells accounted for less than 10 % of positive
cells in 87 % of the acromegalic pituitaries with the remaining samples containing 10.5 %, 10.5 %, 16 % and 20.5 % of PRL positive cells. Therefore, mixed GH- and PRL-adenomas /
mammosomatotroph adenomas were not a predominant feature of acromegaly in these cats. The prevalence of pituitary hyperplasia was greater than anticipated. It has been proposed that hyperplastic change can precede adenomatous transformation in human patients, and somatotroph hyperplasia has been shown to result in somatotroph adenoma formation in
GHRH-overexpressing mice 10,36,37. Somatotroph hyperplasia is considered a rare cause of acromegaly in
humans 38. The prevalence of pituitary hyperplasia might be greater than suggested by these
results if the progression from hyperplasia to adenoma occurs in cats and the hyperplasia stage is missed because many cats are not diagnosed until the onset of DM.
Cats expressed SSTR1, SSTR2 and SSTR5 while SSTR3 and SSTR4 proved undetectable using the employed methodology. Expression of DRD2 was identified in all feline pituitaries. Cats displayed a similar pituitary SSTR and DRD2 profile to humans. These data provide therapeutic targets for the management of acromegaly in cats and substantiates the comparative potential of
studying the acromegalic cat as a spontaneously occurring model of the human disease 12.
Previous reports of SSTR mRNA expression in GH-secreting pituitary adenomas in humans describe SSTR5 > SSTR2 while SSTR1 and SSTR3 expression can be highly variable and SSTR4
expression is absent 39–43. Immunohistochemical reports describe somatotroph receptor
expression as either SSTR2 > SSTR5 or SSTR5 > SSTR2 44–46. However, these conflicting
reports might have occurred due to a difference in proportion of sparsely versus densely
granulated adenomas in the studied groups. These tumour subtypes, which can be differentiated by electromicroscopy or CAM5.2 immunoreactivity pattern, have been documented to have
different somatostatin receptor expression profiles 44,47,48. Protein expression of SSTR2 in cats as
assessed by immunohistochemistry scoring was lower than reported in humans 44,48. This may be
a reason for the previously underwhelming response to octreotide in acromegalic cats because
SSTR2 expression has been positively correlated with octreotide response in humans 18,42,49.
Only one cat in the acromegalic group exhibited diffuse strong SSTR2 expression which
suggests certain individual cats might be suitable candidates to receive octreotide to manage their acromegaly. The lower SSTR2 expression identified in the cats in this study might be because
ADVANCE ARTICLE:
JOURNAL OF THE ENDOCRINE SOCIETY
ADVANCE ARTICLE
we did not differentiate between sparsely or densely granulated tumours. Finally, the detected positive correlation between SSTR2 gene expression as measured by GeXP multiplex and protein levels as measured through immunohistochemistry parallels findings from previous studies, further supporting the robustness of this methodology for within gene expression assessment
48,50
.
There are several different somatostatin receptor immunostaining scoring systems where immunoreactivity is categorised using semi-quantitative systems dependent on pathologist
description of staining 26,47,51 or percentage cells with staining 44. The current study employed a
semi-quantitative analyses which assessed subcellular location of staining, and quantification by percentage DAB positive tissue. The results of the semi-quantitative analyses revealed the inter-observer agreement was only fair. Therefore, the percentage DAB positive tissue was used to analyse SSTR2 immunoreactivity instead. This type of analysis is only as reliable as the defined colour spectrum cut off for presence or absence of staining. The programme for this analysis was designed to be highly specific for positively stained tissue. This might have lowered the
sensitivity for the identification of weakly positively stained tissue and favoured identification of the strong membranous staining which was typically more darkly stained than cytoplasmic staining. However, the latter could in fact be more appropriate since membranous staining is more heavily weighted when scored in many of the semi-quantitative scoring systems; additional reassurance was provided by the fact that immunohistochemical analysis data exhibited strong correlation with gene expression data.
The entire acromegalic group expressed DRD2 while DRD2 expression is not found so
consistently in human samples 46,52,53; PRL expression was also detected in all samples.
Therefore, the presence of DRD2 might have been due to the presence of lactotrophs. In veterinary medicine, acromegalic cats undergo therapeutic total hypophysectomy rather than adenomectomy surgery which might result in healthy pituitary tissue being adherent to the adenoma. Nevertheless, there was no correlation between PRL expression and DRD2 expression which argues against this, and would be consistent with tumorous somatotroph DRD2
expression.
There was no difference in DRD2 expression between acromegalic and control cats, although a moderate negative correlation between DRD2 expression and pituitary size was detected. Dopamine has been shown to block cell cycle progression, and activation of DRD2 by dopamine
in a gastric cancer cell model has been shown to suppress cancer cell invasion 54,55. Additionally,
the loss of DRD2 in mice resulted in large prolactinomas 56. DRD2 loss in the pituitary might
therefore also promote large somatotroph tumour formation in cats. These data also suggest that dopamine agonist therapy should be further evaluated in acromegalic cats and particularly in those with smaller pituitary tumors, because resistance to dopamine agonist therapy has been
associated with lower DRD2 expression in human GH-secreting adenomas 53.
One potential limitation to the study was that all cats with acromegaly were diabetic and receiving exogenous insulin. Previous studies in fish have shown SSTR expression to increase in a dose dependent manner when exposed to increasing concentrations of insulin and glucose in
the acute setting 57,58; whether this effect is sustained for longer than 24 hours has not yet been
reported. Our current studies found no correlations between SSTR expression and insulin dose or length of time the cat had been receiving exogenous insulin. Therefore, these findings suggest chronic hyperglycaemia or insulin therapy might not affect pituitary somatostatin receptor expression in cats.
ADVANCE ARTICLE:
JOURNAL OF THE ENDOCRINE SOCIETY
ADVANCE ARTICLE
In conclusion, the current study data reveals the heterogeneous expression of SSTRs in the pituitary gland from domestic cats without pituitary disease and those with acromegaly. Additionally, in parallel with human medicine, DRD2 expression was correlated with pituitary tumour size in acromegalic cats. This study has revealed several parallels between humans and cats with acromegaly in terms of inhibitory receptor profiles. This receptor characterisation aids our understanding of the morphology of the feline pituitary and data suggests acromegalic cats as a model of the human disease in terms of developing therapeutics for growth hormone inhibition.
Biotechnology and Biological Sciences Research Council BB/L002795, Robert C Fowkes
10. Acknowledgements
We would like thank Sophie Keyte, James Swann, Joseph Fenn, the Clinical Investigation Centre at the Royal Veterinary College and the owners of cats enrolled in this study.
9. Author contributions
Author Name Hypothesis generation and experimental design.
Organising and conducting the experiments.
Interpreting and analysing the results.
Writing and revising the manuscript.
Christopher J. Scudder x x x x Samantha M. Mirczuk x x x x Karen M. Richardson x x x Victoria J Crossley x x x Jacob T.C. Regan x x x Ruth Gostelow x x x Yaiza Forcada x x Katarina Hazuchova x
Norelene Harrington x
Imelda M. McGonnell x x David B Church x x Patrick J Kenny x x Márta Korbonits x x Robert C. Fowkes x x x x Stijn J.M Niessen x x x x
Corresponding author and person to whom reprint requests should be addressed:
Christopher Scudder, Department of Clinical Science and Services, Royal Veterinary College, North Mymms, United Kingdom, AL9 7TA. Email: cscudder@rvc.ac.uk
The authors declare no conflict of interest.
The work was supported by grants from the BBSRC Project (BB/L002795/1 to RCF, IMM and SJN) and the Evetts and Robert Luff Welfare Trust. The Royal Veterinary College’s Diabetic Remission Clinic is supported by Nestlé Purina.
11. References
1. Scacchi M, Cavagnini F. Acromegaly. Pituitary. 2006;9(4):297-303.
doi:10.1007/s11102-006-0409-4.
2. Giustina A, Chanson P, Kleinberg D, et al. Expert consensus document: A consensus on
the medical treatment of acromegaly. Nat Rev Endocrinol. 2014;10(4):243-248. doi:10.1038/nrendo.2014.21.
3. Katznelson L, Laws ER, Melmed S, et al. Acromegaly: An Endocrine Society Clinical
Practice Guideline. J Clin Endocrinol Metab. 2014;99:3933-3951. doi:10.1210/jc.2014-2700.
ADVANCE ARTICLE:
JOURNAL OF THE ENDOCRINE SOCIETY
ADVANCE ARTICLE
4. Colao A, Bronstein MD, Freda P, et al. Pasireotide Versus Octreotide in Acromegaly: A
Head-to-Head Superiority Study. J Clin Endocrinol Metab. 2014;99(3):791-799. doi:10.1210/jc.2013-2480.
5. Colao A, Auriemma RS, Lombardi G, Pivonello R. Resistance to somatostatin analogs in
acromegaly. Endocr Rev. 2011;32(2):247-271. doi:10.1210/er.2010-0002.
6. Mercado M, Borges F, Bouterfa H, et al. A prospective, multicentre study to investigate
the efficacy, safety and tolerability of octreotide LAR (long-acting repeatable octreotide) in the primary therapy of patients with acromegaly. Clin Endocrinol (Oxf). 2007;66(6):859-868. doi:10.1111/j.1365-2265.2007.02825.x.
7. Colao A, Auriemma RS, Galdiero M, Lombardi G, Pivonello R. Effects of initial therapy
for five years with somatostatin analogs for acromegaly on growth hormone and insulin-like growth factor-I levels, tumor shrinkage, and cardiovascular disease: a prospective study. J Clin Endocrinol Metab. 2009;94(10):3746-3756. doi:10.1210/jc.2009-0941.
8. Kopchick JJ, Bellush LL, Coschigano KT. Transgenic models of growth hormone action.
Annu Rev Nutr. 1999;19:437-461. doi:10.1146/annurev.nutr.19.1.437.
9. Teixeira LT, Kiyokawa H, Peng XD, Christov KT, Frohman LA, Kineman RD.
p27(Kip1)-deficient mice exhibit accelerated growth hormone-releasing hormone (GHRH)-induced somatotrope proliferation and adenoma formation. Oncogene. 2000;19(15):1875-1884. doi:10.1038/sj.onc.1203490.
10. Asa SL, Kovacs K, Stefaneanu L, et al. Pituitary adenomas in mice transgenic for growth
hormone-releasing hormone. Endocrinology. 1992;131(5):2083-2089. doi:10.1210/endo.131.5.1425411.
11. Raitila A, Lehtonen HJ, Arola J, et al. Mice with inactivation of aryl hydrocarbon
receptor-interacting protein (AIP) display complete penetrance of pituitary adenomas with aberrant ARNT expression. Am J Pathol. 2010;177(4):1969-1976.
doi:10.2353/ajpath.2010.100138.
12. Niessen SJM, Forcada Y, Mantis P, et al. Studying Cat (Felis catus) Diabetes: Beware of
the Acromegalic Imposter. PLoS One. 2015;10(5):e0127794. doi:10.1371/journal.pone.0127794.
13. Holdaway I, Rajasoorya C. Epidemiology of acromegaly. Pituitary. 1999;2(1):29-41.
14. Burton T, Le Nestour E, Neary M, Ludlam WH. Incidence and prevalence of acromegaly
in a large US health plan database. Pituitary. 2016;19(3):1-6. doi:10.1007/s11102-015-0701-2.
15. Niessen SJM, Petrie G, Gaudiano F, et al. Feline acromegaly: an underdiagnosed
endocrinopathy? J Vet Intern Med. 2007;21(5):899–905.
16. Scudder CJ, Gostelow R, Forcada Y, Schmid HA, Church D, Niessen SJM. Pasireotide
for the Medical Management of Feline Hypersomatotropism. J Vet Intern Med. 2015;29(4):1074-1080. doi:10.1111/jvim.12608.
17. Abraham L, Helmond S, Mitten RW, Charles JA, Holloway SA. Treatment of an
acromegalic cat with the dopamine agonist L-deprenyl. Aust Vet J. 2002;80(8):479-483.
18. Peterson ME, Taylor RS, Greco DS, et al. Acromegaly in 14 Cats. J Vet Intern Med.
1990;4(4):192-201. doi:10.1111/j.1939-1676.1990.tb00897.x.
19. Arias EAS, Garcia JD, Castillo VA. Pharmacological treatment with cabergoline in three
cats with acromegaly. Rev Colomb Cienc Pecu. 2017;30(4):316-321. doi:10.1016/j.physd.2012.12.010.
20. Gadelha MR, Wildemberg LE, Bronstein MD, Gatto F, Ferone D. Somatostatin receptor
ligands in the treatment of acromegaly. Pituitary. 2017;20(1):100-108. doi:10.1007/s11102-017-0791-0.
ADVANCE ARTICLE:
JOURNAL OF THE ENDOCRINE SOCIETY
ADVANCE ARTICLE
21. Lamensdorf I, Porat S, Simantov R, Finberg JPM. Effect of low-dose treatment with
selegiline on dopamine transporter (DAT) expression and amphetamine-induced dopamine release in vivo. Br J Pharmacol. 1999;126(4):997-1002. doi:10.1038/sj.bjp.0702389.
22. Lupp A, Nagel F, Doll C, et al. Reassessment of sst3 somatostatin receptor expression in
human normal and neoplastic tissues using the novel rabbit monoclonal antibody UMB-5. Neuroendocrinology. 2012;96(4):301-310. doi:10.1159/000337659.
23. A.F. Parlow National Hormone and Peptide Program, Cat# ESG_NHPP_GH_01,
RRID:AB_2737603 http://antibodyregistry.org/search.php?q=AB_2737603.
24. A.F. Parlow National Hormone and Peptide Program, Cat# ESG_NHPP_PRL_01,
RRID:AB2737602 http://antibodyregistry.org/search.php?q=AB_2737602.
25. Abcam, Cat# ab134152, RRID:AB_2737601
http://antibodyregistry.org/search.php?q=AB_2737601.
26. Iacovazzo D, Carlsen E, Lugli F, et al. Factors predicting pasireotide responsiveness in
somatotroph pituitary adenomas resistant to first-generation somatostatin analogues: an
immunohistochemical study. Eur J Endocrinol. 2016;174(2):241-250. doi:10.1530/EJE-15-0832.
27. Vandesompele J, De Preter K, Pattyn F, et al. Accurate normalization of real-time
quantitative RT-PCR data by geometric averaging of multiple internal control genes. Genome Biolology. 2002;3:0034.1–0034.11. doi:10.1186/gb-2002-3-7-research0034.
28. Scudder CJ, Mirczuk SM, Richardson KM, et al. Pituitary pathology and gene expression
in acromegalic cats. :Deposited 27 July 2018. https://doi.org/10.6084/m9.figshare.6871154.v2
29. Qin M, Wang DY, Huang F, et al. Detection of pandemic influenza A H1N1 virus by
multiplex reverse transcription-PCR with a GeXP analyzer. J Virol Methods. 2010;168(1-2):255-258. doi:10.1016/j.jviromet.2010.04.031.
30. Staines KA, Madi K, Mirczuk SM, et al. Endochondral Growth Defect and Deployment
of Transient Chondrocyte Behaviors Underlie Osteoarthritis Onset in a Natural Murine Model. Arthritis Rheumatol. 2016;68(4):880-891. doi:10.1002/art.39508.
31. Kleinschmidt-DeMasters BK. Immunohistochemistry of Pituitary Adenomas. In:
Diseases of the Pituitary. Totowa, NJ: Humana Press; 1997:377-393. doi:10.1007/978-1-4612-3954-3_19.
32. Halmi NS, Parsons JA, Erlandsen SL, Duello T. Prolactin and growth hormone cells in
the human hypophysis: a study with immunoenzyme histochemistry and differential staining. Cell Tissue Res. 1975;158(4):497-507.
33. Herman-Bonert VS, Melmed S. The Pituitary. 3rd ed. (Melmed S, ed.).
Elsevier/Academic Press; 2010.
34. Syro L V., Rotondo F, Serna CA, Ortiz LD, Kovacs K. Pathology of GH-producing
pituitary adenomas and GH cell hyperplasia of the pituitary. Pituitary. 2017;20(1):84-92. doi:10.1007/s11102-016-0748-8.
35. Melmed S. Acromegaly. N Engl J Med. 2006;355(24):2558-2573.
doi:10.1056/NEJMra062453.
36. Horvath E, Kovacs K, Scheithauer BW. Pituitary hyperplasia. Pituitary. 1999;1:169-180.
doi:10.1097/00132583-199811000-00003.
37. Villa C, Lagonigro MS, Magri F, et al. Hyperplasia-adenoma sequence in pituitary
tumorigenesis related to aryl hydrocarbon receptor interacting protein gene mutation. Endocr Relat Cancer. 2011;18(3):347-356. doi:10.1530/ERC-11-0059.
38. Sanno N, Teramoto A, Osamura RY, et al. Pathology of Pituitary Tumors. Neurosurg
Clin N Am. 2003;14(1):25-39.
ADVANCE ARTICLE:
JOURNAL OF THE ENDOCRINE SOCIETY
ADVANCE ARTICLE
39. Casarini APM, Jallad RS, Pinto EM, et al. Acromegaly: Correlation between expression
of somatostatin receptor subtypes and response to octreotide-lar treatment. Pituitary. 2009;12(4):297-303. doi:10.1007/s11102-009-0175-1.
40. Jaquet P, Saveanu A, Gunz G, et al. Human Somatostatin Receptor Subtypes in
Acromegaly: Distinct Patterns of Messenger Ribonucleic Acid Expression and Hormone Suppression Identify Different Tumoral Phenotypes 1. J Clin Endocrinol Metab.
2000;85(2):781-792. doi:10.1210/jcem.85.2.6338.
41. Corbetta S, Ballaré E, Mantovani G, et al. Somatostatin receptor subtype 2 and 5 in
human GH-secreting pituitary adenomas: analysis of gene sequence and mRNA expression. Eur J Clin Invest. 2001;31(3):208-214. doi:10.1046/j.1365-2362.2001.00786.x.
42. Taboada GF, Luque RM, Neto LV, et al. Quantitative analysis of somatostatin receptor
subtypes (1-5) gene expression levels in somatotropinomas and correlation to in vivo hormonal and tumor volume responses to treatment with octreotide LAR. Eur J Endocrinol.
2008;158(3):295-303. doi:10.1530/EJE-07-0562.
43. Neto LV, Machado EDO, Luque RM, et al. Expression analysis of dopamine receptor
subtypes in normal human pituitaries, nonfunctioning pituitary adenomas and somatotropinomas, and the association between dopamine and somatostatin receptors with clinical response to octreotide-LAR in acromegaly. J Clin Endocrinol Metab. 2009;94(6):1931-1937.
doi:10.1210/jc.2008-1826.
44. Chinezu L, Vasiljevic A, Jouanneau E, et al. Expression of somatostatin receptors,
SSTR2A and SSTR5, in 108 endocrine pituitary tumors using immunohistochemical detection with new specific monoclonal antibodies. Hum Pathol. 2014;45(1):71-77.
doi:10.1016/j.humpath.2013.08.007.
45. Pisarek H, Pawlikowski M, Kunert-Radek J, Radek M. Expression of somatostatin
receptor subtypes in human pituitary adenomas -- immunohistochemical studies. Endokrynol Pol. 2009;60(4):240-251.
46. Zatelli MC, Piccin D, Tagliati F, et al. Dopamine receptor subtype 2 and somatostatin
receptor subtype 5 expression influences somatostatin analogs effects on human somatotroph pituitary adenomas in vitro. J Mol Endocrinol. 2005;35(2):333-341. doi:10.1677/jme.1.01876.
47. Kiseljak-Vassiliades K, Xu M, Mills TS, et al. Differential somatostatin receptor (SSTR)
1–5 expression and downstream effectors in histologic subtypes of growth hormone pituitary tumors. Mol Cell Endocrinol. 2015;417:73-83. doi:10.1016/j.mce.2015.09.016.
48. Kato M, Inoshita N, Sugiyama T, et al. Differential expression of genes related to drug
responsiveness between sparsely and densely granulated somatotroph adenomas. Endocr J. 2012;59(3):221-228. doi:10.1507/endocrj.EJ11-0177.
49. Slingerland LI, Voorhout G, Rijnberk A, Kooistra HS. Growth hormone excess and the
effect of octreotide in cats with diabetes mellitus. Domest Anim Endocrinol. 2008;35(4):352-361. doi:10.1016/j.domaniend.2008.07.004.
50. Wildemberg LEA, Vieira Neto L, Costa DF, et al. Validation of immunohistochemistry
for somatostatin receptor subtype 2A in human somatotropinomas: comparison between
quantitative real time RT-PCR and immunohistochemistry. J Endocrinol Invest. 2012;35(6):580-584. doi:10.3275/7906.
51. Schulz S, Schulz S, Schmitt J, et al. Immunocytochemical detection of somatostatin
receptors sst1, sst2A, sst2B, and sst3 in paraffin-embedded breast cancer tissue using subtype-specific antibodies. Clin Cancer Res. 1998;4(9):2047-2052.
ADVANCE ARTICLE:
JOURNAL OF THE ENDOCRINE SOCIETY
ADVANCE ARTICLE
52. Ferone D, de Herder WW, Pivonello R, et al. Correlation of in Vitro and in Vivo
Somatotropic Adenoma Responsiveness to Somatostatin Analogs and Dopamine Agonists with Immunohistochemical Evaluation of Somatostatin and Dopamine Receptors and Electron Microscopy. J Clin Endocrinol Metab. 2008;93(4):1412-1417. doi:10.1210/jc.2007-1358.
53. Saveanu A, Gunz G, Guillen S, Dufour H, Culler MD, Jaquet P. Somatostatin and
dopamine-somatostatin multiple ligands directed towards somatostatin and dopamine receptors in pituitary adenomas. Neuroendocrinology. 2006;83(3-4):258-263. doi:10.1159/000095536.
54. Huang H, Wu K, Ma J, Du Y, Cao C, Nie Y. Dopamine D2 receptor suppresses gastric
cancer cell invasion and migration via inhibition of EGFR/AKT/MMP-13 pathway. Int Immunopharmacol. 2016;39:113-120. doi:10.1016/j.intimp.2016.07.002.
55. Woldman I, Reither H, Kattinger A, Hornykiewicz O, Pifl C. Dopamine inhibits cell
growth and cell cycle by blocking ribonucleotide reductase. Neuropharmacology. 2005;48(4):525-537. doi:10.1016/j.neuropharm.2004.11.013.
56. Asa SL, Kelly MA, Grandy DK, Low MJ. Pituitary lactotroph adenomas develop after
prolonged lactotroph hyperplasia in dopamine D2 receptor-deficient mice. Endocrinology. 1999;140(11):5348-5355. doi:10.1210/endo.140.11.7118.
57. Kittilson JD, Slagter BJ, Martin LE, Sheridan MA. Isolation, characterization, and
distribution of somatostatin receptor subtype 2 (SSTR 2) mRNA in rainbow trout (Oncorhynchus mykiss), and regulation of its expression by glucose. Comp Biochem Physiol A Mol Integr
Physiol. 2011;160(2):237-244. doi:10.1016/j.cbpa.2011.06.009.
58. Slagter BJ, Kittilson J, Sheridan MA. Expression of somatostatin receptor mRNAs is
regulated in vivo by growth hormone, insulin, and insulin-like growth factor-I in rainbow trout (Oncorhynchus mykiss). Regul Pept. 2005;128(1):27-32. doi:10.1016/j.regpep.2004.12.014.
Figure 1.Representative photomicrographs of growth hormone (A - C) and prolactin (D – F) immunostaining. A and D are x40 photomicrographs demonstrating specific immunostaining for somatrophs and lactotrophs, respectively. B and E are photomicrographs from a control cat C and F are from an acromegalic cat.
Figure 2.Representative images of SSTR2 immunoreactivity using feline pituitary tissue. A - D represent pituitary tissue exhibiting SSTR2 immunohistochemistry scores 0, 1, 2 and 3,
respectively using the following criteria:.0 = absent; 1 = cytoplasmic staining; 2 = membranous staining in less than 50% cells or incomplete membranous staining; and 3 = circumferential membranous staining in >50% cells. All presented photomicrographs collected at x100 magnification using Leica DM400 B, Leica Microsystems Cambridge, UK.
Figure 3.An electropherogram results from PCR products using multiplex 1 primer sets The blue peaks represent PCR products from gene specific primers and red peaks represent product size standards.
Figure 4.All images stained using Silver stain for reticulin fibres and counter stained using Nuclear Fast Red solution. A and C; reconstructed stitched pituitary x100 magnification
photomicrographs from two control pituitaries. B and D; x400 magnification photomicrographs from A and C, respectively. The acinar pattern of reticulin staining is identified in B and D. This pattern of reticulin staining was demonstrated in all reticulin staining control pituitaries.
ADVANCE ARTICLE:
JOURNAL OF THE ENDOCRINE SOCIETY
ADVANCE ARTICLE
Figure 5.All images stained using Silver stain for reticulin fibres and counter stained using Nuclear Fast Red solution. A – D; selected images taken from reconstructed stitched pituitary x100 magnification photomicrographs from four HST pituitaries. A; disrupted reticulin staining and loss of acinar structure. B; areas of enlarged acini (blue stars) and areas of loss of acinar structure (blue cross). C; enlarged acini (blue stars) adjacent to normal sized and small acini. D; loss of acinar structure in the bottom right of the image (blue stars), and adenomatous tissue has compressed the normal pituitary tissue resulting in compression of the acini and a ring of cords of acini giving the impression of a pseudocapsule.
Figure 6.A: Bar charts comparing the relative gene expression of SSTR1, SSTR2 and SSTR5 in pituitary tissue from control (CTRL) and acromegalic (Acro) cats determine using GeXP
multiplex technique. RPL18 is the reference gene. Bar height represents mean and error bars are 95% confidence intervals ** represents P < 0.01 and *** represents P < 0.001. Dot plot of the individual somatostatin profiles from each of the 19 acromegalic cats.
Table 1.Clinical data of cats in the control and acromegalic groups. All cats enrolled in this study were neutered.
Control Group
Age (yrs)
Sex 1 = male 2 = female
Body Weight
(kg)
Breed Concurrent disease Treatment
Insulin units (units / q12h) Time Diabetic (m) Pituitary DV Height (mm) Pituitary Volume (cm3) IGF1 (ng/mL) 1 11 1 3.7 Tonkinese DM insulin - lente 2 5
2 12 1 5.0 ASH DM insulin - PZI 1.5 16 173 3 14 1 4.7 DSH DM insullin - PZI 2.5 12 468 4 10 1 4.4 DSH DM insulin - lente 4.5 1
5 15 2 3.3 DSH DM insulin - glargine 1 4 222 6 13 1 5.4 DSH Cardiomyopathy
furosemide, pimobendan, clopidogrel 7 13 2 3.1 DSH Lymphoma
prednisolone, vincristine 8 15 2 3.4 DLH CKD
9 1 1 4.6 DSH CKD
aluminium hydroxide 10 6 1 4.3 Oriental IMHA prednisolone 11 2 2 4.6 Savannah Cardiomyopathy none 12 9 1 6.5
Norwegian Forest Sepsis
multiple antibiotic therapy 13 7 1 DSH Pleural effusion
14 15 1 4.7 DSH CKD
15 16 1 6.6 DSH DM 4 868 16 8 1 4.0 DSH DM newly diagnosed
17 2 2 3.5 DSH Myelodysplasia
prednisolone, chlorambucil 18 16 2 3.1 DSH
DM /
Hyperaldosteronism
insulin - glargine,
spironolactone 7 19 12 2 5.2 DSH CKD
20 1 2 4.1 DSH IMHA
prednisolone, chlorambucil 21 15 1 4.3 DLH CKD
aluminium hydroxide 22 18 1 3.9 DSH
Gastrointestinal disease - unclassified HST Group
ADVANCE ARTICLE:
JOURNAL OF THE ENDOCRINE SOCIETY
ADVANCE ARTICLE
1 11 2 6.6 DSH
DM, chronic enteropathy - unclassified
insulin - lente,
PAS-LAR 2 15 6.2 0.15 1598 2 11 1 5.7 DSH DM
insulin - glargine,
PAS-LAR 2 10 5.0 0.09 >2000 3 10 1 4.9 DSH
DM, hepatopathy -
unclassified insulin - glargine 0.5 15 10.0 0.58 1271 4 13 1 4.2 DLH DM insulin - lente 7 13 6.6 0.08 1824 5 14 1 4.1 DSH DM / HCM
insulin - lente, PAS-LAR,
aspirin 3 53 6.4 0.05 1716 6 10 1 8.0 DSH DM insulin - glargine 0.5 4 5.0 N/A 1629 7 13 1 6.5 DSH DM insulin - lente 11 45 7.1 0.13 1885 8 5 1 7.1 DSH DM insulin - glargine 18 24 5.7 0.09 >2000 9 10 1 6.0 DSH DM insulin - lente 11 9 7.0 0.14 >2000 10 6 1 5.0 DLH DM insulin - glargine 3 5 7.8 0.27 1391 11 15 1 5.0 DSH DM insulin - glargine 4 5 7.0 0.12 1536 12 14 1 5.4 DSH
DM, chronic
enteropathy insulin - glargine 1.5 0 5.8 0.06 1342 13 11 1 5.2 DSH DM insulin - glargine 0 5.5 0.09 >2000 14 6 1 7.2 DSH DM insulin - lente 0 4.5 0.07 1289 15 14 1 4.5
Maine
Coon DM insulin - PZI 19 4 6.6 0.08 1847 16 9 1 4.1 DSH DM insulin - lente 5.5 6 6.1 0.09 1322 17 14 1 3.5 DSH DM, CKD insulin - lente 7.5 2 0.0 N/A 1395 18 12 1 5.9
Maine
Coon DM insulin - lente 6 4 5.8 0.11 1672 19 10 1 5.6 DSH DM insulin - lente 14 3 9 N/A 1500 20 6 1 3.5 DSH DM insulin-glargine 1 1 5.4 0.07 1287 21 9 1 5.8 DSH DM insulin - lente 2 3 5.5 N/A >2000 22 8 1 4.3
Maine Coon DM
insulin - lente,
PAS-SAR 21 5 11.1 0.65 >2000 23 11 2 5.5 DSH
DM. chronic enteropathy
insulin - glargine,
PAS-LAR 15 19 8.5 0.40 >2000 24 8 1 4.6 DSH DM insulin - lente 18 7 11.0 0.61 >2000 25 14 1 5.4 DSH
DM, chronic
enteropathy insulin - lente 0 5 5.0 0.06 1382 26 10 1 5.4 DSH DM insulin - glargine 3.5 3 5.0 0.05 1567 27 15 1 11.3 DSH DM insulin - lente 0 21 10.0 N/A 1770 28 15 1 4.0 BSH DM insulin - lente 0 8 5.2 0.03 >2000 29 13 1 5.7 DSH DM, CKD
insulin - glargine,
PAS-LAR 3 21 5.6 0.08 >2000 30 13 2 7.7 DSH DM insulin - lente 4 5 6.3 N/A 1304 31 11 2 5.7 DSH DM insulin - glargine 9 4 7.4 0.17 919 32 7 2 8.0 DLH DM insulin - lente 7 4 6.2 0.12 1875 33 10 1 5.9 Bengal DM insulin - lente 5 3 4.8 0.08 1188 34 9 2 6.6 BSH
DM, chronic enteropathy
insulin - lente,
SAMe 5 5 7.2 0.17 1775 35 12 1 6.7 DSH DM insulin - lente 11 N/R 7.0 0.08 >2000 36 9 1 4.4 DSH DM insulin - lente 14 6 6.8 0.16 >2000 37 14 2 4.8 DSH DM
insulin - PZI,
PAS-LAR 0.5 13 6.0 N/A 1938 38 13 2 3.5 DSH
DM, hypertrophic
cardiomyopathy insulin - lente 4 4 5.2 0.06 >2000 39 11 2 3.5 BSH DM insulin - PZI 9 24 5.4 N/A 1210
ADVANCE ARTICLE:
JOURNAL OF THE ENDOCRINE SOCIETY
ADVANCE ARTICLE
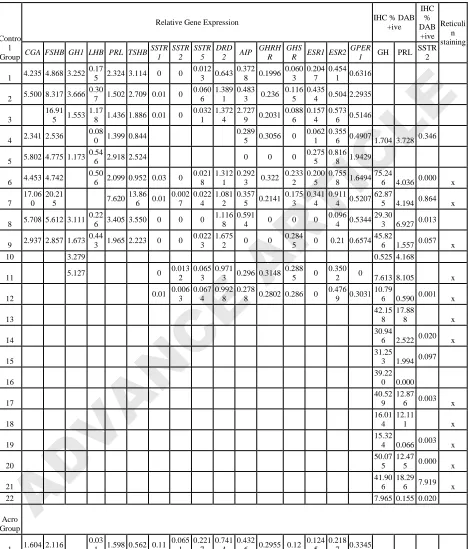
Table 2.Gene expression data and GH, PRL and SSTR2 immunohistochemistry scoring of cats in the control and acromegalic groups.
Contro l Group
Relative Gene Expression IHC % DAB +ive IHC % DAB +ive Reticuli n staining
CGA FSHB GH1 LHB PRL TSHB SSTR 1 SSTR 2 SSTR 5 DRD 2 AIP
GHRH R
GHS
R ESR1 ESR2 GPER
1 GH PRL
SSTR 2 1 4.235 4.868 3.252
0.17
5 2.324 3.114 0 0 0.012
3 0.643 0.372
8 0.1996 0.060
3 0.204
7 0.454
1 0.6316 2 5.500 8.317 3.666
0.30
7 1.502 2.709 0.01 0 0.060
6 1.389
1 0.483
3 0.236 0.116
5 0.435
4 0.504 2.2935 3
16.91 5 1.553
1.17
8 1.436 1.886 0.01 0 0.032
1 1.372
4 2.727
9 0.2031 0.088
6 0.157
4 0.573
6 0.5146 4 2.341 2.536
0.08
0 1.399 0.844
0.289
5 0.3056 0 0.062
1 0.355
6 0.4907 1.704 3.728 0.346 5 5.802 4.775 1.173
0.54
6 2.918 2.524 0 0 0 0.275
5 0.816
8 1.9429 6 4.453 4.742
0.50
6 2.099 0.952 0.03 0 0.021
8 1.312
1 0.292
3 0.322 0.233
2 0.200
5 0.755
8 1.6494 75.24
6 4.036 0.000 x 7
17.06 0
20.21
5 7.620 13.86
6 0.01 0.002 7 0.022 4 1.081 2 0.357
5 0.2141 0.175
3 0.341
4 0.911
4 0.5207 62.87
5 4.194 0.864 x 8 5.708 5.612 3.111
0.22
6 3.405 3.550 0 0 0 1.116
8 0.591
4 0 0 0 0.096
4 0.5344 29.30
3 6.927 0.013 9 2.937 2.857 1.673
0.44
3 1.965 2.223 0 0 0.022
3 1.675
2 0 0 0.284
5 0 0.21 0.6574 45.82
6 1.557 0.057 x 10 3.279 0.525 4.168
11 5.127 0 0.013
2 0.065
3 0.971
3 0.296 0.3148 0.288
5 0 0.350
2 0 7.613 8.105 x 12 0.01
0.006 3 0.067 4 0.992 8 0.278
8 0.2802 0.286 0 0.476
9 0.3031 10.79
6 0.590 0.001 x 13
42.15 8
17.88
8 x 14
30.94
6 2.522 0.020 x 15
31.25
3 1.994 0.097 16
39.22 0 0.000 17
40.52 9
12.87
6 0.003 x 18
16.01 4
12.11
1 x 19
15.32
4 0.066 0.003 x 20
50.07 5
12.47
5 0.000 x 21
41.90 6
18.29
6 7.919 x 22 7.965 0.155 0.020 Acro
Group
1 1.604 2.116
0.03
1 1.598 0.562 0.11 0.065 1 0.221 7 0.741 4 0.432
6 0.2955 0.12 0.124
5 0.218
7 0.3345 2 1.612 1.585 3.713
0.05
0 1.840 1.105 0.11 0.022 3 0.306 4 0.858 5 0.392
8 0.4603 0.175
9 0.055
9 0.464
3 0.6155 95.61
5 1.256 1.269 x 3 1.500 0.574
0.14
7 0.646 0.097 0 0 0.036
8 0.167
4 0.495
8 0.057 0.020
1 0.117
7 0.946
3 1.4239
4 2.527 2.585 1.978 2.035 0.25 0 0.229 0.947 0.391 0.2925 0.229 0.186 0.605 0.5994 94.66 0.071 0.020
ADVANCE ARTICLE:
JOURNAL OF THE ENDOCRINE SOCIETY
ADVANCE ARTICLE
5 4 9 9 7 5 2 5 6.742 7.484 6.750 1.256 1.202 0.03 0
0.075 5
1.255 8
0.652 9 0.3755
0.236 5
0.349 1
0.869 6 0.6269
88.50
5 0.000 0.008 6 4.522 5.488
0.32
5 2.588 2.432 0.01 0.039 9 0.088 8 1.654 4 0.339
7 0.2428 0.114 0 0.560
8 1.1691 7 3.088 3.159 2.927
0.19
9 2.485 0.878 0.26 0.063 1 0.310 1 1.256 8 0.291
2 0.4277 0.337
4 0 0.354 0.7307 63.75
8 1.060 2.918 x 8 6.023 6.820
0.09
6 1.865 3.042 0.03 0.017 8 0.117 2 0.583 4 0.326
9 0.2541 0.075
7 0.185
4 0.373
6 0.3201 59.96
5 0.219 9 1.805 1.300
0.03
5 2.115 2.332 0.04 0 0.236
1 0.743
1 999 999 0.227 0.010
1 0.212
6 0.5632 55.06
4 7.518 0.579 x 10 3.367 5.492 2.138 0.996 0.19
0.151 9 0.112 1 0.829 7 0.519 2 0.4121
0.289 5
0.030
1 0.474 0.6729 22.79
1 5.012 21.54
9 x 11 4.138 4.230 1.893
0.23
7 2.537 2.151 0 0.027 4 0.054 5 2.506 4 0.374
4 0.1422 0.020
6 0.042
6 0.321
7 0.3696 12.86
9 20.61
3 1.091 x 12 3.694 4.490 4.046
0.11
9 2.402 1.040 0.13 0.071 6 0.122 6 1.143 1 0.243
7 0.3611 0.086
7 0.309
5 0.668
5 0.2753 31.14
2 0.688 0.300 13 37.37 1 45.77 9 11.22 9 26.89 4 0.09
0.006 4 0.156 6 0.781 5 0.322 2 0.3158
0.200 2 0.162
0.510
8 0.8293 9.999 0.521 14 4.058 4.561
0.32
9 2.906 2.251
1.265
4 0.2225 0 0.244
8 0.808
6 1.2097 39.60
5 1.661 x 15 5.457 5.663 2.825
0.76
4 2.254 3.903 0.2 0.033 1 0.091 6 0.922 5 0.344
7 0.3162 0.109
4 8.009 0.471 16 5.550 5.751
0.25
2 3.401 2.319 0.02 0.057 6 0.157 5 1.013 4 0.319
2 0.3566 0.130
7 0.455
5 1.018
2 0.7893 17 7.507 0.01
0.020 4
0.096 5
1.199
5 0 0 0.103
5 0 0.583
1 0.5592 23.46
9 0.039 0.018 18
27.79 9
83.55
7 1.992 0.096 x 19 3.442
48.22
8 1.008 0.022 20 6.247
56.43
8 0.857 0.166 21
15.61 1
86.84
5 2.619 0.007 22 0.938
56.49
2 6.212 0.342 x 23 6.802
59.58 3 3.422 24
15.61 1
91.76
1 0.009 x 25 2.207
32.14
9 2.877 7.421 x 26
40.87 0
10.52 4 0.184 27 9.727 8.765 0.167 x 28
40.35
3 0.579 0.094 x 29
34.54
5 0.359 0.109 x 30
67.55
5 0.242 x 31
94.01
4 0.000 0.043 x 32
51.61
1 1.128 4.888 x 33
69.54 1
16.26
1 x 34
55.94
6 3.075 x 35 82.17 4.575 0.008 x
ADVANCE ARTICLE:
JOURNAL OF THE ENDOCRINE SOCIETY
ADVANCE ARTICLE
1 36
56.66
6 0.305 0.016 x 37
15.67 3
10.44 9 38
26.29
2 4.439 x 39
47.77 1 4.571
Table 3.Summary of Spearman rank correlation gene expression data in the control group and acromegalic groups
Group Gene Correlate to Gene Spearman's rho P value Adjusted P value
Control PRL vs TSHβ 0.800 0.010 0.104 CGA vs PRL 0.810 0.015 0.104 CGA vs FSHβ 0.786 0.021 0.104 CGA vs TSHβ 0.714 0.047 0.150 Acro CGA vs FSHβ 0.979 < 0.001 0.005 CGA vs TSHβ 0.937 < 0.001 0.005 FSHβ vs TSHβ 0.930 < 0.001 0.005 CGA vs PRL 0.615 0.033 0.092 FSHβ vs PRL 0.615 0.033 0.092
ADVANCE ARTICLE:
JOURNAL OF THE ENDOCRINE SOCIETY
ADVANCE ARTICLE:
Endocrinology
ADVANCE ARTICLE:
Endocrinology
ADVANCE
ARTICLE
ADVANCE ARTICLE:
JOURNAL OF THE ENDOCRINE SOCIETY
ADVANCE ARTICLE:
Endocrinology
ADVANCE ARTICLE:
Endocrinology
ADVANCE
ARTICLE
ADVANCE ARTICLE:
JOURNAL OF THE ENDOCRINE SOCIETY
ADVANCE ARTICLE:
Endocrinology
ADVANCE ARTICLE:
Endocrinology
ADVANCE
ARTICLE
ADVANCE ARTICLE:
JOURNAL OF THE ENDOCRINE SOCIETY
ADVANCE ARTICLE:
Endocrinology
ADVANCE ARTICLE:
Endocrinology
ADVANCE
ARTICLE
ADVANCE ARTICLE:
JOURNAL OF THE ENDOCRINE SOCIETY
ADVANCE ARTICLE:
Endocrinology
ADVANCE ARTICLE:
Endocrinology
ADVANCE
ARTICLE
ADVANCE ARTICLE:
JOURNAL OF THE ENDOCRINE SOCIETY
ADVANCE ARTICLE:
Endocrinology
ADVANCE ARTICLE:
Endocrinology
ADVANCE
ARTICLE
ADVANCE ARTICLE: