This is the peer reviewed version of:
Esteve-Altava B. Challenges in identifying and interpreting organizational modules in morphology. Journal of Morphology. 2017;:1–15. https://doi.org/10.1002/jmor.20690.
This article may be used for non-commercial purposes in accordance with Wiley Terms and Conditions for Self-Archiving.
The full details of the published version of the article are as follows:
TITLE: Challenges in identifying and interpreting organizational modules in morphology
AUTHORS: Borja Esteve-Altava
JOURNAL TITLE: Journal of Morphology
PUBLISHER: Wiley
PUBLICATION DATE: 2 May 2017 (online)
Challenges in Identifying and Interpreting Organizational Modules in Morphology
Borja Esteve-Altava
Structure & Motion Laboratory
Department of Comparative Biomedical Sciences Royal Veterinary College
Hatfield AL9 7TA, United Kingdom [email protected]
Abstract – Form is a rich concept that agglutinates information about the proportions and topological arrangement of body parts. Modularity is readily observable in both the variation of proportions (variational modules) and the organization of topology (organizational modules). The study of variational modularity and of organizational modularity faces similar challenges regarding the identification of meaningful modules and the validation of generative processes; however, most studies in morphology focus solely on variational modularity, while organizational modularity is much less understood. A possible cause for this bias is the successful development in the last twenty years of morphometrics, and specially geometric morphometrics, to study patters of variation. This contrasts with the lack of a similar mathematical framework to deal with patterns of organization. Recently, a new mathematical framework has been proposed to study the organization of anatomical parts using tools from Network Theory, so-called anatomical network analysis. This essay explores the potential use of this new framework – and the challenges it faces in identifying and validating biologically meaningful modules in morphological systems –, by providing an example of a complete analysis of modularity of the human skull and upper limb. Finally, we suggest further directions of research that may bridge the gap between variational and organizational modularity studies.
1. INTRODUCTION
Modularity is a widespread concept in modern science that emerged from the need to parcellate large, complex systems into smaller, hierarchically nested components (Simon, 1962). The study of modularity is commonplace in all biological disciplines because modularity affects the way complex biological systems, from genomes to ecosystems, originate, function, and evolve (Schlosser and Wagner, 2004; Callebaut and Rasskin-Gutman, 2005; Wagner et al., 2007). In morphology, the study of modularity focuses mostly on identifying regions of the body with a coordinated change of shape, by measuring traits covariation using distance-based morphometrics or landmark-based geometric morphometrics (reviewed in Esteve-Altava, 2016). The historical origin of this approach traces back to the influential book Morphological Integration by Everett Olson and Robert Miller (1958) in the context of zoological studies, and to the seminal paper on The ecological significance of correlation pleiades by Raissa Berg (1960) in botanical studies. Morphological modules identified on the basis of shape variation belong to the category of variational modules (Wagner and Altenberg, 1996; Eble, 2005; Wagner et al., 2007). Variational modularity has been the focus of many scholarly reviews in recent years (e.g., Klingenberg, 2008, 2010, 2014; Melo et al., 2016). In short, a variational module is a group of traits that vary coordinately (i.e., they are morphologically integrated sensu Olson and Miller) and, to some extent, they vary independently of other groups of traits. Up to two thirds of research studies on morphological integration and modularity analyze shape variation (Esteve-Altava, 2016), using variational module (more or less explicitly) as a synonym of morphological module. For this reason, in this essay we used variational modularity to refer to shape-variational modules as derived from morphometric analyses.
mapping, and Riedl ’s diagrammatic morphotype) and as a tool to establish homology between two body parts (see Rasskin-Gutman and Esteve-Altava, 2014 for an historical review). Because anatomical networks focus on explicit structural relations among body parts within an organism, independently of their variation, modules identified using anatomical network analysis belong to the category of organizational modules (Eble, 2005). An organizational module is a group of elements that establish more and/or stronger interactions within the group than outside it. Thus, the emphasize is placed on interactions among component parts, as an important constructional or functional property of form, whether interactions are defined based on structure (topology), pleiotropy, development, or performance (see Eble, 2005). Henceforth we used organizational modularity to refer to topology-organizational modules as derived from anatomical network analyses.
Studies on variational and organizational modules have ontological and epistemological differences, although both approaches seek to parcellate complex morphological systems into highly integrated regions (Table 1). The source of these differences are (1) that each approach uses its own definition of form, and consequently, (2) that they use different methods to analyze organismal forms. Form is a rich concept that agglutinates information about proportion (i.e., size and shape) and structure (i.e., topology and arrangement), as well as other information related to the relative orientation and functional articulation of parts (Rasskin-Gutman and Buscalioni, 2001; Rasskin-Gutman, 2003). In this context of multiple layers of morphological information, variational modules deal with form at the level of proportions, while organizational modules deal with form at the level of structure. As a consequence, each approach uses a different set of proxies and formalisms. The raw data in morphometric-based variational modules are morphometric traits, such as linear distances and landmark coordinates, and the resulting mathematical objects analyzed are correlation or covariation matrices. In contrast, the raw data in network-based organizational modules are individual body parts and their topological relations, and the resulting mathematical objects are network models.
algorithms seek to delimit modules using the topological information represented in the network model. However, identifying modules is computationally costly because of the large number of alternative partitions in which we can group the nodes of a network. Even in relatively small networks, such as the 21-node network of the human skull (described in Esteve-Altava et al., 2013) there are about 4.75 x10¹⁴ possible partitions. This is because the number of potential partitions of a network grows exponentially with the number of nodes, following the Bell’s numbers progression (Bell, 1938). There are many different algorithms to identify modules in networks, which vary in their heuristic approach. For example, some algorithms search the space of possible partitions by optimizing a quality function, while others use statistical inference on generative models, dynamic diffusion or spin processes (reviewed in Fortunato, 2010). Common validation methods include (1) the quantification of a function that measures the overall quality of the partition (which is usually the same used in optimization methods, see Eq. 1 below) according to the observed vs. expected links within and between modules (Newman and Girvan, 2004), (2) evaluating every module individually to meet a mathematical definition of module (Fortunato and Barthelemy, 2007), or (3) calculating the significance of modules using statistical tests (e.g., a Wilcoxon rank-sum test on internal vs. external number of links) or bootstrapping. Unfortunately, identifying network modules and validating network partitions are still open problems without universal agreed solutions (Fortunato and Hric, 2016).
former methods. On the other hand, under the network-based approach, testing the fit of organizational modules to a priori hypotheses of modularity rely on measuring the similarity between two alternative partitions. These methods include measures based on pair counting, cluster matching, and information theory (Fortunato, 2010; Fortunato and Hric, 2016), all of which estimate to what extent the partition identified on a topological basis resembles a previously known partition based on metadata (e.g., genetic, developmental, and/or functional modules) or another algorithm. For example, in the context of morphological organizational modules, the normalized mutual information index (NMI, Danon et al., 2005) has been used to measure the similarity between the modules identified in the networks of the human limbs and various hypotheses based on the function and developmental origin of bones and muscles (Diogo et al., 2015).
Even though variational and organizational modularity differ in their epistemological and ontological basis, both approaches face similar challenges: the identification of reliable modules, their validation, and their comparison to alternative or a priori hypotheses. These challenges have been reviewed recently in the context of variational modularity and shape analysis (e.g., Goswami et al., 2014; Klingenberg, 2014; Garcia et al., 2015; Adams, 2016; Adams and Collyer, 2016; Goswami and Finarelli, 2016; Melo et al., 2016) and we will not discuss them further. Here we focus on these challenges in the context of organizational modularity and anatomical network analysis, by presenting a working example of how to identify, validate, and compare network modules in the anatomical networks of the skull and the upper limb of humans. Then, we discuss some ideas about how to integrate variational and organizational approaches. Although, it is not well-known whether, and how, variation and organization work together in structuring and shaping the form of organisms (but see, e.g., Perez et al., 2009; Esteve-Altava et al., 2013; Suzuki, 2013), the hope is that by bridging the gap between them we will have a better understanding of morphological modularity, and possibly help to tackle challenges on both sides.
2. STUDYING ORGANIZATIONAL MODULES USING NETWORK ANALYSIS
quantifying the similarity between network partitions and alternative partitions based on biological criteria, using information theory measurements. For the most part of the analysis we have used the free software R 3.3.1 and the package igraph 1.0.1, unless otherwise stated; the source code and the network models are available as Supplementary Materials. The software to run OSLOM is available from the author’s page (www.oslom.org).
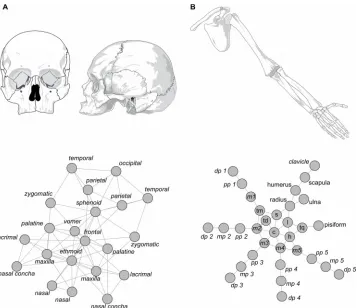
2.1. Anatomical Network Modeling
An anatomical network formalizes the way in which body parts are topological related, and, as such, it is a model of the organization of a morphological structure. Topological relations (connections) also embody developmental and functional interactions that take place between two body parts. For example, connections among skull bones are primary sites of bone growth and remodeling, while connections among limb bones are mobile articulations. Figure 1 shows the network models of the human skull (first published in Esteve-Altava et al., 2011) and of the human upper limb (first published in Diogo et al., 2015), in which nodes represent bones and links represent their physical joints (i.e., in the skull, craniofacial sutures and synchondroses; in the limb, mainly synovial joints).
A graph is a mathematical object that comprises a set of elements (vertices) and a set of pairwise-relations among elements (edges). A network is a graph with a non-trivial topology (e.g., not regular or random), although most often the terms graph and network are used as synonyms. Likewise, nodes (N) and links (K) are used as synonyms of vertices and edges, respectively. For simplicity, we modeled the networks of our examples as undirected (i.e., links have no direction) and unweighted (i.e., links are either present or absent), which is the simplest type of network. A network can be mathematically formalized as a binary adjacency matrix (Aij) of dimension N x N, in which the presence of a link between nodes i and j is coded as 1 and the absence as 0.
2.2. Definition of Module and Validation Partitions
A module (i.e., a community in network theory) is a subset of nodes more strongly connected with each other than with nodes outside the subset. To estimate how well a given partition of the network identifies the modules, Newman and Girvan (2004) defined the parameter modularity (commonly referred as Q),
Q=
∑
s=1
m
[
k
sK
−
(
d
s2
K
)
2
]
, (Equation 1)where m is the number of modules of the partition, ks is the number of links within module s, ds is the total number of links of nodes in s (both inside and outside s), and K is the total number of links in the network.
higher values indicate a stronger modularity than expected, being Q = 1 the theoretical maximum. In practice, Newman and Girvan reported that strongly modular networks show values between 0.3 and 0.7. The expected error of Q can be calculated using a jackknife procedure where each link is considered as an independent observation. It is worth noticing that the value of Q is specific of each partition and network; thus, we can use it to compare among different partitions of a same network, but not to compare two different networks. In short, one network is not more modular than another because it has a higher value of Q for its best partition.
Equation 1 also includes the condition that one group of nodes has to fulfill to be a module, that is, having relatively more connections within the module than outside, which corresponds with the definition of module:
k
sK
−
(
d
s2
K
)
2
>
0
. (Equation 2)As a consequence, it is possible to have a partition of a network in which not all groups of nodes are modules according to Eq. 2. In turn, individual modules fulfilling Eq. 2 might have, in turn, sub-modules that also fulfill Eq. 2, but where not identified by the community detection algorithm. This situation produces a resolution limit in those community algorithms that directly or indirectly seek to find the partition of the network that renders the maximum modularity (Fortunato and Barthelemy, 2007). The underlying reason of this resolution limit is precisely that most networks have a hierarchical grouping of nodes into nested sub-modules. Alternatively, we can also validate each module of a partition statistically, for example, using a Wilcoxon rank-sum test on internal (ks) vs. external (ds – ks) number of links. Here we test the null hypothesis that there is no statistical difference between the number of internal and external links against the alternative hypothesis that the number of internal links is greater than the number of external links (i.e., the definition of a module). In our example, we used the Wilcoxon rank-sum on the modules identified by the first of the community detection algorithms used.
2.3. Identifying Modules with Community Detection Algorithms
The first community detection algorithm shown is based on a hierarchical clustering of the generalized topological overlap similarity matrix among nodes (GTOM, Ravasz et al., 2002), which is a classic method that uses a heuristic approach to identify modules. Heuristic methods are designed to overcome the otherwise computationally costly task of seeking and evaluating all the possible partitions of the network, by using an a priori reasoning of which nodes we would expect to group together. The heuristic of GTOM is that nodes that connect to the same other nodes (i.e., share neighbors) have a higher chance to belong to a same module.
The topological overlap between two nodes is the number of common neighbors between two nodes, defined as
Τ Ο
i , j=
J
(
n
i, n
j)
min
k
(
k
i,k
j)
where J(ni,nj) is the number of neighbors in common between nodes i and j. TO is 1 when the two nodes share all their neighbors, that is, they connect to exactly the same other nodes. TO is 0 when the two nodes have no neighbor in common. By calculating the topological overlap over all pairs of nodes we get the GTOM, which is equivalent to a distance or dissimilarity matrix.
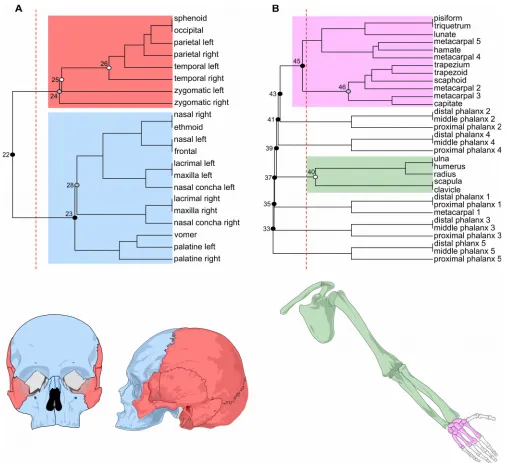
We can group nodes into clusters by using an agglomerative hierarchical cluster analysis on GTOM (in our example we used the average-linkage as in Ravasz et al., 2002; Esteve-Altava et al., 2013). The output is a hierarchical grouping of nodes, as in the two dendrograms shown in Figure 2. In order to identify the modules of the network we need then to decide at what level to cut the dendrogram. To make this decision we used (as it is customary in most hierarchical algorithms) the parameter Q explained before (Eq. 1). Thus, we measured Q for each possible partition of the dendrogram to identify the best partition, which is the one having the highest Q or Qmax (Fig. 2; perpendicular dashed line in red). We can then calculate the statistical significance of each module or, as it is the case, of any cluster of the dendrogram, to evaluate the quality of each individual module identified by cutting the dendrogram at the level of Qmax (Fig. 2; circles on the dendrogram clusters).
These examples illustrate two of the difficulties that the identification of modules in anatomical networks face: (1) the identification of weak partitions (as in the skull) and (2) of non-significant modules (as in the upper limb), which may be related to each other. The first difficulty is inherent to small size networks (e.g., tetrapod skull networks have between 20 and 60 nodes, Esteve-Altava and Rasskin-Gutman, 2014). The small size of networks hinders a correct statistical evaluation of their modules, in particular, when modules comprise only a few nodes (e.g., half of the modules of the upper limb had only three nodes); a small size also makes more difficult to discriminate between order and stochasticity in the connectivity patterns of the whole network. The second difficulty is imposed by the algorithm we choose. Many algorithms deal with the identification of rather simplistic modular organizations, letting aside (or underestimating) the presence of nested or overlapping modules, or even a partial or total lack of modularity. For example, it is possible that the anatomical networks of our examples are not truly hierarchical at this level, or that there is some degree of overlapping between their modules, or that these networks are not modular in part or in its wholeness after all.
To tackle these difficulties we used a second community detection algorithm based on the local optimization of statistically significant communities (OSLOM, Lancichinetti et al., 2011). OSLOM is specifically designed to identify significant modules locally, as well as the presence of hierarchical organization, overlapping modules (i.e., covers), partial modularity, and singletons (i.e., nodes not assigned to any module). Here, the module’s significance is taken as a fitness function that measures the probability of that module in a network without modularity (i.e., a randomization of the empirical network that keeps the same degree distribution). This probability is returned for every module identified as an estimation of the probability to find this module in the randomized network (bs). In short, the algorithm optimizes the module’s significance by iteratively adding and deleting nodes, looking for the most significant configuration available. This process is then iterated at a higher level to look for hierarchical groups. Because OSLOM evaluates the significance of modules individually, it can recover overlapping modules. Moreover, because the algorithm focuses on how individual nodes rise or lower the local significance of modules, it can also identify nodes (or groups of nodes) that do not fit within any module (i.e., singletons).
results. Thus, for each anatomical network we ran 1000 iterations, setting the coverage to 0.5 (the default value), and testing tolerances between 0.1 (default) and 0.5.
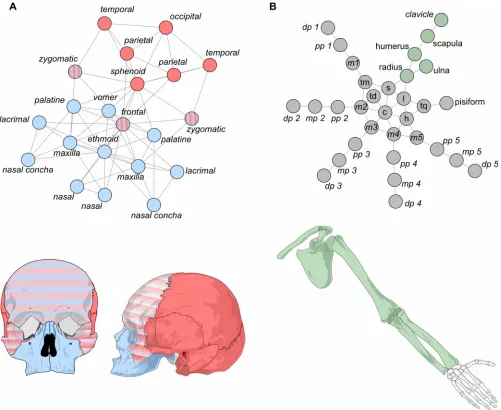
Figure 3. Modules identified with OSLOM in the human skull (A) and upper limb networks (B). For the skull, two modules were identified, one cranial (red) and one facial (blue), which overlap at the frontal and zygomatic bones (red-blue gradient pattern). For the upper limb, only one module was identified (green), while the rest of the bones do not form a module (gray).
that includes the occipital, sphenoid, parietal, and temporal bones (bs = 0.017). For larger values of tolerance (between 0.12 and 0.2), it identifies two modules that are similar to the cranial and facial modules identified by the first algorithm. In all instances, the cranial and the facial modules overlap in the frontal and zygomatic bones, which are shared between the modules. Interestingly, in most cases only one of the two zygomatic bones (left or right) participates in the overlap, which one does it specifically varies from rune to run, but since both have equally connected to both modules this difference is trivial. For this reason we consider both zygomatic bones as part of the overlap between the modules (Fig. 3A). Sporadically, for tolerance = 0.2, a broader overlap occurs which also includes the sphenoid bone (Fig. 4; blue circle). In general, the cranial module has a better estimated posterior significance that the facial module for all tolerance values, which means that a module like the cranial one is less likely to occur in a randomized network. In contrast, for the upper limb network, OSLOM returns only one module (bs = 0.153) grouping together the bones of the girdle, the stylopod (humerus), and the zeugopod (radius and ulna); while all the bones of the autopod (wrist and fingers) are not assigned to any module (i.e., they are singletons, see above). The one module identified corresponds to the statistically significant module identified using the GTOM algorithm (Fig. 2B; cluster 40, in green); the other non-significant modules identified using GTOM are not returned by OSLOM, where these bones are singletons (Fig. 3B, in gray).
2.4. Comparing between two partitions (or how to test a Ho)
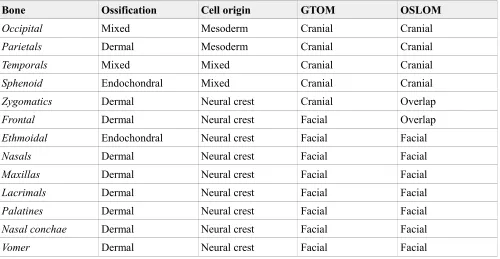
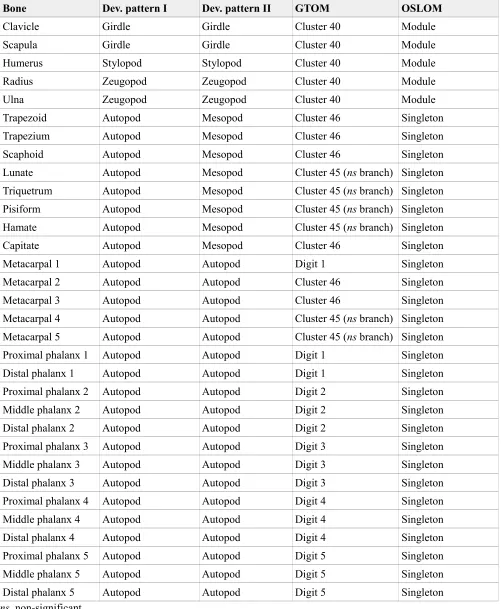
We compared the partition of the skull and upper limb networks identified with the two algorithms to alternative partitions based on different developmental criteria. For the skull (Table 2), we compared the partitions by GTOM and OSLOM to a partition of bones by their ossification mechanism (dermal, endochondral, and mixed) and to a partition of bones based on their cellular origin (mesoderm, neural crest, and mixed). For the upper limb (Table 3), we compared the partitions by GTOM and OSLOM to two partitions of the limb based on its developmental patterning, the traditional one (girdle, stylopod, zeugopod, and autopod) and a variant that also includes the mesopod region (girdle, stylopod, zeugopod, mesopod, and autopod). For simplicity, we considered all the singletons of the upper limb (i.e., bones not assigned to any module) as forming one module of their own.
We compared partitions using an index based on information theory, the normalized mutual information index (NMI, Danon et al., 2005). NMI measures the similarity of two partitions based on the additional amount of information needed to infer one partition from the other (similar partitions would need less information) and normalizes it by dividing by the arithmetic mean of the entropy of both partitions as
Inorm
(
P1,P2)
=2(
H(
P1)
−H(
P1|P2)
)
H
(
P1)
+H(
P2)
, (Equation 4)where H(P1) is the Shannon entropy of the first partition and H(P1|P2) is the conditional entropy of the first partition given the second partition. NMI is 1 when the two partitions are identical, and it is 0 when they are totally different. For convenience we express the similarity between to partitions in percentages.
The partitions of the skull based on the ossification mechanism and on the cellular origin of bones are different, 46.8% similarity, which is almost half of the similarity between the results of GTOM and OSLOM, 70.8%. This result is expected because the two latter partitions are both based on topology (GTOM vs. OSLOM), whereas the two developmental partitions are based on different criteria (ossification vs. cell origin). Partitions by GTOM and OSLOM are more similar to that based on cellular origin of bones, 52.6% and 68.3%, respectively, than to that based on ossification mechanism of bones, 24.7% and 30.8%, respectively.
In both comparisons, OSLOM outperforms GTOM in identifying a division of the human skull similar to those based on developmental criteria.
might be related with the number of modules identified by each algorithm, seven and one, respectively. The partition by GTOM is more similar to that of the developmental patterning with the mesopod, 45.1%, than without the mesopod, 33%; whereas the partition by OSLOM is more similar to that without the mesopod, 84%, than with the mesopod, 56.1%. In both cases, again, OSLOM outperforms GTOM in identifying a division of the human upper limb similar to those based on developmental patterning.
2.5. Biological Interpretation of Network-based Organizational Modules
What does it mean for a group of bones to be in a same network module? The answer to that question depends on what are the actual biological functions of the topological interactions or relations that we formalized as the network links. This is best illustrated by our example of the human skull, which consistently shows a modular partition in two modules, one grouping the bones of the cranial vault and base (cranial module) and one grouping the bones of the face (facial module). We built the network model of the human skull by formalizing craniofacial sutures and synchondroses as the links of the networks. Among the most important functions of the sutures and synchondroses of the skull is to act as primary sites of bone growth and remodeling (Opperman, 2000; Rice, 2008; Lieberman, 2011). In other words, a link represents a shared (i.e., correlated) growth of the two bones linked. Because a network module is a group of bones more densely connected among them than to other bones outside the module, bones that belong to the same module share more growth relations among them (on average) than with other bones. Thus, we would interpret the facial and cranial modules as semi-independent units of growth (Esteve-Altava et al., 2013). Alternative interpretations of network modules are possible because connections among anatomical parts rarely carry one single biological function. For example, in addition to being growth sites, we know that connections among skull bones have an also an important biomechanical role, being key actors in processes of stress diffusion and tension release (Rafferty et al., 2003; Moazen et al., 2009; Curtis et al., 2013). In this context, we would interpret the cranial and facial modules of the skull as semi-independent biomechanical units.
connections between the girdle, stylopod, and zeugopod bones is already present in Devonian tetrapodomorphs, which still lack of a well-defined autopod (Clack, 2009). Thus, we can interpret this module as a highly integrated evolutionary unit, which imposes a constraint to its evolvability. In contrast, the bones of the autopod do not group in a module, being free to vary semi-independently of the proximal module and to accommodate functional needs without disrupting more proximal structures. The fact that the autopod is an evolutionary novelty of tetrapods (albeit its developmental homologies with fin rays, e.g., see Nakamura et al., 2016) reinforces the idea of its semi-independent evolvability.
3. BRIDGING THE GAP BETWEEN VARIATIONAL AND ORGANIZATIONAL MODULARITY Are shape-variational modules causally related to topology-organizational modules? The answer to that question depends on the existence of an actual relationship between shape and topology in the generation of organismal forms. Some sort of relation exist between shape and topology due to the fact that landmarks covariation is constrained by the topological contiguity of the body parts on which landmarks are are located (Chernoff and Magwene, 1999; Magwene, 2001, 2008; Klingenberg, 2009). This was first reported in a study on the factors determining individual bone shapes covariation in the human skull by Karl Pearson and Wu Dingliang, who found that contiguity (i.e., adjacency or connection) between two bones correlates with a covariation of shape between them (Pearson and Woo, 1935). This study showed that the adjacency of bones (i.e., a connection in a network model) is the most important factor, after symmetry, in explaining the co-variation in shape of two skull bones. Unfortunately, the correlation between topology and shape has not been the subject of further experimental studies since then. As a consequence, it is unknown whether this correlation comes from a one-way causation (from topology to shape or the other way around) or from a two-way causal relationship; furthermore, it is possible that this correlation is caused by a third factor acting on both features (e.g., growth), or even, it might be an artificial correlation due to flaws in the design of the experiment.
Finally, information on shape variation might be directly included in the construction of the anatomical network model, so it is taken into account when we perform the community detection. For example, shape covariation of two bones might be used to weigh their connection; thus, we would have a weighted anatomical network where each link represent a topological connection pondered by the actual shape covariation between the two bones. Since we only use the covariation of connected nodes, the resulting mathematical object would be different of a direct network of the matrix of correlations (as in Perez et al., 2009; Suzuki, 2013).
4. CONCLUDING REMARKS
Morphological systems have a multi-level modularity, which is not limited to the underlying modularity of their generative processes and their consequences on shape, but it is also manifested at a morphological level in the structural organization of body parts. Anatomical network models and their analysis using community detection algorithms offer a new, complementary set of tools to identify morphological modules, and study how they change in development and evolution. We face the challenge now to further develop these tools in morphology, revealing the causal connections between structure and shape in the origin and evolution of organismal forms.
5. ACKNOWLEDGMENTS
I am thankful to Julio Hoyos and Rui Diogo for inviting me to present at the symposium “Major Challenges for Vertebrate Morphology, Evolution, and Development Symposium”, held at the 11th International Congress of Vertebrate Morphology (2016 Washington, DC), which inspired this essay. This project received funding from the European Union’s Horizon 2020 research and innovation programme under Marie Skłodowska-Curie grant agreement No 654155.
6. REFERENCES
Adams DC. 2016. Evaluating modularity in morphometric data: challenges with the RV coefficient and a new test measure. Methods Ecol Evol 7:565–572.
Adams DC, Collyer ML. 2016. On the comparison of the strength of morphological integration across morphometric datasets. Evolution 70:2623–2631.
Bell ET. 1938. The iterated exponential integers. Ann Math 39:539.
Berg RL. 1960. The ecological significance of correlation pleiades. Evolution 14:171–180.
Callebaut W, Rasskin-Gutman D (Eds.). 2005. Modularity: understanding the development and evolution of natural complex systems. Cambridge: The MIT Press.
Cheverud JM. 1982. Phenotypic, genetic, and environmental morphological integration in the cranium. Evolution 36:499.
Cheverud JM. 1989. A comparative analysis of morphological variation patterns in the papionins. Evolution 43:1737.
Cheverud JM. 1996. Developmental integration and the evolution of pleiotropy. Am Zool 36:44–50.
Clack JA. 2009. The fin to limb transition: new data, interpretations, and hypotheses from paleontology and developmental biology. Annu Rev Earth Planet Sci 37:163–179.
Curtis N, Jones MEH, Evans SE, O’Higgins P, Fagan MJ. 2013. Cranial sutures work collectively to distribute strain throughout the reptile skull. J R Soc Interface 10:20130442.
Danon L, Díaz-Guilera A, Duch J, Arenas A. 2005. Comparing community structure identification. J Stat Mech Theory Exp 2005:9008.
Diogo R, Esteve-Altava B, Smith C, Boughner JC, Rasskin-Gutman D. 2015. Anatomical network comparison of human upper and lower, newborn and adult, and normal and abnormal limbs, with notes on development, pathology and limb serial homology vs. homoplasy. PLOS ONE 10:e0140030.
Eble GJ. 2005. Morphological modularity and macroevolution. In: Callebaut W,, Rasskin-Gutman D, editors. Modularity: understanding the development and evolution of natural complex systems Cambridge: The MIT Press. p. 221–238.
Esteve-Altava B. 2016. In search of morphological modules: a systematic review. Biol Rev DOI: 10.1111/brv.12284.
Esteve-Altava B, Marugán-Lobón J, Botella H, Bastir M, Rasskin-Gutman D. 2013. Grist for Riedl’s mill: a network model perspective on the integration and modularity of the human skull. J Exp Zoolog B Mol Dev Evol 320:489–500.
Esteve-Altava B, Marugán-Lobón J, Botella H, Rasskin-Gutman D. 2011. Network models in anatomical systems. J Anthropol Sci 89:175–184.
Fortunato S. 2010. Community detection in graphs. Phys Rep 486:75–174.
Fortunato S, Barthelemy M. 2007. Resolution limit in community detection. Proc Natl Acad Sci 104:36–41. Fortunato S, Hric D. 2016. Community detection in networks: A user guide. Phys Rep 659:1–44.
Garcia G, de Oliveira FB, Marroig G. 2015. Modularity and Morphometrics: Error Rates in Hypothesis Testing. bioRxiv 30874.
Geoffroy Saint-Hilaire E. 1818. Philosophie anatomique. Paris: J. B. Baillière.
Goswami A. 2006. Cranial modularity shifts during mammalian evolution. Am Nat 168:270–280.
Goswami A, Polly PD. 2010. The influence of modularity on cranial morphological disparity in carnivora and primates (Mammalia). PLoS ONE 5:e9517.
Goswami A, Smaers JB, Soligo C, Polly PD. 2014. The macroevolutionary consequences of phenotypic integration: from development to deep time. Phil Trans R Soc B 369:20130254.
Guimerà R, Nunes Amaral LA. 2005. Functional cartography of complex metabolic networks. Nature 433:895– 900.
Klingenberg CP. 2008. Morphological integration and developmental modularity. Annu Rev Ecol Evol Syst 39:115–132.
Klingenberg CP. 2009. Morphometric integration and modularity in configurations of landmarks: tools for evaluating a priori hypotheses. Evol Dev 11:405–421.
Klingenberg CP. 2010. Evolution and development of shape: integrating quantitative approaches. Nat Rev Genet 11:623–635.
Klingenberg CP. 2014. Studying morphological integration and modularity at multiple levels: concepts and analysis. Phil Trans R Soc B 369:20130249.
Lancichinetti A, Radicchi F, Ramasco JJ, Fortunato S. 2011. Finding statistically significant communities in networks. PLoS ONE 6:e18961.
Lewis OJ. 1989. Functional morphology of the evolving hand and foot. Oxford: Clarendon Press. Lieberman D. 2011. The evolution of the human head. Harvard University Press.
MacMahon M, Garlaschelli D. 2015. Community detection for correlation matrices. Phys Rev X 5. Magwene PM. 2001. New tools for studying integration and modularity. Evolution 55:1734–1745.
Magwene PM. 2008. Using correlation proximity graphs to study phenotypic integration. Evol Biol 35:191–198. Melo D, Porto A, Cheverud JM, Marroig G. 2016. Modularity: genes, development, and evolution. Annu Rev
Ecol Evol Syst 47.
Moazen M, Curtis N, O’Higgins P, Jones ME., Evans SE, Fagan MJ. 2009. Assessment of the role of sutures in a lizard skull: a computer modelling study. Proc R Soc B Biol Sci 276:39–46.
Nakamura T, Gehrke AR, Lemberg J, Szymaszek J, Shubin NH. 2016. Digits and fin rays share common developmental histories. Nature 537:225–228.
Newman MEJ. 2006. Modularity and community structure in networks. Proc Natl Acad Sci 103:8577–8582. Newman MEJ, Girvan M. 2004. Finding and evaluating community structure in networks. Phys Rev E 69. Olesen JM, Bascompte J, Dupont YL, Jordano P. 2007. The modularity of pollination networks. Proc Natl Acad
Sci 104:19891–19896.
Palla G, Derényi I, Farkas I, Vicsek T. 2005. Uncovering the overlapping community structure of complex networks in nature and society. Nature 435:814–818.
Pearson K, Woo TL. 1935. Further investigation of the morphometric characters of the individual bones of the human skull. Biometrika 27:424–265.
Perez SI, de Aguiar MAM, Guimarães PR, dos Reis SF. 2009. Searching for Modular Structure in Complex Phenotypes: Inferences from Network Theory. Evol Biol 36:416–422.
Rafferty KL, Herring SW, Marshall CD. 2003. Biomechanics of the rostrum and the role of facial sutures. J Morphol 257:33–44.
Rasskin-Gutman D. 2003. Boundary constraints for the emergence of form. , 305. In: Muller GB,, Newman SA, editors. Origination of organismal form: Beyond the gene in developmental and evolutionary biology Cambridge: The MIT Press. p. 305–322.
Rasskin-Gutman D, Buscalioni AD. 2001. Theoretical morphology of the Archosaur (Reptilia: Diapsida) pelvic girdle. Paleobiology 27:59–78.
Rasskin-Gutman D, Esteve-Altava B. 2014. Connecting the dots: anatomical network analysis in morphological EvoDevo. Biol Theory 9:178–193.
Ravasz E, Somera AL, Mongru DA, Oltvai ZN, Barabási A-L. 2002. Hierarchical organization of modularity in metabolic networks. Science 297:1551–1555.
Rice D. 2008. Clinical features of syndromic craniosynostosis. In: Rice D, editor. Craniofacial sutures development, disease, and treatment Karger. p. 91–106.
Schlosser G, Wagner GP (Eds.). 2004. Modularity in development and evolution. Chicago: University of Chicago Press.
Simon HA. 1962. The architecture of complexity. Proc Am Philos Soc 106:467–482. Sporns O. 2011. Networks of the brain. Cambridge: The MIT Press.
Suzuki TK. 2013. Modularity of a leaf moth-wing pattern and a versatile characteristic of the wing-pattern ground plan. BMC Evol Biol 13:158.
Wagner GP, Altenberg L. 1996. Complex adaptations and the evolution of evolvability. Evolution 50:967–976. Wagner GP, Pavlicev M, Cheverud JM. 2007. The road to modularity. Nat Rev Genet 8:921–931.
Zelditch ML. 1988. Ontogenetic variation in patterns of phenotypic integration in the laboratory rat. Evolution 42:28–41.
TABLES
Table 1. Ontological and epistemological differences between variational and organizational modules.
Variational Modules Organizational Modules
Natural object complex morphological systems
Level of study
(what is form?) proportions (shape and size) structure (topological arrangement) Component parts morphometric traits individualized anatomical parts Relation among parts correlation or covariation topological boundaries
Mathematical object correlation matrix network model
Module definition a group of traits that co-vary a group of parts densely connected Identification
(exploration step #1) cluster analysis community detection algorithm Validation
(exploration step #1) statistical test
optimization function Q Wilcoxon rank-sum test Confirmation
(a priori hypothesis test) RV, CR, PLS similarity Comparison
(with alternative partitions) EMMLi, z-score similarity
Table 2. Divisions of the human skull compared.
Bone Ossification Cell origin GTOM OSLOM
Occipital Mixed Mesoderm Cranial Cranial
Parietals Dermal Mesoderm Cranial Cranial
Temporals Mixed Mixed Cranial Cranial
Sphenoid Endochondral Mixed Cranial Cranial
Zygomatics Dermal Neural crest Cranial Overlap
Frontal Dermal Neural crest Facial Overlap
Ethmoidal Endochondral Neural crest Facial Facial
Nasals Dermal Neural crest Facial Facial
Maxillas Dermal Neural crest Facial Facial
Lacrimals Dermal Neural crest Facial Facial
Palatines Dermal Neural crest Facial Facial
Nasal conchae Dermal Neural crest Facial Facial
Table 3. Divisions of the human upper limb compared.
Bone Dev. pattern I Dev. pattern II GTOM OSLOM
Clavicle Girdle Girdle Cluster 40 Module
Scapula Girdle Girdle Cluster 40 Module
Humerus Stylopod Stylopod Cluster 40 Module Radius Zeugopod Zeugopod Cluster 40 Module
Ulna Zeugopod Zeugopod Cluster 40 Module