Article
The Consequences of Corruption on economic growth
in Mediterranean countries: Evidence from Panel data
analysis
Hicham Boussalham 1,*
1 Faculty of Economic and Social Legal Sciences: Settat, Casablanca-Settat, Morocco
* Correspondence: [email protected]; Tel.: +212-601-515-270
Abstract: This study attempts to assess the impact of corruption on economic growth in the Mediterranean countries, during the period from 1998 to 2007. Econometric analysis using panel regression has been adopted to test this effect. Individual effects models such as random effects model and fixed effects model were applied to the study sample of 160 observations, and to choose the suitable model, we implemented several tests. For our analysis, we used a basic model that includes the dependent variable GDP per capita as a factor of economic growth and the corruption perception index as the independent variable concerned. Then we completed the model with several standardized macroeconomic control variables mentioned above and applied the individual effects models. The outcomes illustrate that corruption has a negative impact on the
selected Mediterranean countries’ economic growth.
Keywords: Corruption; Economic growth; Panel Data
JEL Classification: C23; D73; O47
1. Introduction
In recent decades, corruption is the subject of several theoretical and empirical researchers to elucidate the relationship between it and economic growth and also the implantation of effective mechanisms against this phenomenon. Several initiatives have summers taken by various international organizations like the World Bank, the International Monetary Fund, and the United Nations Development Program, to eradicate this paradox. Non-governmental agencies are established, as part of national or international strategies, to strengthen public institutions and the establishment of political regimes.
Corruption can take many forms and especially the groups of standards and customs accepted by the elites and the population (A.J. Heidenheimer et al., 1989, Y. Mény, 1992, R. Shamasastry, 2010). In this case, corruption becomes invisible and transparent. This ambiguity surrounding corruption leaves it without a precise definition. One of the accepted definitions is « the abuse of the power and the public influence for private purpose »(John Waterbury, 1973).
The opinions about the relationship between corruption and economic growth are contradictory. As Toke S. Aidt (2009) puts it, the greasers and the sanders populate the world. The sanders believe that bribery hinder economic growth, while the greasers defend the idea that corruption can grease the wheels of the industrial machine thus help faster growth.
Corruption is a phenomenon that affects the Mediterranean region. According to Transparency International, corruption is widespread in more than sixteen countries of the Mediterranean region, and the average level of corruption in the area is far from honorable. Several large-scale extortions have recently emerged on the press, especially in Nord Africa, pointing to the ubiquity of the phenomenon.
Figure 1.Corruption in the Mediterranean countries (2018)1
The resurgence of the demonstrations, condemning the corruption of the elites in the countries of North Africa and the Balkans, led us to conduct this research which attempts to determine the effect of corruption on economic growth, using a panel data of sixteen Mediterranean’s countries for a span of
10 years, from 1998 to 2007.
2. Literature review
The grease and the sand hypotheses dominate the debate on the effects of corruption on economic growth. Grease the wheels hypothesis, introduced by Nathaniel H. Leff (1964) and later adopted by other scholars (Raul A. Barreto, 2000, S.P. Huntington, 2006, Joseph Nye, 1967, Thierry Verdier and Daron Acemoglu, 2000), considers the explicit or total moralization, by intellectual and politicians, an obstacle to the rational analysis of the effects of corruption. Nathaniel H. Leff (1964)argued that in underdeveloped countries and precisely in the former colonies, the traditional elite that makes up the government may be hostile to economic development. The emergence of a new center of power, the middle class, can challenge conventional power holders. This puts into question the idea that the government in underdeveloped countries intelligently and actively works to promote economic development.
It has been argued that corruption is less detrimental in countries where bureaucracy is inefficient, and it can serve as an inducement for civil servants. A nation with an inflexible, too centralized and dishonest bureaucracy wants better than a country with a stiff, over-centralized and honest administration. In traditional societies, where traditional norms are sacred, a certain amount of
corruption can lubricate the path of modernization. In a declining community, where corruption is pervasive, more crime is not able to improve anything.
Using a sample divided into two equal subsets, which allow discrimination between developed and developing countries, Pierre-Guillaume Méon and Laurent Weill (2010) found that in a few countries in the sample where regulation is burdensome, corruption could lead to more efficiency. Today, many developing countries are compelled to cut public spending in case the problems of the balance of payment. This implies that real pay of civil servants is reduced or remains stagnant more than those in the private sector. Such a situation fuels corruption in developing countries. In this case, fraud can bring more quality and improvement among civil servants.
To explain the enormous corruption and rapid growth in China Yuanyuan Wang and Jing You (2012) found that corruption is likely to contribute to business growth. Or where the financial markets are undeveloped, corruption seems to be vital for rapid business growth. Such increase will be observed when financial markets are well functioning, and crime is under control.
Alternatively, the sanders argue that corruption hinder the economic development. Using cross-section data, Paolo Mauro (1995) found that bribery hurts economic growth and that education in developing countries is the most affected field. When the political elite is corrupted, the government invests less in tuition. Pak Hung Mo (2001) studies the effect of corruption on the use of multiple channels of transmission. Political instability is the essential channel that affects economic growth.
In a study of Ugandan companies, researchers have shown that in the short term corruption affects economic growth in a negative way. Toke S. Aidt (2009) argue that corruption can be harmful to economic growth in long-run but in the short-run bribery can be a good greaser for economic growth. In countries where crime is not organized as a network, bureaucrats fix bribes while ignoring the negative externalities of the latter. The presence of an organized corruption network makes bribe payments lower, while economic growth and innovation are very high by the case in which this system is absent.
Because of the lack of research on investigating the relationship between corruption and economic growth in Mediterranean countries, this paper will examine this matter. Even if the Mediterranean nations differ significantly between them, they share even more common points, historical and geographical(Daniel Treisman, 2000), than differences
3. Model and data
There is no consensual theoretical framework to guide empirical work on growth and corruption, and existing models do not adequately specify the variables that must be kept constant while statistical inference on the relationship between growth And variables of interest (Table 1.).
Table 1.Definition of variables and data sources
Variables Explanations of Variables Data Source
FDI FOREIGN DIRECT INVESTMENT (Griffin & Pustay, 2007) World Bank, WDI CPI Corruption Perception Index Transparency International INFL Inflation as measured by the annual growth rate of the
GDP implicit deflator World Bank, WDI
HC
Human capital is represented here by the percentage of population ages 25 and over that attained or completed
To test empirically the primary assumption of a link between corruption and economic growth a database of 16 Mediterranean countries was constructed for the period 1998-2007. The countries concerned are Albania, Algeria, Croatia, Cyprus, Egypt, France, Greece, Israel, Italy, Malta, Morocco, Slovenia, Spain, Syria, Tunisia, and Turkey.
Table 2.Descriptive statistics
GDP HC CPI INFL INV TRAD POP OPEN FDI
Mean 11407.66 37.87082 4.703500 6.179553 24.95200 54.96092 25864057 75.80851 8.37E+09
Median 10090.82 31.58014 4.650000 3.378723 25.60500 46.98524 13377132 64.46087 1.11E+09
Maximum 40341.94 94.97369 7.600000 137.9649 40.18000 148.2397 74229577 188.9775 9.31E+10
Minimum 871.8937 9.126910 2.300000 -3.131089 13.51000 18.64190 377516.0 38.36151 -4.30E+08
Std. Dev. 9881.842 20.45595 1.530114 13.18431 6.163820 23.91869 24854630 31.51757 1.73E+10
Observations 160 160 160 160 160 160 160 160 160
To see if the results of previous research are compatible with the recent data, we collected a balanced panel data, extracted from the World Bank database, composed of several variables already studied in the previous research. A Panel data is more efficient than cross-sections and time series.
The model in panel data can be expressed for N individuals and T temporal observations in the following way:
* '
'
it it i it it
y
x
, (1)where
y
itis the dependent variable,
it and'
1 2
(
,
,...,
)
it it it kit
are1×1
and1×k c
onstantsvectors which vary through i and t, respectively,
x
'
it
(
x
1it,...,
x
kit)
is a1 × k
vector ofobservations on the explanatory variables,and
it is the error term,t
1,...,
T
;
i
1,...,
N
.
Our econometric model is as follows:
0 1 2 3 4 5 6 7 8
it it it it it it it it it it
GDP FDI CPI INFL HC INV OPEN POP TRAD (2)
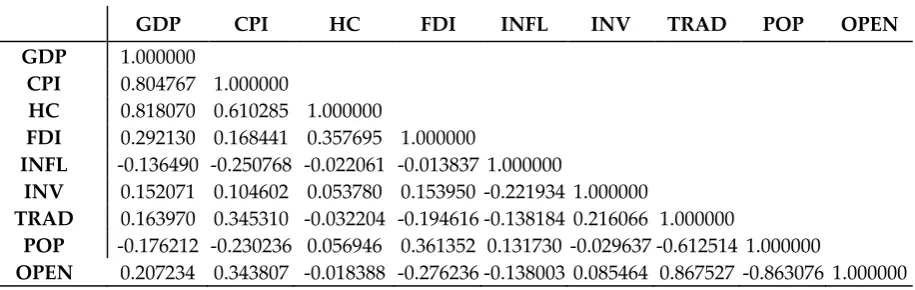
Table 3.Correlation analysis
GDP CPI HC FDI INFL INV TRAD POP OPEN
GDP 1.000000
CPI 0.804767 1.000000
HC 0.818070 0.610285 1.000000
FDI 0.292130 0.168441 0.357695 1.000000
INFL -0.136490 -0.250768 -0.022061 -0.013837 1.000000
INV 0.152071 0.104602 0.053780 0.153950 -0.221934 1.000000
TRAD 0.163970 0.345310 -0.032204 -0.194616 -0.138184 0.216066 1.000000
POP -0.176212 -0.230236 0.056946 0.361352 0.131730 -0.029637 -0.612514 1.000000
OPEN 0.207234 0.343807 -0.018388 -0.276236 -0.138003 0.085464 0.867527 -0.863076 1.000000
4. Empirical Analysis
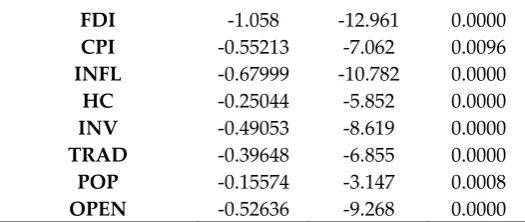
According to the sequential test procedure proposed by C. Hsiao (2014) we are faced with a model with individual effects. The stationarity test proposed by Andrew Levin et al. (2002) indicates that the series is stationary.
Table 4.UNIT ROOT TEST
FDI -1.058 -12.961 0.0000
CPI -0.55213 -7.062 0.0096
INFL -0.67999 -10.782 0.0000
HC -0.25044 -5.852 0.0000
INV -0.49053 -8.619 0.0000
TRAD -0.39648 -6.855 0.0000
POP -0.15574 -3.147 0.0008
OPEN -0.52636 -9.268 0.0000
The Breusch-Pagan test (Breusch-Pagan Lagrangian Multiplier Test) is used to determine whether the stacked MCO model is adequate by comparison to the fixed-effect model. The test hypothesis is as follows:
,
H
0:
2
0
againstH
1:
2
0
(3)The Breusch-Pagan test statistic of our model is:
,
2
2 1 1
2 1 1
(
)
1
2(
1)
N T
it
i t
N T
it
i t
NT
LM
T
= 452,858 (4)
with a value of p
p = prob(Khi-deux(1) > 452,858) = 1,7223e-100, (5)
The value of p is less than 0.05, which is in contrast to the null hypothesis according to which the stacked OLS model is adequate, in contrast to the alternative of the random effects.
Table 5.Correlated Random Effects - Hausman Test
Test Summary
Chi-Sq.
Statistic Chi-Sq. d.f. Prob.
Cross-section random 41.353139 8 0.0000
The p-value of the test is less than 5%, indicating that the random effects model is not appropriate and that the specification of the fixed effects is the most appropriate.
After this brief comparison between the three models, now we are passing to the verification of our model with fixed effects between the entities. From the results of the fixed-effect regression, we will perform a redundancy test between the entities.
Table 6.Redundant Fixed Effects Tests (Test cross-section fixed effects)
Effects Test Statistic d.f. Prob.
Cross-section F 103.509560 (15,136) 0.0000 Cross-section Chi-square 403.044141 15 0.0000
The two tests (cross-section F and cross-section Chi-square) evaluate the joint significance of the cross-section effects using the sums of squares (F-test) and the likelihood function square). The corresponding restricted specification is that in which periodic fixed effects are not permitted. The two statistical values (103,50 and 403,04) and the associated p-value strongly reject the null hypothesis that section effects are redundant. The fixed effects model is the right choice for this study.
The Schwarz criterion obtained in the periodic fixed effects model is compared with the fixed transverse effects model. The value of the periodic fixed effects model is higher than that got in the fixed effects model by sections (-0.50 <1.72).
If some omitted variables are constant over time, but vary by the state while others are constant across countries, but change over time, then it is appropriate to include both entity and time effects.
Table 7.Redundant Fixed Effects Tests (Test cross-section and period fixed effects)
Effects Test Statistic d.f. Prob.
Cross-section F 223.217097 (15,127) 0.0000 Cross-section Chi-square 529.477835 15 0.0000 Period F 20.776409 (9,127) 0.0000 Period Chi-square 144.826665 9 0.0000 Cross-Section/Period F 157.151110 (24,127) 0.0000 Cross-Section/Period Chi-square 547.870806 24 0.0000
There are three sets of tests. The first series consists of two tests that evaluate the joint significance of cross-sectional effects using sums of squares (F-test) and the likelihood function (Chi square test). The corresponding restricted specification is one in which there are period effects only. The two statistical values (223.21and 529.477) and associated p values strongly reject the null hypothesis that section effects are redundant. Two other tests are used to evaluate the importance of periodic dummies in the unrestricted model against a restricted specification in which there are only cross-sectional effects. Both forms of statistics firmly reject the null hypothesis of absence of period effects.
The last two tests evaluate respectively the ordinary meaning of all the effects. Both test statistics reject the restricted model in which there is only one intercept. The test results indicate that the cross-sectional and periodic fixed effects model is the most appropriate.
Finally, we are going to verify of the residual. It is commonly accepted that disturbances in panel data models are cross-sectioned independently, especially when the transverse dimension (N) is large. There is, however, considerable evidence that cross-sectional dependence is often present in regression parameters with panel data.
The ignorance of addiction in cross section in the estimate can have serious consequences, with unaccounted for residual dependence resulting in a loss of efficiency of the estimator and false test statistics.
The Pesaran CD test is based on the average pairwise correlation coefficients
$
1 1 12
:
(
1)
N N ij pi j i
CD
N N
T
ij
$
ijN
(0,1)
, (6)which is asymptotically normal
for
T
ij→∞
andN→∞
in any order.We will use this test because T is relatively small and the test is likely to have good properties for both N and Tij of small dimensions(B. Baltagi, 2008).
The null hypothesis is that there is no cross-sectional correlation in the residues. The value of the statistical test is -0.92 and the value of p = 0.3572 is greater than 5%. The null hypothesis that there is no cross-sectional correlation in the residues is accepted. To obtain a robust model, we will use the method of the white diagonal (C. Hsiao, 2014).
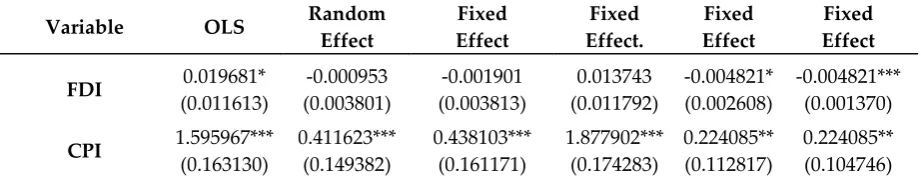
Table 8.Panel Data regressions
Variable OLS Random
Effect Fixed Effect Fixed Effect. Fixed Effect Fixed Effect FDI 0.019681*
(0.011613) -0.000953 (0.003801) -0.001901 (0.003813) 0.013743 (0.011792) -0.004821* (0.002608) -0.004821*** (0.001370)
CPI 1.595967***
INFL 0.031183 (0.046571) 0.024922 (0.017056) 0.015136 (0.017182) 0.038184 (0.045755) 0.009781 (0.011585) 0.009781 (0.017758)
HC 1.004420***
(0.089277) 1.124715 (0.072063) 0.959931*** (0.078598) 0.857944*** (0.094773) 0.298154*** (0.075654) 0.298154*** (0.082914)
INV 0.364041**
(0.156144) 0.510753*** (0.114524) 0.610492*** (0.117820) 0.281297* (0.154194) 0.437133*** (0.082259) 0.437133*** (0.098542)
TRAD -0.185445
(0.241904) 0.049682 (0.184559) -0.321823 (0.200085) -0.013128 (0.242910) -0.278451* (0.142799) -0.278451* (0.142968)
POP -0.152553***
(0.058354) 0.031026 (0.093061) 2.220511*** (0.395961) -0.257926*** (0.065018) -0.984485** (0.414502) -0.984485** (0.460631)
OPEN -0.181920
(0.403049) 0.190341 (0.245177) 0.295333 (0.251225) -0.949421** (0.453291) -0.109174 (0.197804) -0.109174 (0.238524)
C 5.299892***
(2.003204) 1.132215 (1.675509) -33.18784*** (6.289627) 10.07025*** (2.375179) 23.69137*** (7.045875) 23.69137*** (7.899874) Cross-section
fixed - - Yes No Yes Yes
Period fixed - - No Yes Yes Yes
Robust
estimators - - No No No Yes
Observations 160 160 160 160 160 160
(***), (**), and (*) denote significance at 1 percent, 5 percent, and 10 percent levels, respectively.
5. Discussion
Paolo Mauro (1995) in his treatise on Nathaniel H. Leff (1964)on the relationship between growth and investment with corruption, finds that corruption negatively affects economic growth. Paolo Mauro (1995) thinks that being corrupt, unstable governments spend less on education. This finding is consistent with the suggestion made by other researchers that opportunities for corruption may be less abundant on education than on other components of government spending. The empirical results suggest a partial explanation for the stylized fact that developing countries tend to have burdensome and corrupt bureaucracies, and to be politically unstable(Paolo Mauro, 1995). Since institutional inefficiency persists over time, corrupt institutions in the past may have played a significant role in achieving low economic growth, leading to poverty today.
From a sample of African countries during the 1990s and using a dynamic panel data estimator, Kwabena Gyimah-Brempong (2002) studied the effects of corruption on the rate of income growth by resident and income distribution. Using Transparency International's Corruption Perception Index, he finds that dishonesty decreases the rate of revenue growth. An increase of one unit of the corruption index reduces the GDP growth rate from 0.75 to 0.9 percentage points and the per capita income from 0.39 to 0.41 points percentage (a proportionately large effect given Africa's weak economic growth). Corruption decreases the per capita income growth rate directly by reducing the productivity of existing resources and indirectly by reducing investments. Kwabena Gyimah-Brempong (2002) finds that, given the level of corruption and other factors, if the level of consumption is high, per capita income growth will slow down. In addition to the slowdown in the per capita income growth rate, corruption is also associated with high-income inequality in African countries suggesting that the poor bear the brunt of the economic effects of crime in African countries.
This means that the process of economic development can be achieved using domestic resources without recourse to seeking outside help. After all, the effect of external growth aid is less than the impact of corruption on growth. Instead of African countries asking for foreign aid to boost economic development, they could achieve the desired financial performance by reducing bribery through appropriate institutional reforms. These institutional changes will lead to sustained economic growth in the long term. The results of this study should, however, be interpreted with caution.
Toke S. Aidt (2009) finds that while corruption in a narrow sense can be seen as a greaser that can speed things up and help entrepreneurs to create wealth, in a broader sense corruption should be seen as an obstacle to economic development in the future long term.
The results of the previous research indicate that corruption can be a greaser for the economy only in times of economic transition. The misleading aspect of the effectiveness of corruption is another reason. The burdensome policies that crime is supposed to help overcome can be created and maintained precisely because of their potential for fraud, and substantial real resources can be spent on challenging the associated rents. This leads to pure waste and misallocation of resources. There is also inconsistency of hiding composition. Undisputed but isolated cases of corruption, improving efficiency at the micro level cannot be considered as evidence that corruption can increase macroeconomic efficiency.
Several pieces of evidence support this point of view. Quantitative data from studies and field surveys highlight the high costs of corruption. At the macroeconomic level, although the search for an adverse effect of fraud on the average growth rate of GDP per capita has not given conclusive and consistent evidence, this does not mean that crime is irrelevant at this level. At least in a society with good governance and strong political institutions, corruption reduces growth at the margin. More importantly, even though the average effect of corruption on GDP growth is close to zero, the new evidence presented above suggests that crime is a significant obstacle to sustainable development. No doubt, I barely scratched the surface. Much more work is needed to establish the robustness and causality of the correlation between corruption, and the rate of real wealth per capita is growth and build better measures of real wealth. Nevertheless, as some research rightly points out, we should be shifting our attention from per capita GDP growth to true wealth growth and start asking questions about what economic, political and legal institutions play in promoting the accumulation of real wealth and sustainable development.
From the empirical results, a significant finding has been discovered. At a confidence interval of 95% and in our fixed-effects models, corruption negatively affects economic growth in the countries of the Mediterranean. This is the conclusion throughout the literature, as previously established, and, besides, also from the results in the data set of this document. But these results must be interpreted with caution. The index we used here is based on perception. This index does not specify whether corruption is organized or not, centralized or decentralized and whether it involves senior officials or not. This can affect the size of the losses brought by bribery. It should also be noted that the sample used for memory is too small to deduce a general trend. For these reasons, the results presented here should be considered indicative.
6. Conclusion
As part of this work, we have tried to participate in the resolution of the following fundamental question: Does corruption fat the wheels of the economic machine or does it hinder the machinery of the economic engine?
To do this, we used a cylindrical set of panel data composed of 16 countries in the Mediterranean region for the period from 1998 to 2007. The empirical results of this work, obtained through fixed-effect models, reinforce the conclusion reached by previous empirical research in this area, especially that of Paolo Mauro (1995) and Toke S. Aidt (2009), which stipulated that the influence exerted by corruption on economic growth is negative. A culture in common can explain the strong presence of corruption in the countries of the Balkan region and the Middle East and North Africa (Martin Paldam, 2002). On the other hand, education and investment have a positive effect on economic growth. In developing countries, education has a direct and positive influence on economic growth (Masakazu Hojo, 2003).
It can be concluded, though not confirmed, that this work has allowed us to partially show the existence of a relationship between corruption and economic growth and to take into account, to a certain extent, historical and geographical effects in the relationship between economic growth and corruption.
Appropriate institutional reforms, the strengthening of the rule of law and the abolition of natural laws, created by cultural values, can lead to sustained long-term economic growth and stability in most Balkan countries and the Middle East and North Africa region.
References
Aidt, Toke S. 2009. "Corruption, Institutions, and Economic Development." Oxford Review of Economic Policy, 25(2), 271-91.
Baltagi, B. 2008. Econometric Analysis of Panel Data. John Wiley & Sons.
Barreto, Raul A. 2000. "Endogenous Corruption in a Neoclassical Growth Model." European Economic Review, 44(1), 35-60.
Gyimah-Brempong, Kwabena. 2002. "Corruption, Economic Growth, and Income Inequality in Africa." Economics of Governance, 3(3), 183-209.
Heidenheimer, A.J.; M. Johnston; V.T.L. Vine and V.L. Vine. 1989. Political Corruption: A Handbook. Transaction Publishers.
Hojo, Masakazu. 2003. "An Indirect Effect of Education on Growth." Economics Letters, 80(1), 31-34. Hsiao, C. 2014. Analysis of Panel Data. Cambridge University Press.
Huntington, S.P. 2006. Political Order in Changing Societies. Yale University Press.
Kalenborn, Christine and Christian Lessmann. 2013. "The Impact of Democracy and Press Freedom on Corruption: Conditionality Matters." Journal of Policy Modeling, 35(6), 857-86.
Krugman, P.R.; M. Obstfeld and M. Melitz. 2017. International Economics: Theory and Policy. Pearson Education.
Leff, Nathaniel H. 1964. "Economic Development through Bureaucratic Corruption." American Behavioral Scientist, 8(3), 8-14.
Levin, Andrew; Chien-Fu Lin and Chia-Shang James Chu. 2002. "Unit Root Tests in Panel Data: Asymptotic and Finite-Sample Properties." Journal of Econometrics, 108(1), 1-24.
Mauro, Paolo. 1995. "Corruption and Growth." The Quarterly Journal of Economics, 110(3), 681-712. Mény, Y. 1992. La Corruption De La République. Fayard.
Méon, Pierre-Guillaume and Laurent Weill. 2010. "Is Corruption an Efficient Grease?" World Development, 38(3), 244-59.
Mo, Pak Hung. 2001. "Corruption and Economic Growth." Journal of Comparative Economics, 29(1), 66-79. Nye, Joseph. 1967. "Corruption and Political Development - a Cost-Benefit Analysis." AMERICAN POLITICAL SCIENCE REVIEW, 61(2), 417-27.
Paldam, Martin. 2002. "The Cross-Country Pattern of Corruption: Economics, Culture and the Seesaw Dynamics." European Journal of Political Economy, 18(2), 215-40.
SENIOR, IAN. 2004. "Corruption, the Government and the Private Sector: Why It Matters and What Can Be Done." Economic Affairs, 24(2), 22-29.
Treisman, Daniel. 2000. "The Causes of Corruption: A Cross-National Study." Journal of Public Economics, 76(3), 399-457.
Verdier, Thierry and Daron Acemoglu. 2000. "The Choice between Market Failures and Corruption." American Economic Review, 90(1), 194-211.
Wang, Yuanyuan and Jing You. 2012. "Corruption and Firm Growth: Evidence from China." China Economic Review, 23(2), 415-33.