1
An Infrastructure Service Recommendation System
for Cloud Applications with Real-time QoS
Requirement Constraints
Miranda Zhang, Rajiv Ranjan, Michael Menzel, Surya Nepal, Peter Strazdins,
Wei Jie, and Lizhe Wang,
Senior Member, IEEE
Abstract—The proliferation of cloud computing has revolu-tionized the hosting and delivery of Internet-based application services. However, with the constant launch of new cloud services and capabilities almost every month by both big (e.g., Amazon Web Service and Microsoft Azure) and small companies (e.g., Rackspace and Ninefold), decision makers (e.g., application de-velopers and chief information officers) are likely to be over-whelmed by choices available. The decision-making problem is further complicated due to heterogeneous service configurations and application provisioning QoS constraints. To address this hard challenge, in our previous work, we developed a semiautomated, extensible, and ontology-based approach to infrastructure service discovery and selection only based on design-time constraints (e.g., the renting cost, the data center location, the service feature, etc.). In this paper, we extend our approach to include the real-time (run-time) QoS (the to-end message latency and the end-to-end message throughput) in the decision-making process. The hosting of next-generation applications in the domain of online interactive gaming, large-scale sensor analytics, and real-time mobile applications on cloud services necessitates the optimization of such real-time QoS constraints for meeting service-level agree-ments. To this end, we present a real-time QoS-aware multicriteria decision-making technique that builds over the well-known ana-lytic hierarchy process method. The proposed technique is appli-cable to selecting Infrastructure as a Service (IaaS) cloud offers, and it allows users to define multiple design-time and real-time QoS constraints or requirements. These requirements are then matched against our knowledge base to compute the possible best fit combinations of cloud services at the IaaS layer. We conducted extensive experiments to prove the feasibility of our approach.
L. Wang was supported by the Natural Science Foundation of Hebei Province under Grant F2014203093. The work of R. Ranjan was supported by the Australia–India Strategic Research Grant titled “Innovative Solutions for Big Data and Disaster Management Applications on Clouds” under Grant AISRF-08140.(Corressponding author: Lizhe Wang.)
M. Zhang and P. Strazdins are with the Commonwealth Scientific and Industrial Research Organisation, Dickson, ACT 2602 Australia, and also with the Australian National University, Canberra, ACT 2601 Australia (e-mail: [email protected]; [email protected]).
R. Ranjan and S. Nepal are with the Commonwealth Scientific and Industrial Research Organisation, Dickson, ACT 2602 Australia (e-mail: rranjans@gmail. com; [email protected]).
M. Menzel is with the Karlsruhe Institute of Technology, 76021 Karlsruhe, Germany (e-mail: [email protected]).
W. Jie is with the School of Computing and Technology, University of West London, London W5 5RF, U.K. (e-mail: [email protected]).
L. Wang is with the School of Information Science and Engineering, Yanshan University, Hebei 066004, China (e-mail: [email protected]).
Index Terms—Decision support, optimization, service selection, web-based services.
I. INTRODUCTION
I
N a cloud computing model, users access services according to their requirements without the need to know where the services are hosted or how they are delivered. The increas-ing number of information technology vendors (e.g., Amazon, GoGrid, and Rackspace) is promising to offer applications, stor-age, and computation resources as cloud hosting services. As a result, a large number of competing services are available for users [1] to choose from. Naturally, it is challenging for users to select the right services that meet their QoS requirements in the service cycle from selection and deployment to orchestration (e.g., determining an optimal web service when making service selection, identifying suitable virtual machine (VM) servers for deploying web service instances, etc.) [2]. Effective service recommendation techniques are becoming important to help users (including developers) in their decision-making processes for critical application developments and deployments [3]. Such applications can include interactive games, real-time social networks, data analytics, scientific computing, business, the Internet of Things (IoT), and other mobile applications, as discussed in the following. All these applications have different needs and requirements.A. Motivation
We next provide a few examples to demonstrate different types of applications with the need to cater for real-time QoS requirements during their deployment lifecycle.
new game using a public cloud infrastructure as cloud services offer the flexibility to scale on demand with no upfront in-vestment. Using cloud services, game application services can be dynamically allocated or deallocated according to demand fluctuations. Game companies can also better serve diverse international users with the global presence of data centers owned by cloud providers.
Real-Time Mobile Applications: There is an explosion of (primarily mobile-based) communication applications. For ex-ample, WhatsApp, which was acquired by Facebook, has 450 million users [7]; Viber, which was acquired by Rakuten, has 200 million users [8]; and WeChat, which is a Chinese rival, has 270 million users [9]. For these applications, low latency (a QoS constraint) is very important for the real-time collabora-tion experience. For example, video conferencing has a limit of about 200–250 ms of delay for a conversation to appear natural [10]. These applications have similar requirements as game applications. They require a large number of servers to support millions of users, and they need optimization on the latency, the speed, and the throughput. It is worth noting that, even for a generic web application, there are experiments in delaying the page in increments of 100 ms, and they found that even very small delays would result in substantial and costly drops in revenue [10].
Big Data, IoT, and eScience: We are closing in on the transfer of a zettabyte of data annually [11], which results from Internet searches, social media, business transactions, and content distribution. Similarly, scientific disciplines in-creasingly produce, process, and visualize data sets gath-ered from sensors [12]. If the prediction holds true, then the Square Kilometer Array radio telescopes will transmit 400 000 PB (∼400 EB) per month or a whopping 155.7 TB/s [13]. Furthermore, the European Space Agency will launch several satellites in the next few years [14], which will col-lect data about the environment, such as air temperatures and soil conditions, and stream that data back in real time for analysis [44]–[46]. Similarly, in the finance industry, the New York Stock Exchange creates 1 TB of market and refer-ence data per day, covering the use and exchange of financial instruments. On the other hand, Twitter feeds generate 8 TB of data per day of social interactions [15]. Such “Data Explosions” have led to research issues such as how to effectively and opti-mally manage and analyze such large amount of data. This issue is also known as the big data problem [16], which is defined as the practice of collecting complex data sets so large that they become difficult to analyze and interpret manually or using on-hand data management applications (e.g., Microsoft Excel). Both storing and analyzing the data require a massive amount of storage capacity and processing power. Companies and/or institutions may want to offload the complexity of managing a hardware infrastructure to cloud providers who are specialized in that, thus eliminating the need to wait for facilities to be built.
Others:Apart from the aforementioned scenarios, there are many more cases where our proposed solution would be useful. A stock investor, an individual, or a firm may want to test out a new strategy for monitoring and analyzing data that automatically triggers an alert when a certain price pattern or keyword is identified in the source data. This may require a lot
of compute resources periodically. System administrators and developers may need a lot of simulated clients from all around the world for a website load testing before its official release.
A bitcoin [17] (or some other similar cryptocurrencies [18]) miner may decide to invest on some additional resource in mining when the price of the currency is high and stop the mining when the profit no longer justifies the expense.
B. Problem
Although the elastic nature of cloud services makes it suit-able for provisioning the aforementioned applications, the het-erogeneity of cloud service configurations and their distributed nature raises some serious technical challenges. In particular, we deal with the following research problems.
Selecting Optimal Service Configuration: The cloud com-puting landscape is evolving with multiple and diverse options for compute (also known as VMs) and storage services. Hence, application owners are facing a daunting task when trying to select cloud services that can meet their constraints. According to Burstorm [19], there are over 426 various compute and storage service providers with deployments in over 11 072 locations. Even within a particular provider there are different variations of the services. For example, Amazon Web Service (AWS) has 674 different offerings differentiated by price, QoS features, and location [1]. In addition, every quarter, they add about four new services, change business models (price and terms), and sometimes even add new locations. To be able to select the best mix of service offerings from an abundance of possibilities, application owners must simultaneously consider and optimize complex dependence and heterogeneous sets of criteria (price, features, location, QoS, etc.). For instance, it is not enough to just select an optimal cloud storage service; corresponding computing capabilities are essential to guarantee that one is able to process the data as fast as possible while minimizing the cost.
Incorporating Network QoS Awareness in Service Selection Process: As cloud data centers are distributed across the In-ternet, the network QoS (the data transfer latency) varies. This variation is dependent on the location of the data center and the location of the input data stream. Current approaches do not differentiate between the QoS of compute and storage services and the QoS of the wide-area network that interconnects the input data stream sources to the cloud data centers. This raises the research question as to how to optimize the process of choosing the best compute and storage services, which are not only optimized in terms of price, availability, and processing speed but also offer a good QoS (e.g., the network throughput and the response delivery latency).
C. Our Contributions
TABLE I
BRIEFCOMPARISON OFCLOUDRECOMMENDERWITHOTHEREXISTINGSOLUTIONS
computing [20] [21]. Although our previous approach sup-ports simple cloud infrastructure service selection based on a declarative Structured Query Language (SQL), it does not take into account real-time and variable network QoS constraints. Furthermore, a declarative-SQL-based selection approach only allows users to compare and select a cloud service based on a single criterion (e.g., the total cost, the maximum size limit for storage, and the memory size for compute instance). In other words, our previous approach was not capable of supporting a utility function that combines multiple selection criteria per-taining to storage, compute, and network services. In this paper, we make the following concrete contributions.
1) Problem Formulation: We provide a clear formulation of the research problem by identifying the most important cloud service selection criteria relevant to specific real-time QoS-driven applications, selection objectives, and cloud service alternatives.
2) Multicriteria QoS Optimization: We adopt and imple-ment an analytic hierarchy process (AHP)-based decision-making (service selection) technique that handles multiple quantitative (i.e., numeric) and qualitative (a descriptive and nonnumeric, such as location, CPU architecture, i.e., a 32- or 64-bit operating system) QoS criteria. The AHP determines the relative importance of criteria to each user by conducting pairwise comparisons.
3) Network-Aware QoS Computation: We implement a generic service that helps in collecting network QoS values from different points on the Internet (modeling a big data source location) to the cloud data centers.
This paper is structured as follows. In Section II, we survey the state of the art in cloud service selection and comparison techniques. We also highlight their significant limitations and their relationship and dependence on some of the prior concepts from other fields in computing. In Section III, we present the extension we made to our previously proposed decision-making framework. We also explain the benefits of applying the AHP and the importance of considering the QoS. In Section IV, we present evaluations (conducted in a real-world context) of the proposed decision support tool and techniques, which will automate and map users’ specified application requirements to specific cloud service configurations. In Section V, we conclude and point out open research questions and future directions in this increasingly important area.
II. BACKGROUND ANDRELATEDWORK
Although branded calculators are available from individual cloud providers, such as Amazon [22] and Azure [23], for
calculating the service leasing cost, it is not easy for users to generalize their requirements to fit different service offers (with various quota and limitations), let alone compute and compare costs. A number of research [24] and commercial projects (mostly in their early stages) provide simple cost calculation or benchmarking and status monitoring, but none is capable of consolidating all aspects and providing a comprehensive rank-ing of infrastructure services. For instance, CloudHarmony [25] provides up-to-date benchmark results without considering the cost, and Cloudorado [26] calculates the price of Infrastructure as a Service (IaaS)-level CPU services based on static features (e.g., the processor type, the processor speed, the input/output capacity, etc.) while ignoring dynamic QoS features (e.g., the latency, the throughput, etc.). Yuruware [27] used to provide a compare service during its beta version in 2012 (now re-moved or integrated into another service). Although they aim to provide an integrated tool with monitoring and deploying capabilities, they are still under development. One other similar system is Swinburne University’s Smart Cloud Broker Service [28]; from the screencast they released, we can tell that their benchmarking is done in real time, which means that users have to wait for the results to come back. We have considered this kind of situation but decided to collect the benchmarking result beforehand. This is because this way, no matter how many cloud providers users want to compare against, they can still get the result with minimum (or no) waiting time. Another reason we choose to do it this way is because, at any particular point in time, the network benchmark result is not conclusive as performance fluctuates during time; thus, we use an aggregated average, which is a more reliable overall indication.
To further distinguish ourselves from others, we offer the following two innovative features when ranking, selecting, and comparing various vendor services, i.e., allowing users to choose to include the QoS requirements during comparison and applying the AHP to aggregate numerical measurements and nonnumerical evaluation when users want to take into account mixed qualitative (e.g., the hosting region and the operating system type) and quantitative criteria. Results are personalized according to each user’s preferences because the AHP takes users’ perceived relative importance of criteria (pairwise com-parisons) as inputs.
Table I shows a brief comparison of CloudRecommender with other existing products we discussed previously. We have to clarify that we are more interested in the first three features. Yuruware had claimed to have comparison features in the past but were removed later.
server migration into the cloud. Our system supplements and partially extends their work. Although CloudGenius focuses on VM selection, which means that it considers the software re-quirements (i.e., the operating system version and the supported languages), our study focuses more on the hardware require-ments (i.e., the size of memory and hard disk). Although we have borrowed the idea of using the AHP (with simplification) for rank calculation from CloudGenius, we used it differently as we applied the method in our declarative program that mainly handles data and calculation with a database and the SQL. That means that it may be easier to scale out the solution using Hive [30] with minimal change as opposed to rewriting the java code to fit the MapReduce framework [31].
Queuing theory is one of the much studied methods in QoS modeling and control from the infrastructure system adminis-trator perspective [32], but our case is different because we have no control of the infrastructure. Since we can only measure the QoS, we collected the statistics using the “speedtest” service provided by CloudHarmony due to the easy adoption and ever-evolving nature of this service. Klein et al. [33] proposed a highly theoretical model based on the Euclidean distance for estimating the latency, which we believe have omitted too many details to be practically accurate. However, we can use this model to estimate the latency when QoS data are not available for a new client location.
There are methods proposed for network-aware service com-position [34]–[36] considering a generic web service, i.e., at the Software-as-a-Service and Platform-as-a-Service levels. How-ever, the compatibility constraints at the IaaS level are different from those at the web service. For example, generic web services are distinguished by their features, QoS, and prices. It does not make sense to include two exact same services in one composition as one job does not need to be done twice, but using multiple quantities of an IaaS offer is perfectly valid.
III. SYSTEMDESIGN
This section will describe our system’s architecture and give details on how it is realized, i.e., formulas on how the weight, the rating, and the cost are calculated. We keep all the formulas in Section III-A. In the previous section, we provide the illustra-tions of the overall system design and include any details worth discussing that does not fit into the previous sections.
A. Formal Model
To give a conceptual explanation of our approach to address the QoS optimization problem, we define a formal model in this section. Based on the formal model, we can describe the involved concepts that are incorporated in the algorithm pre-sented later. In particular, we define a cost estimation function using resource utilization estimations and a cost–benefit-ratio-based evaluation function that considers weights. Furthermore, we present a pairwise comparison method to calculate normal-ized weights. For more precise resource utilization estimations, we show how variable resource utilization patterns can be incorporated into cost estimation.
TABLE II
SYMBOLSUSED IN THEFORMULAS
1) Cost Estimation: Letabe the resource usage of a partic-ular resource from a data center location of a cloud provider. For example, we can useastorage,any,any= 50GB to represent
a user’s need to store 50 GB of data in the cloud. The symbols’ meanings are summarized in Table II. The following equation means that the usage of compute resourcerfrom providercat locationlis between 0 andn:
ar,c,l∈ {0,1, . . . , n}. (1)
This value is usually suggested by users. Our assumption is that users may have a rough estimate of how much resources they might need. To calculate the cost (represented by function℘) for one kind of resource used at one point in time, we multiply its usage with the corresponding unit price(P)as
℘(t) =ar,c,lPr,c,l. (2)
After initial filtering in which options are appropriate for users, we can calculate the total (minimum) price per unit time for the desired resource(s) (assuming a constant resource usage pattern throughout time) as follows:
ar,c,lPr,c,lTr,c,l. (3)
We assume that users will choose the time period (T) they want to estimate the price for, e.g., 1 h or 30 days.
2) Cost–Benefit Ratio: In our decision-making framework, we consider the following QoS statistics: the download latency
(ζ), the download speed(D), and the upload speed(μ). These characteristics are important for end users’ experience and satisfaction. It is possible to have options that have a small price difference or when having high quality service is more important than saving money. Hence, we offer to calculate the cost–benefit ratio for the resources requested as follows:
w1
ac,l,rPc,l,rTc,l,r+w2ζ¯c,l,r w3μ¯c,l,r+w4D¯c,l,r
Fig. 1. Criteria taken into consideration during comparison. There are two categories, i.e., the benefit and the cost. “Benefit” groups the “good” criteria that are meant to be maximized. Similarly, “Cost” groups the “bad” criteria to be minimized. The actual values to be collected and stored are at the “leaf” (i.e., a node/criterion with no children) of the “tree.” For example, under Benefit, the numeric values are collected for the “Download/Upload Speed,” the “CPU Speed,” and the “Number of Cores.” “QoS to maximize” is the parent/big category that Download/Upload Speed belongs to, and there is no value stored for this node. (a) Criteria to maximize. (b) Criteria to minimize.
Since users are likely to select a combination of compute storage and network services, the summation over resources when calculating the cost is done.
Note that the network QoS values of both compute and storage services are collected and then separately stored since a user maybe only interested in one of the services. For example, transferring files from (and to) the compute instance’s relatively “local” mounted storage is different from downloading or up-loading files from or to a dedicated-storage-only service (like AWS S3 [37]). In case a user selects both, we use the average. For instance, in (4), we used D¯ to denote that we take the average ofDcompute (the download speed measured from the
compute service) andDstorage(the download speed measured
from the storage service).
Symbol w represents the weight, which measures users’ perceived importance on a parameter, and w1+w2= 1 and w3+w4= 1means that the sum of the weights of the benefits
and the cost each equals to 1. Fig. 1 shows the criteria to be optimized. They are categorized into two groups, i.e., to be maximized or to be minimized.
As we named this ratio the cost–benefit ratio, we put the cost on the numerator and the benefit in the denominator. As a result, we will be looking for a smaller ratio as a better option.
TABLE III
ABSOLUTEVALUE ANDCORRESPONDINGDESCRIPTIVESCALE
REPRESENTING THERELATIVEIMPORTANCE
Reversing the numerator and the denominator can still work, which just means bigger ratios indicating a better option.
3) Weight Computed by Pairwise Comparison: The weight is calculated based on the AHP’s pairwise comparison method. We choose the commonly used scale [38], [39] shown in Table III. In case a user chooses to treat all options equally, (4) becomes
0.5ar,c,lPr,c,lTr,c,l+ 0.5ζc,l,r
0.5¯μc,l,r+ 0.5 ¯Dc,l,r
. (5)
Otherwise, the weight is calculated, as shown in Table IV. The meaning of the symbols is explained in Table V.
The fully fledged AHP method consists of repeated matrix squaring to compute the eigenvector as follows:
⎡ ⎢ ⎢ ⎣
y1 τ y2
τ y3
τ y4
τ
⎤ ⎥ ⎥
⎦. (6)
Every time the eigenvector gains a tiny improvement on the precision at the cost of expensive computation, this is supposed to be repeated until no big enough difference (i.e., up to four decimal places) can be observed. In our case, we noticed that the improvement is so small that this rule can be relaxed to omit iterations on matrix squaring.
For example, a user may have a preference as that shown in Table VI. It will produce preference matrixM1, i.e.,
M1=
⎡ ⎢ ⎢ ⎣
1 13 15 15
3 1 3 5
5 13 1 3
5 15 13 1
⎤ ⎥ ⎥
⎦. (7)
Table VII shows the step breakdown to compute the eigen-vector from (7) before matrix squaring.
The result eigenvector would be
v1=
⎡ ⎢ ⎢ ⎣
0.0566 0.4248 0.3050 0.2135
⎤ ⎥ ⎥
TABLE IV
MATRIXILLUSTRATINGHOW TOTURN THEPAIRWISEPREFERENCEINTO THEGLOBALWEIGHT
TABLE V
SYMBOLSUSED IN THEWEIGHTEXPLANATION
TABLE VI
EXAMPLEUSERPREFERENCE
TABLE VII
EXAMPLEEIGENVECTORCALCULATION
If we square matrixM1, we get
M2=
⎡ ⎢ ⎢ ⎣
4 58
75 22 15
8 3
46 4 124
15 98
5
26 44
15 4 26
3 184
15 98 45
34 15 4
⎤ ⎥ ⎥
⎦ (9)
The eigenvector calculated fromM2is
⎡ ⎢ ⎢ ⎣
0.0597 0.5223 0.279 0.1389
⎤ ⎥ ⎥
⎦. (10)
The change in the value in the new eigenvector is very small, and this is why we decide to omit this step and just
use the original weight values (v1). In addition, we assume
that the preferences for the cost and the latency are 0.8 and 0.2, respectively; thus, we can calculate the overall rank as follows:
0.8ac,l,rPc,l,rTc,l,r+0.2¯ζc,l,r
× 0.0566¯μc,l,r
+ 0.4248 ¯Dc,l,r+ 0.3050
Mc,l,r+ 0.2135
Sc,l,r
−1
(11) whereM represents the memory size, andSis the storage size.
B. Implementation
Fig. 2 shows the top-level dataflow of the system we imple-mented. The data are initially collected from the web page by profiler nodes, and we use the HtmlUnit library [40]. The whole system consists of multiple agents at geographically dispersed locations to collect and process the data, as shown in Fig. 3. If we look at individual slave nodes, we can see that every node profiles the QoS statistics to various clouds from each location. Bashed scripts are written to export data from each node. A master node pulls data from its children nodes, and access keys are required for this operation. Then, the comma-separated-value-formatted data are imported to the master database, where an appropriated merge operation is performed.
Fig. 4 shows the overview of our system architecture. We use Dropbox for this prototype implementation to demonstrate the feasibility of our innovation. As long as data are properly backed up in a separate location, other mechanisms can be used. The price data are collected from providers’ websites. The problem with automatic data collection can be solved if providers release more structured data with a sufficient meta-data description, and we have proposed an ontology in previous work [20].
Fig. 2. Abstract system dataflow. This figure is better looking together with Fig. 3 for better understanding. We have used several (slave) servers to collect data from different locations. Then, we transfer them to a central server for processing and backup, and the data on this server were also archived and manually cleared every time after we imported the newly collected data into the local offline system for postprocessing and cleaning up. We only use the (summarized) average QoS data for real-time querying via API and web graphical UI as this allows us to provide a response faster.
Fig. 3. QoS monitoring service network topology. We have used two clouds, i.e., The National eResearch Collaboration Tools and Resources (NeCTAR) cloud and AWS. Since the NeCTAR cloud is free for researchers, we kept the instances running all the time; hence, we made the decision to put the master in the NeCTAR cloud. Because there is a limit of quota in the NeCTAR cloud, Amazon has greater geographical coverage in terms of data center locations. We use an additional spot instance from Amazon as slave data crawlers. A QoS monitoring node profiles the download speed, the latency, and the upload speed at each data center in various clouds from different locations.
IV. EXPERIMENT A. Setup
We run our system and proposed algorithmic technique across a range of hardware systems to understand the impli-cation of a hardware resource configuration (see Table VIII) on the performance of the approach.
To summarize, Environment 1 is the local machine used during the development of the program, which is capable of running the database and other system modules.
Environment 2 is the server from the NeCTAR cloud [41], where our system can be deployed as a service that is easily accessible over the Internet. It is a virtualized environment;
Fig. 4. Master node system architecture. In the reasoning module, the main functions and operations are broken down into different blocks. There are some other tasks that cannot be strictly categorized into existing modules, and those are put into the “Other Tasks” section; the very-light-grey block contains the evolving part of the system so it cannot be considered a stable component of the system. Although it is possible to back up the whole server, it is not necessary at this stage, and the most valuable data are stored in the MySQL database, which can be backed up much easier and cheaper by creating an “SQL dump.” This dump file is created daily and simply stored in a Dropbox folder that is free to use and keeps a history of the file stored in it for 30 days, which is sufficient for our case. The presentation layer (UI and API implementation) and the monitoring module are omitted to keep the diagram simple.
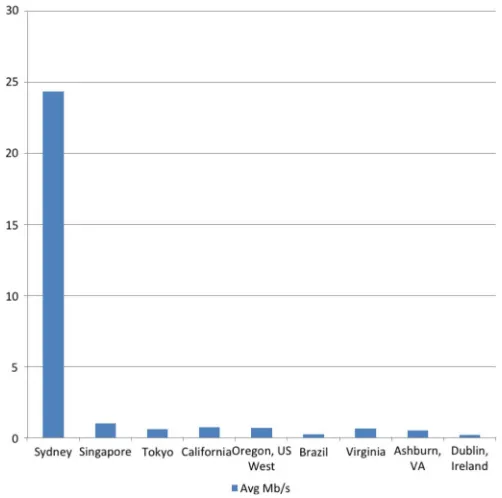
Fig. 5. Download speed from Amazon data centers to Melbourne.
TABLE VIII EXPERIMENTENVIRONMENTS
Fig. 6. Download speed against the distance.
(UI and API, respectively) compared with AWS. Being a col-laborative research cloud, it is only open to affiliated members (i.e., Australian researchers and students from a participating university). Although the access is free, there is a limitation of two instances per member and a cap on the total resource usage. Environment 3 is the spot instance type (from Amazon) we used to collect the QoS statistics from additional locations, but to cut down the cost, we kept the usage minimal.
Environment 4 is the compute-optimized spot instance type we used to test the program performance under a powerful CPU, or vertical scalability in short.
B. Network QoS Data
Fig. 5 shows that a geographically close data center has (as high as 25 times) better network performance; hence, this validates the fact that location is one of the important criteria that should be considered during the selection process. Our measurements also indicate that distance is not the only factor that affects the network performance, as shown in Fig. 6, and data centers are ordered from closest to furthest from left to right; Tokyo and Brazil clearly perform poorly than expected.
TABLE IX INPUTPARAMETERS
Hence, we consider the need for the active probing and profiling of the network QoS from users’ endpoint connection to the cloud data centers. By doing so, we get a clear picture of a data center’s network QoS from users’ devices that may be deployed across topologically distributed network locations. Note that we have left out Sydney in Fig. 6 on purpose. Fig. 5 shows the exponential increase in speed between Sydney and Melbourne compared with overseas locations, whereas Fig. 6 shows the linear relationship between the downloading speed and the dis-tance among overseas locations. We are aware that, although it is generally true that the geographical distance between any pair of servers (or users) on the Internet affects the route trip time, the bandwidth between them is not necessarily determined by the distance, and many other aspects can affect the user end QoS, such as the last-mile home-connecting technology and the local Internet traffic condition. Our measurements are only providing a suggestive base for further optimization, and a user’s actual experience will vary.
C. Case Study
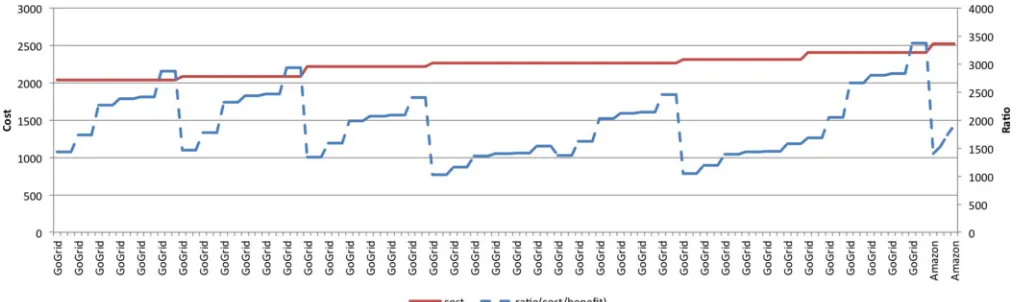
Fig. 7. Results in ascending order by the (cost–benefit) ratio.
Fig. 8. Results in ascending order by the cost.
that tend to be hard to specify (particularly for users with less technical background). A default value column shows what we use when not specified.
2) Results: Fig. 7 shows the top 5% of the result we get from the inputs in Table IX. It is in ascending order of the ratio (the cost over the benefit), as indicated by the dotted (blue) line, because a lower cost over a higher benefit gives us a smaller ratio that represents a better choice. If we look at the ranking by only considering the cost, as illustrated by the solid (red) line, the GoGrid offers dominate over the Windows offers. If the order results in ascending price order (which means that the network QoS constraints are not considered), as shown in Fig. 8, Azure disappears from the top 10% of choices. Similarly, we can see that, although the price change is small in solutions, their overall rankings are greatly different (the dotted blue line). What this means to users is that, although we can save money by ignoring the network QoS, they should be ready for degraded network performance Note that, although we tried our best in using real-world data, sometimes, cloud providers vary their prices as frequent as weekly. However, in future work, we intend to implement a price crawler service that will automatically parse a provider’s web pages and update our system’s database.
V. CONCLUSION ANDFUTUREWORK
The cloud has great potential for a large variety of users with diverse needs, but the selection of the right provider is crucial to this end. Aiming to eliminate potential bottlenecks that limit the ability of general users to take advantage of cloud computing, we present an improved system (which extended our previous work) that further allows a user to make multicriteria selection and comparison on IaaS offers considering the QoS. We hope that our research will drive the even greater adoption of the cloud and boost the expansion of cloud-hosted applications. Furthermore, the system we are proposing will also benefit a cloud provider by providing the analyses of the market and the demand, and our system can potentially recommend what price the providers can set their service to.
congestion and network link failures. There are also other inter-esting ordinal-optimization-based techniques [43], [44] worth looking at.
REFERENCES
[1] Burstorm, “Think vertical—Layered tech official blog.” [Online]. Available: http://www.layeredtech.com/blog/think-vertical/
[2] M. Zhang, R. Ranjan, A. Haller, D. Georgakopoulos, and P. Strazdins, “Investigating decision support techniques for automating cloud service selection,” inProc. IEEE 4th Int. Conf. CloudCom, 2012, pp. 759–764. [3] M. Zhanget al., “Investigating techniques for automating the selection of
cloud infrastructure services,”Int. J. Next-Gener. Comput., vol. 4, no. 3, pp. 1–18, 2013.
[4] V. Nae, A. Iosup, and R. Prodan, “Dynamic resource provisioning in massively multiplayer online games,”IEEE Trans. Parallel Distrib. Syst., vol. 22, no. 3, pp. 380–395, Mar. 2011.
[5] T. Beigbederet al., “The effects of loss and latency on user performance in unreal tournament 2003,” inProc. 3rd ACM SIGCOMM Workshop Netw. Syst. Support Games, 2004, pp. 144–151.
[6] A. Shaikh, S. Sahu, M.-C. Rosu, M. Shea, and D. Saha, “On demand platform for online games,”IBM Syst. J., vol. 45, no. 1, pp. 7–19, 2006. [7] “The real problem of Facebook Inc.’s WhatsApp acquisition,” Mar. 27,
2014. [Online]. Available: http://www.fool.com/investing/general/2014/ 03/24/two-real-problems-of-facebooks-whatsapp-acquisitio.aspx [8] “Viber,” Mar. 27, 2014. [Online]. Available: http://en.wikipedia.org/wiki/
Viber
[9] “What’s all the fuss about WhatsApp? China’s WeChat is a worthy rival | time.com,” Mar. 27, 2014. [Online]. Available: http://time.com/8873/ whats-all-the-fuss-about-whatsapp-chinas-wechat-is-a-worthy-rival [10] J. Weinman, “As time goes by: The law of cloud response time,” to
be published. http://www.JoeWeinman.com/Resources/Joe_Weinman_As _Time_Goes_By.pdf
[11] “2016: The year of the zettabyte [infographic]” 2016. [Online]. Available: http://dailyinfographic.com/2016-the-year-of-the-zettabyte-infographic.
[12] L. Wanget al., “MapReduce across distributed clusters for data-intensive applications,” inProc. IEEE 26th IPDPSW, May 2012, pp. 2004–2011. [13] “Signal transport and networks—Ska telescope,” Sep. 18, 2013.
[Online]. Available: http://www.skatelescope.org/the-technology/signal-processing/
[14] “ESA future missions—Earthnet,” ESA, Paris, France. [Online]. Available: https://earth.esa.int/web/guest/missions/esa-future-missions# _56_INSTANCE_hH2r_matmp
[15] “Big data: Where we at?” [Online]. Available: https://www. centrodeinnovacionbbva.com/en/magazines/innovation-edge/
publications/20-big-data/posts/147-big-data-where-we-at
[16] T. Hey and A. Trefethen, “The data deluge: An e-science perspective,” in Grid Computing: Making the Global Infrastructure a Reality, ch. 36. Hoboken, NJ, USA: Wiley, 2003, pp. 809–824.
[17] M. B. Taylor, “Bitcoin and the age of bespoke silicon,” inProc. Int. Conf. CASES, 2013, pp. 1–10.
[18] “Cryptocurrency,” Mar. 25, 2014. [Online]. Available: http://en. wikipedia.org/wiki/Cryptocurrency
[19] “Burstorm,” Sep. 18, 2013. [Online]. Available: http://www.burstorm. com/
[20] M. Zhanget al., “An ontology based system for cloud infrastructure services discovery,” inProc. IMECS, 2012, pp. 1–6.
[21] M. Zhang, R. Ranjan, S. Nepal, M. Menzel, and A. Haller, “A declarative recommender system for cloud infrastructure services selection,” inProc. Econ. Grids, Clouds, Syst., Serv., 2012, pp. 102–113.
[22] “Amazon web services simple monthly calculator,” Sep. 9, 2013. [Online]. Available: http://calculator.s3.amazonaws.com/calc5.html [23] “Pricing calculator | windows azure,” Sep. 20, 2013. [Online]. Available:
http://www.windowsazure.com/en-us/pricing/calculator/
[24] A. Li, X. Yang, S. Kandula, and M. Zhang, “CloudCmp: Comparing public cloud providers,” inProc. 10th ACM SIGCOMM Conf. Internet Meas., 2010, pp. 1–14.
[25] “CloudHarmony,” Sep. 20, 2013. [Online]. Available: http:// cloudharmony.com/
[26] “Cloud computing price comparison | Cloudorado—Find best cloud server from top cloud computing companies,” Sep. 20, 2013. [Online]. Available: http://www.cloudorado.com/
[27] “Yuruware—Disaster recovery and migration tools for AWS,” Sep. 20, 2013. [Online]. Available: http://www.yuruware.com/
[28] “IAT—Intelligent agent technology: CB,” Sep. 20, 2013. [Online]. Available: http://www.ict.swin.edu.au/centres/success/iat/tiki-index.php? page=CB
[29] M. Menzel and R. Ranjan, “CloudGenius: Decision support for web server cloud migration,” inProc. 21st Int. Conf. World Wide Web, 2012, pp. 979–988.
[30] “Apache hive tm,” May 1, 2014. [Online]. Available: http://hive.apache. org/
[31] J. Dean and S. Ghemawat, “MapReduce: Simplified data processing on large clusters,”Commun. ACM, vol. 51, no. 1, pp. 107–113, Jan. 2008. [32] L. Sha, X. Liu, Y. Lu, and T. Abdelzaher, “Queueing model based
network server performance control,” inProc. 23rd IEEE RTSS, 2002, pp. 81–90.
[33] A. Klein, F. Ishikawa, and S. Honiden, “Towards network-aware service composition in the cloud,” inProc. 21st Int. Conf. World Wide Web, 2012, pp. 959–968.
[34] T. Yu, Y. Zhang, and K.-J. Lin, “Efficient algorithms for web services selection with end-to-end QoS constraints,”ACM Trans. Web (TWEB), vol. 1, no. 1, p. 6, May 2007.
[35] L. Zenget al., “QoS-aware middleware for web services composition,”
IEEE Trans. Softw. Eng., vol. 30, no. 5, pp. 311–327, May 2004. [36] H. Zheng, W. Zhao, J. Yang, and A. Bouguettaya, “QoS analysis for
web service compositions with complex structures,”IEEE Trans. Serv. Comput., vol. 6, no. 3, pp. 373–386, Jul./Sep. 2013.
[37] “AWS | Amazon Simple Storage Service (S3)—Online cloud storage for data & files.” Feb. 5, 2015. [Online]. Available: http://aws.amazon.com/s3/ [38] S. H. Ghodsypour and C. O’brien, “A decision support system for
sup-plier selection using an integrated analytic hierarchy process and linear programming,”Int. J. Prod. Econ., vol. 56, pp. 199–212, 1998. [39] R. Haas and O. Meixner, “An illustrated guide to the analytic hierarchy
process,” inProc. Instit. Marketing Innovation, Univ. Natural Resources Appl. Life Sci., Vienna, Australia, 2005, pp. 10–13.
[40] “HtmlUnit:GUI-less browser for java programs,” Nov. 20, 2014. [Online]. Available: http://htmlunit.sourceforge.net/.
[41] “home | nectar,” May 5, 2014. [Online]. Available: https://nectar.org.au/ [42] H. Mouratidis, S. Islam, C. Kalloniatis, and S. Gritzalis, “A framework
to support selection of cloud providers based on security and privacy requirements,”J. Syst. Softw., vol. 86, no. 9, pp. 2276–2293, Sep. 2013. [43] F. Zhanget al., “Evolutionary scheduling of dynamic multitasking
work-loads for big-data analytics in elastic cloud,” IEEE Trans. Emerging Topics Comput., vol. 2, no. 3, pp. 338–351, Sep. 2014.
[44] F. Zhang, J. Cao, K. Li, S. U. Khan, and K. Hwang, “Multi-objective scheduling of many tasks in cloud platforms,” Future Gener. Comput. Syst., vol. 37, no. 0, pp. 309 – 320, 2014. Special Section: Innova-tive Methods and Algorithms for Advanced Data-Intensive Computing Special Section: Semantics, Intelligent processing and services for big data Special Section: Advances in Data-Intensive Modelling and Simu-lation Special Section: Hybrid Intelligence for Growing Internet and its Applications.
[45] J. Zhanget al., “Climate impacts of stochastic atmospheric perturba-tions on the ocean,”Int. J. Climatology, vol. 35, no. 15, pp. 3900–3912, 2014.
[46] X. Xinet al., “How much of the NAO monthly variability is from Ocean-Atmospheric coupling: Results from an interactive ensemble climate model,”Climate Dyn., vol. 44, no. 3/4, pp. 781–790, 2014.
[47] L. Liet al., “The flexible global ocean-atmosphere-land system model, grid-point Version 2: FGOALS-G2,”Adv. Atmosp. Sci., vol. 30, no. 3, pp. 543–560.
Miranda Zhang received the Bachelor’s degree from the University of New South Wales, Sydney, Australia. She is currently working toward the Ph.D. degree at the Australian National University, Canberra, Australia.
Rajiv Ranjanreceived the Ph.D. degree in engineer-ing from The University of Melbourne, Parkville, Australia, in 2009.
He is currently a Research Scientist and a Julius Fellow with the Computational Informatics Division (formerly known as CSIRO ICT Centre), Common-wealth Scientific and Industrial Research Organisa-tion (CSIRO), Dickson, Australia. He has published 62 scientific and peer-reviewed papers (7 books, 25 journals, 25 conferences, and 5 book chapters). His h-index is 20, with a lifetime citation count of more than 1660 (Google Scholar). His papers have also received more than 140 ISI citations. In addition, 70% of his journal papers and 60% of conference papers have been A*/A-ranked ERA publication. His expertise is in data center cloud computing, application provisioning, and performance optimization.
Dr. Ranjan has been invited to serve as the Guest Editor for leading distributed systems journals, including the IEEE TRANSACTIONS ONCLOUD
COMPUTING,Future Generation Computing Systems,and Software Practice and Experience. One of his papers was in 2011’s top computer science journal, the IEEE COMMUNICATIONSURVEYS ANDTUTORIALS.
Michael Menzelreceived the Diploma in informa-tion systems (business informatics; Wirtschaftsin-formatik) from the University of Mannheim, Mannheim, Germany, in 2009. During his stud-ies of information systems at the University of Mannheim, he focused on distributed and mobile systems, database systems, and logistics. Further-more, he acquired knowledge about eBusinesses and eGovernments, business administration, organi-zational aspects of businesses, and marketing. He wrote his diploma thesis on the subject “Design and Implementation of a Tool to create Queries in Complex Event Process-ing Systems” in cooperation with the Research Department of webMethods Software AG, Darmstadt, Germany, at the chair of the Assistant Professor for Computer Science and Information Systems, Prof. Carl-Christian Kanne. Since November 2009, he has been working toward the Doctoral degree in the Institute of Applied Informatics and Formal Description Methods (AIFB), Karlsruhe Institute of Technology (KIT), Karlsruhe, Germany. His doctoral thesis is about cloud migration, and he is part of the organization chair of Prof. Stefan Tai.
Since November 2009, he has been a Research Scientist with the Information Process Engineering Group, Forschungszentrum Informatik (FZI). He has been active in multiple research projects related to the disruptive technology cloud computing. At KIT and FZI, he is involved in the field of cloud computing, particularly in the process and decisions made over a migration into the cloud.
Surya Nepal received the Master’s degree from the Asian Institute of Technology, Klong Luang, Thailand, in 1996 and the Ph.D. degree from RMIT University, Melbourne, Australia, in 2000?
He is currently a Principal Research Scientist with the Commonwealth Scientific and Industrial Research Organisation (CSIRO), Dickson, Australia. His research interests include cloud computing, Web service, and distributed computing.
Peter Strazdinsis currently an Associate Professor with the Computer Systems Group, Research School of Computer Science (RSCS), Australian National University (ANU), Canberra, Australia. He is the Convener of the Bachelor of advanced computing. From 2009 to 2013, he was the Associate Director of Education of RSCS, ANU. Up to 2009, he was the Convener of the Coursework Masters programs, the Computer Science and Information Technology (CSIT) Safety Coordinator, the Chair of the CSIT Occupational Health and Safety Committee, and Co-ordinator of the CSIT Ride to Work Group.
Dr. Strazdins is also a Green Rep, a Delegate to the National Tertiary Education Union.
Wei Jiereceived the Ph.D. degree in computer en-gineering from Nanyang Technological University, Singapore.
He is currently a Senior Lecturer with the School of Computing and Technology, University of West London, London, U.K. Prior to this, he was a Re-search Fellow with The University of Manchester, Manchester, U.K., and a Senior Research Engineer with the Institute of High Performance Computing, Singapore. He has been actively involved in the area of parallel and distributed computing for many years and published more than 40 papers in international journals and conferences. His current research interests include cloud computing, big data processing and analytics, computing security technologies, and multidisciplinary research.
Lizhe Wang(M’05–SM’09) received the B.E. and M.E. degrees from Tsinghua University, Beijing, China, and the Doctor of Engineering degree (magna cum laude) from Karlsruhe Institute of Technology, Karlsruhe, Germany.
He is currently a Professor with the Institute of Remote Sensing and Digital Earth, Chinese Academy of Sciences, Beijing, and a Chutian Chair Professor with the School of Computer Science, China University of Geosciences, Wuhan, China. His main research interests include cloud computing, high-performance computing, e-Science, and spatial data processing.
Prof. Wang is a Fellow of The Institution of Engineering and Technology and the British Computer Society. He serves as an Associate Editor for the IEEE TRANSACTIONS ONCOMPUTERSand the IEEE TRANSACTIONS ON