1 Title Page
1 2
Kathryn Holloway, Denise Roche and Peter Angell. 3
4
Evaluating the progressive cardiovascular health benefits of short-term high intensity 5
interval training. 6
7
Liverpool Hope University, School of Health Sciences, Hope Park, Taggart Avenue, Liverpool, 8
L16 9JD. 9
10
Corresponding author: 11
Kathryn Holloway 12
01512913227 14
15 16
Acknowledgements 17
We would like to thank Mark Bell and Sean Muirhead for their contribution to the exercise 18
programme. 19
2 Abstract
1
Purpose High-intensity training is recognised as a time efficient way of improving aerobic 2
fitness. However, there is a lack of consensus regarding the temporal nature of adaptation 3
response and which peripheral and cardiac changes occur using the same exercise stimulus and 4
protocol. Therefore, this study aimed to evaluate the progression of vascular and cardiac 5
changes over a 6-week training period. 6
Methods Twelve healthy males (age 21±2 years; 42.5±8.3 ml.min-1.kg-1) participated in a high-7
intensity training programme consisting of 1-minute sprints, interspersed with 2 minutes active 8
recovery, 3 days/week for 6 weeks on a cycle ergometer. Cardiac, vascular, blood lipids and 9
VO2max measurements were taken at 0, 3 and 6 weeks and compared against a participant-10
matched control group (age 21±2 years; 37.7 ± 8.3 ml.min-1.kg-1). 11
Results There was a significant improvement in VO2max (42.5±8.3 ml.min-1.kg-1 to 47.4 ± 8.5 12
ml.min-1.kg-1; p=0.009) in the training group and a significant decrease in systolic blood 13
pressure (8%) from 0-6 weeks (p=0.025). There was a small yet significant decrease in ejection 14
fraction and increased end-systolic volume in both groups over time (p=0.01) with no 15
significant interaction effect (p>0.05). A between-group difference in peak velocity of early 16
diastolic mitral annular motion was also observed (p=0.01). No improvements were seen in 17
blood lipid profiles, central arterial stiffness and cardiometabolic risk score. 18
Conclusions Six weeks of high-intensity training increases aerobic fitness and is enough to 19
stimulate initial reductions in peripheral pressure, but not sufficient to elicit structural and 20
functional cardiac changes, reduce arterial stiffness or lower CV risk. 21
22
Key words 23
High-intensity, exercise training, cardiac function, vascular structure, cardiovascular risk 24
25
Abbreviations 26
A Peak velocity of late transmitral flow
27
A’ Peak velocity of diastolic mitral annular motion 28
Alx Augmentation index
29
AP Central augmented pressure
30
a-VDO2 Arterial-venous difference
31
BMI Body mass index
32
COmax Maximal cardiac output
3
CRF Cardiorespiratory fitness
1
CVD Cardiovascular disease
2
DBP Diastolic blood pressure
3
DP Central aortic diastolic pressure 4
E Peak velocity of early diastolic transmitral flow 5
E’ Peak velocity of early diastolic mitral annular motion 6
EF Ejection fraction
7
FBG Fasting blood glucose
8
HDL-C High-density lipoprotein cholesterol 9
HIIT High intensity interval training 10
HR Heart rate
11
IVSd Interventricular septum thickness at end -diastole 12
LDL-C Low-density lipoprotein cholesterol 13
LV Left ventricle
14
LVEDV Left ventricular end-diastolic volume 15
LVESV Left ventricular end-systolic volume 16
LVIDd Left ventricular internal diameter end diastole 17
LVIDs Left ventricular internal diameter end systole 18
LVPWd Left ventricular posterior wall thickness at end –diastole 19
MAP Mean arterial pressure
20
NO Nitric oxide
21
PP Central aortic pulse pressure
22
PWV Pulse wave velocity
23
S’ Peak velocity of systolic mitral annular motion 24
SBP Systolic blood pressure
25
SIT Sprint interval training
26
SP Central aortic systolic pressure
4
SV Stroke volume
1
SVmax Maximal stroke volume
2
TC Total cholesterol
3
TG Triglycerides
4 5 6
Introduction 7
An emerging body of evidence is highlighting the positive impact that high intensity interval 8
training (HIIT) has on an individual’s physical health. HIIT can be defined as repeated short 9
bouts of high intensity aerobic exercise (typically >90% VO2max; Kessler et al. 2012) 10
interspersed by periods of lower intensity passive or active recovery (Astorino et al. 2012). 11
Numerous training studies have demonstrated the effectiveness of endurance training on 12
cardiorespiratory fitness (CRF; Kemi et al. 2005; Leon, 1997). However, more current research 13
has identified HIIT as a more time efficient method compared to endurance training (Gormley 14
et al. 2008; Helgerud et al. 2007) with HIIT eliciting greater increases in CRF within a variety 15
of population groups including healthy sedentary (Weston et al. 2014) and heart failure patients 16
(Angadi et al. 2015). HIIT has also shown increased adherence rates compared to continuous 17
training in healthy (Heisz et al., 2016) and diseased groups (Jung et al., 2015), highlighting its 18
potential for wider use amongst the general population. With a large percentage of the 19
population not meeting the current physical activity guidelines, and lack of time as the biggest 20
barrier (Godin et al. 1994), understanding how HIIT can improve overall cardiovascular health 21
is fundamental. In addition, with 64% of participants dropping out of a long-term exercise 22
programmes within the first 8 weeks (Heisz et al., 2016), it is important to understand the 23
immediate benefits of short-term HIIT. 24
Fifteen minutes of daily high intensity exercise can reduce all-cause mortality risk by 25%, 25
which is equivalent to completing 60 minutes of daily moderate intensity physical activity 26
(Wen et al. 2011). It has therefore been suggested that there is an inverse dose-response 27
relationship between mortality risk and the proportion of high intensity exercise performed, 28
which would suggest a need to endorse high intensity exercise (Gebel et al. 2015). More 29
specifically, HIIT has been shown to improve a variety of direct and indirect cardiovascular 30
indices, with as little as six sessions of HIIT improving VO2max by 10% (Esfandiari et al. 2014). 31
Notwithstanding the improvements seen in CRF, the key indices contributing to this 32
enhancement remain elusive and so have been associated with a number of different 33
physiological adaptations. MacPherson et al. (2011) ascertained that 6 weeks of sprint-interval 34
training mediated no change in cardiac function, but the augmentation in CRF was increased 35
due to peripheral adaptations. This has primarily been associated with enhanced vascular 36
structure and function, provoking a greater blood flow through the vessels, consequently 37
increasing oxygen availability and promoting a greater shear stress-induced nitric oxide (NO) 38
5
relationship between an increase in blood flow and increase in shear stress with increasing 1
exercise intensity. Consequently, an increase in NO release has been associated with an 2
improvement in CV risk profile with recurring intermittent increases in shear stress instigating 3
vascular adaptations and remodelling of the artery (Wilson et al. 2015). The augmented shear 4
associated with high-intensity exercise would predict an increased likelihood of notable 5
vascular adaptations to HIIT, although there is limited data on the response in healthy 6
individuals with studies mainly having been undertaken in diseased populations (Thijssen et 7
al. 2009). In fact, Tjonna et al. (2011) showed that HIIT is sufficient in maintaining normal 8
vascular function in healthy adults but very limited potential for further vascular improvements 9
due to the healthy nature of the subjects. Despite this, Tinken et al. (2008) showed that exercise 10
training initiates improvement in vasodilator function in healthy young men in as little as 2 11
weeks. This therefore raises the question of the effectiveness of HIIT in the general population 12
who are currently free from cardiovascular disease but are of a sedentary nature, since 13
peripheral adaptations are associated with CRF and consequently CV risk. 14
Conversely, increases in cardio-respiratory fitness have also been associated with cardiac 15
adaptations that have predominantly occurred during the active recovery phase that occurs in-16
between the high-intensity intervals. Astorino et al. (2017) found that 6 weeks of HIIT 17
significantly increased CRF through an increase in maximal stroke volume (SVmax) and 18
maximal cardiac output (COmax), but found no increase in arterial-venous difference (a-VDO2). 19
Cardiac output is enhanced through the increase of LV volume and a decrease in peripheral 20
resistance (Tschakert et al. 2013) which enhances end-diastolic volume and stroke volume 21
(SV). Buchheit et al. (2013) describes that working at an intensity close to maximal SV triggers 22
these cardiac adaptations in HIIT. However, it is important to note that HIIT may not induce 23
structural changes quickly (<6 weeks) as increases in SV have also been attributed to an 24
increase in plasma volume thus eliciting increases in blood volume and subsequently SV. 25
Therefore, it is important to ascertain at which point cardiac structural changes appear with 26
HIIT since the intermittent nature of exercise and recovery has the potential to improve CRF 27
and thus reduce CVD risk. 28
High intensity interval training protocols vary amongst research groups in regards to exercise 29
intensity, work: rest ratios, duration and frequency of exercise. It is therefore difficult to fully 30
elucidate the extent of potential simultaneous peripheral and cardiac changes that are induced 31
by HIIT. Only one study to date has incorporated both cardiac and vascular measurements 32
using HIIT in adult males (Heydari et al. 2013) but this study adopted a sprint interval training 33
(SIT) based protocol (8 second sprint, 12 second recovery) rather than an HIIT protocol. HIIT 34
has been shown to produce a lower perceived exertion and a higher positive affect in 35
comparison to SIT (Wood et al. 2015) and therefore could be deemed more appropriate for the 36
general population. In addition, HIIT has also been deemed as a safe exercise regime to 37
undertake even with high risk groups (Weston et al. 2014), thus furthermore allowing the 38
protocol to be used beyond the general population if required. 39
Exercise intensity, as opposed to duration, has been deemed as the most important variable in 40
determining CRF (Karlsen et al. 2017). With a clear association between cardio-respiratory 41
6
indices are primarily adapting with HIIT and the time-course of responses. Therefore, this 1
study investigated the simultaneous changes in peripheral and cardiac indices from a 2
temporal perspective using a HIIT based protocol to elucidate potential cardiovascular 3
improvements. As a consequence, we hypothesise that HIIT will significantly improve 4
indices of vascular function, which in turn may elicit cardiac changes in the form of an 5
improvement in systolic function. 6
7
Methods 8
Study design 9
Subjects were individually assigned to one of two parallel groups, an exercise intervention and 10
control group. The study was an open-label study, with an allocation ratio of 1:1. The study 11
took place in the exercise physiology laboratories, Liverpool Hope University, Liverpool, UK 12
from January 2016 to April 2016. 13
14
Subjects 15
Subjects were recruited through University advertisements, email bulletins and notice boards. 16
Inclusion criteria included healthy males, non-smokers, free from cardiac or respiratory 17
pathologies and not taking regular medication. Twenty-one subjects were recruited, with 14 18
subjects assigned to the intervention group to complete a 6-week high-intensity exercise 19
programme (age 21±2 years, body mass 73.5±9.5 kg, BMI 24±3 kg/m2) and 7 subjects were 20
assigned to a control group (age 21 ± 2 years, body mass 71.4±7.6 kg, BMI 23±3 kg/m2). Two 21
subjects from the intervention group withdrew from the study due to injury that was gained 22
outside of the exercise programme. 23
This study was approved by the Ethics Committee of Liverpool Hope University and all 24
subjects gave their written informed consent. 25
26
Experimental design 27
All physiological measurements were taken at baseline, 3 weeks and 6 weeks. All subjects 28
refrained from consuming caffeine (6 hours), food (12 hours), alcohol (12 hours) and strenuous 29
exercise (24 hours) before measurements were conducted. Subjects successively completed 18 30
HIIT sessions, with an average 89% completion rate. Subjects were removed from the study 31
if their completion rate was below 80%. Subjects were tested and trained at the same time of 32
day to avoid diurnal variation. Post training tests at 3 and 6 weeks were taken within 48-120 33
hours after the last HIIT session. Subjects were asked to maintain the same dietary intake and 34
7
All data was collected over 2 days of testing in a standard laboratory environment (room 1
temperature 22°C, relative humidity 10%). 2
3
Anthropometrics 4
Total body and segmental body fat analysis was conducted using bioelectric impedance (Tanita 5
T5896, Tokyo). Height was measured to the nearest 0.1cm using a stadiometer (SECA, 6
Germany) and weight was measured to the nearest 0.1kg using scales (SECA, Germany). Body 7
mass index was then calculated using the formula body mass (kg) divided by height squared 8
(m). 9
10
VO2MAX 11
Subjects performed the VO2max test on a cycle ergometer (Lode Excalibur Sport, Lode B.V 12
Technology, Groningen, Netherlands). Breath by Breath analysis was collected through a 13
Respiratory Ergostik (Geratherm, Bremen, Germany), evaluating the expired O2 and carbon 14
dioxide (CO2) using the Blue Cherry software (CV% = 3%). Calibration of the Ergostik 15
occurred prior to every test with O2, CO2 and nitrogen gas percentages accounting for 16%, 16
4% and 80% respectively. Subjects were fitted with a H2 Polar HR monitor (Polar Team 2 17
Heart Rate Monitor System) and then sat resting for 2 minutes to gain baseline respiratory 18
values. Following this, a 5-minute warm up was instructed at a power output corresponding to 19
that of the initial stage of the ramp test (50 watts). Once the warm up was complete, the ramp 20
test instantaneously began with intensity increasing 25 watts per minute. Subjects cycled at an 21
rpm between 60 and 70 for as long as possible until exhaustion. The test was terminated when 22
rpm fell below 60 for longer than 10 seconds, while HR within 10 beats of the age related max 23
and RER ≥1.15 displayed if a true VO2max was achieved. Following this, a 2-minute cool down 24
was advised, at 50 watts. The VO2 for each 30 second epoch was averaged. The maximum 30 25
second average value was reported. 26
27
Assessment of vascular structure and function. 28
For all vascular measurements, subjects remained in a supine position for 10 minutes before 29
testing commenced in a temperature-controlled room. 30
Pulse wave analysis
31
Pulse wave analysis measurements were attained using a SphygmoCor System (AtCor 32
Medical, Sydney, Australia). An automated cuff was placed around the upper left arm and was 33
inflated to measure brachial systolic and diastolic pressures and central pressures. 34
Measurements were taken twice. A third test was completed if the previous two measurements 35
were >5mmHg different from each other. Following this, the cuff was re-inflated to capture 36
8
Aortic Diastolic Pressure (DP) was calculated by the lowest pressure value recorded in a pulse 1
and Central Aortic Systolic Pressure (SP) was calculated as the maximum pressure during 2
aortic injection. Central Aortic Pulse Pressure (PP) was then calculated as Central Aortic 3
Systolic Pressure (SP) minus the Central Aortic Diastolic pressure (DP). The Central 4
Augmented Pressure (AP) was calculated as the difference between the two pressure peaks 5
during systole and the Augmentation Index (Alx) is the ratio of AP to PP. Mean Arterial 6
Pressure (MAP) and Heart rate (HR) were also measured. 7
Pulse wave velocity
8
Pulse wave velocity measurements were attained using a SphygmoCor System (AtCor 9
Medical, Sydney, Australia). Measurements were standardised according to recommendations 10
by Van Bortel et al. (2012). PWV was taken from the left carotid artery to the left femoral 11
artery with subjects laying in a supine position. The distance between the carotid site and the 12
manubrium sterni and the carotid to femoral artery distance was determined to the nearest 13
millimetre (mm). PWV was measured by aligning the high-fidelity tonometer with the carotid 14
artery pulse, holding in position until full assessment was completed. A pressure cuff was 15
positioned around the upper left thigh. Time delays between proximal and distal waveforms 16
were then used to calculate PWV (m/s) by the following equation: PWV = D/Δt in which D is 17
the distance (m) and Δt is the time interval (s). The SphygomoCor software will only accept 18
values that are within a standard deviation of ≤10%, which has been shown to be highly 19
reproducible (Wilkinson et al. 1998). 20
Vascular structure
21
Brachial artery imaging was conducted using a VividQ ultrasound scanner (GE Healthcare, 22
UK). Scans were performed on the right arm with the subject in a supine position. The 23
ultrasound probe (6-13MHz) was placed above the antecubital fossa in the longitudinal plane. 24
Femoral artery measurements were taken on the right leg, in a supine position, at the midpoint 25
of the inguinal ligament. Three wall-to-wall measures were taken of each artery using the 26
Vividq calliper option and an average was calculated to give a true diameter (cm) value. 27
28
Assessment of cardiac structure and function. 29
Global and segmental cardiac structure and function were assessed using ultrasound 30
echocardiography (Vivid Q, GE Healthcare, Norway). Images were taken of the left ventricle 31
(LV) in multiple planes from parasternal and apical acoustic windows. All measurements were 32
performed by a single experienced echocardiographer with the participant in the left lateral 33
decubitus position. 34
Parasternal long axis views allowed the collection of M-mode images at the tips of the mitral 35
valve leaflets perpendicular to septal and posterior walls taking care to ensure clear endocardial 36
definition. From M-mode traces septal (IVSd) and LV posterior wall thickness (LVPWd) in 37
diastole as well as LV chamber dimensions at end-diastole and systole (LVIDd, LVIDs) were 38
9
Apical 4-chamber views were digitised to assess LV end-diastolic (LVEDV) and end-systolic 1
(LVESV) volumes, which allowed the estimation of stroke volume (SV) and ejection fraction 2
(EF) using Simpsons’ bi-plane method. From the 4-chamber view, colour Doppler and then 3
pulsed wave Doppler were used to assess peak flow velocities across the mitral valve. Using 4
a 4 mm sample volume in the area of peak flow LV early (E) and late (A) diastolic in-flow 5
velocities were recorded. From the same view, tissue-Doppler measures of myocardial wall 6
velocities were recorded. Taking care to adjust filters and scale and with the septal wall parallel 7
to the ultrasound beam, we interrogated the mitral annulus at the septal wall, recording peak 8
systolic (S’) as well as early (E’) and atrial (A’) diastolic tissue velocities. The ratio of early 9
to late diastolic filling and tissue velocities were formulated. 10
Two-dimensional image optimisation including maintaining frame rate between 40 and 90 fps 11
was performed. For all measurements, images were analysed off-line by a single experienced 12
technician. Data reflect the average of 3-5 continuous cardiac cycles. 13
14
Blood analysis 15
A fasting 35 µm finger-capillary blood sample was collected in sterile conditions for the 16
subsequent determination a number of metabolic markers including: fasting blood glucose 17
(FBG, mmol.L-1), Total Cholesterol (TC, mmol.L-1), low-density lipoprotein cholesterol (LDL-18
C, mmol.L-1), high-density lipoprotein cholesterol (HDL-C, mmol.L-1), Triglycerides (TG, 19
mmol.L-1) and TC:HDL-C ratio. The free-flow whole blood was analysed using a LDX 20
Cholestech analyser (Cholestech Corporation, USA). 21
22
Calculation of clustered metabolic risk score 23
Standardised z scores were calculated for percentage body fat, TC-HDL ratio, Glucose, 24
Triglycerides and MAP (based on the clustered risk score by Lamb et al. 2016). These were 25
then summed to create a composite clustered risk score. This composite score of 26
cardiometabolic risk may compensate for day to day fluctuations in individual risk factors. 27
28
High intensity training intervention 29
A five minute warm up of unloaded cycling at 60rpm preceded five 1 minute cycling bouts at 30
90% of the subject’s VO2max, interspersed with 2 minutes, resistance free active recovery at 60 31
rpm. This was repeated 3 times a week for 6 weeks, reaching 15 minutes of exercise per 32
session, using a cycle ergometer (Monark, Ergomedic 874E, Vansbro, Sweden) throughout. 33
All training sessions were supervised to ensure completion of training. Subject’s training load 34
was adjusted at 3 weeks to align with any changes in VO2max found at the 3-week assessment 35
point. 36
10 Statistics
1
All statistical analysis was performed using SPSS v. 23 (IBM Statistics, UK). To determine 2
differences at 0, 3 and 6 weeks, an Analysis of Covariance (ANCOVA) was performed with 3
the pre-variable as the covariate and the group as the between-subjects factor. Bonferroni 4
pairwise comparisons were used to determine at which time points these differences occurred. 5
Partial eta squared (ŋ2) values provide estimates of effect sizes for the main analyses where 6
partial ŋ2 ≥ 0.01, 0.09 and 0.25 classified as small, medium and large effect sizes respectively 7
(MRC, 2009). 8
9
Results 10
Aerobic capacity 11
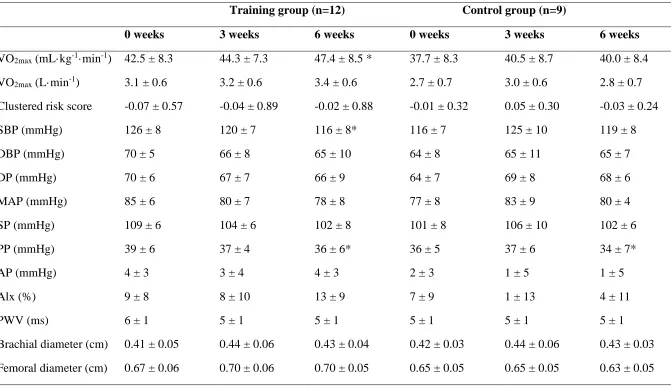
Pairwise comparisons revealed that there was an improvement in maximal oxygen 12
consumption (VO2max) in the exercise group from 0-6 weeks of 10% (p=0.009; partial ŋ2= 13
0.191). The control group exhibited no change in VO2max across the 6 weeks (p=.686). 14
Vascular structure and function 15
There was a significant decrease in peripheral SBP (p=0.005; partial ŋ2= 0.232) in the training 16
group from 0-6 weeks. There was also a significant main effect for PP over time (p=0.041; 17
partial ŋ2= 0.204). There were no other significant group differences in vascular structure and 18
function across the training programme. 19
PWV and vascular structure measurements did not significantly change after the exercise 20
intervention (table 1). 21
Cardiac structure and function 22
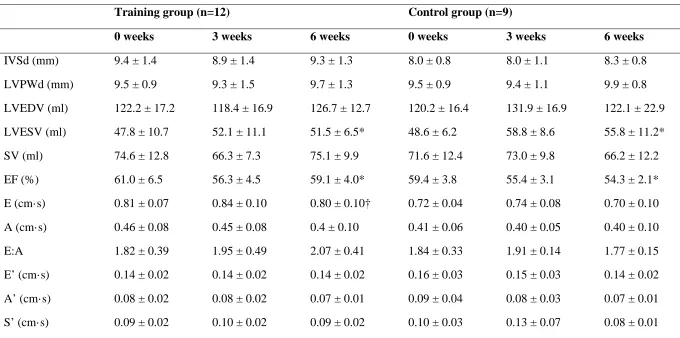
There was a small yet significant decrease in ejection fraction and increase in end-systolic 23
volume in both groups over time (p=0.01; partial ŋ2= 0.295 and partial ŋ2= 0.429 respectively) 24
with no significant group effect or interaction (p>0.05). A between group difference in E was 25
also observed (p=0.01; partial ŋ2= 0.361) however this was due to greater early diastolic filling 26
velocities in the training group pre-intervention that persisted throughout the study. All other 27
cardiac measurements were unchanged by the training intervention and not significantly 28
different from the control group. 29
Blood analysis and CV risk factors 30
There were no significant group differences or training effects on clustered risk score (table 1; 31
F (2, 22) = 0.483, p=0.623). Anthropometric measurements were also not changed with the 32
training programme (p>0.05). 33
11 Discussion
1
This study, to current knowledge, is the first to investigate the simultaneous temporal changes 2
in peripheral and cardiac indices to elucidate the cardiovascular response to HIIT in a 6 week 3
period. The main finding of this study is that HIIT elicited improvements in aerobic capacity, 4
which are likely to be attributed to improved oxygen delivery and/or mitochondrial adaptations 5
since no improvements in cardiac function or vascular function were seen. In addition, there 6
were no beneficial reductions in CV risk factors or central arterial stiffness, but an improvement 7
in peripheral blood pressure was evident. 8
Enhancements in cardiorespiratory fitness are strongly associated with cardiovascular risk 9
reduction (Wilson et al. 2015). Kaminsky et al. (2013) reported that a rise of one metabolic 10
equivalent (3.5 ml O2·kg−1·min−1) in VO2max improved CVD survival by 10-25%. The present 11
study found that aerobic fitness was significantly increased by 11% (5ml O2·kg−1·min−1) with 12
the 6 week training programme, suggesting a reduction in overall CV risk. However, the 13
clustered metabolic risk score was not significantly changed with training, suggesting that a 14
longer training period or greater volume of training is required to improve cardiometabolic 15
profiles. This is supported by Nybo et al (2010) who did not find any changes in total 16
cholesterol, HDL and LDL after 12 weeks of HIIT. However, they did show a significant 17
reduction in fasting glucose levels from 5.7±0.2mM to 5.2±0.1mM. Our subjects already had 18
baseline fasting glucose values of 5.2±0.4mM and this therefore could explain why no 19
reductions were observed with the training program, suggesting the lowest threshold had 20
already been reached. 21
An increase in VO2max of 11% is particularly large in comparison to similar studies, with 22
Helgerud et al. (2007) showing an increase of only 7.2%. However, Gormley et al. (2008) have 23
previously shown that 6 weeks of high intensity training improves VO2max with moderate- 24
(10.0%), vigorous- (14.3%), and the near-maximal-intensity (20.6%) exercise. They 25
concluded that the highest intensity used for the significant portion of training was more 26
important than the mean intensity across the exercise protocol. Across our 15 minute protocol, 27
33% of that time was spent at a high intensity work rate of 90% VO2max. However, Helgerud 28
et al. (2007) included 57% of high intensity work at 88% VO2max suggesting that the proportion 29
of high intensity training used is not necessarily indicative of improvements in VO2max with 30
high intensity training. Bacon et al. (2013) has recently observed that longer high intensity 31
intervals of 3-5 minutes can generate a marked increase in VO2max. However, our study 32
deliberately included 1-minute work periods since Bacon et al. (2013) also observed that it 33
would be unrealistic for significant proportions of the population to participate in such an 34
exercise program that causes individuals to reach their upper limit for VO2max. Our current 35
study did not have any withdrawals from the training group, but did eliminate two subjects for 36
not meeting the threshold attendance. Therefore, using this time-efficient (15 minutes total 37
exercise time) design may be a useful tool in significantly improving aerobic fitness in young 38
adults. 39
An association between higher aerobic fitness and lower central arterial stiffness has been 40
12
the influence that aerobic capacity has on large artery stiffness. There was no significant 1
change in PWV with training, suggesting no change in aortic stiffness, and no significant 2
change in augmentation index (Alx) over the 6-week training period. Alx provides an indicator 3
of systemic arterial stiffness by measuring the contribution that the wave reflection makes to 4
the arterial pressure waveform. More recently, a dose-response relationship has been found 5
between exercise intensity, rather than volume of exercise, in improvement in Alx (Ashor et 6
al. 2014). However, 6 weeks of high intensity exercise training was not enough to elicit any 7
improvement in Alx. Padilla et al. (2008) and Tanaka et al. (2006) have both shown that high 8
intensity exercise is associated with the highest post-exercise shear stress. Therefore, 9
augmented NO release would result in a greater reduction in peripheral vascular resistance and, 10
consequently, Alx (Ashor et al. 2014). Conversely, Goto et al. (2003) showed that high 11
intensity exercise augmented oxidative stress, which may negate the positive effect that shear 12
stress has on endothelial function. In addition, high intensity exercise has been shown to 13
stimulate increases in blood flow leading to a non-laminar shear stress and thus resulting in no 14
enhancement in endothelial function (Harrison et al., 2006). Alx can be influenced by a number 15
of factors including age, gender, height, heart rate and some blood lipids (Wilkinson et al. 16
2002). All subjects were matched in age and gender, and similar in height (176±5cm). 17
However, no significant change in Alx was still observed when matched to 75% heart rate 18
(Alx@75%). 19
In relation to this, there was a significant decrease in peripheral SBP of 7% following 6 weeks 20
of training, suggesting an improvement in vascular resistance. Nybo et al. (2010) showed the 21
same decrease (-8mmHg) following 12 weeks of HIIT, however these same changes also 22
appeared in the prolonged running and strength training groups. Cornelissen et al. (2013) 23
showed that a lower training intensity had a small effect (+0.073) on reducing SBP in 24
comparison to moderate (-4.8) and high (-3.6) intensity exercise. However, these effects were 25
dependent on hypertensive status. High intensity interval training may lower SBP due to an 26
increase in endothelial NO availability resulting from an increase in blood velocity (Batacan et 27
al., 2016). However, with no changes in Alx or central pressures, it would suggest that there 28
may be other mechanisms which are enhancing vascular function with HIIT beyond increasing 29
shear stress. 30
However, it is important to note that recent studies have shown that central pressure is more 31
strongly related to future cardiovascular events than brachial pressures (Roman et al. 2007; 32
Pini et al. 2008; Jankowski et al. 2008). Although central pulse pressure (PP) showed a 33
significant main effect over time, both groups exhibited a decrease in PP which suggests a non-34
training effect. Smulyan et al. 2003 stated that PP measurements using the SphymoCor system 35
can be variable (SD=13.6mmHg). This therefore may explain the significant decrease of 3 36
mmHg and 2mmHg found in the training and control groups respectively. In addition, central 37
arterial pulse pressure has also been associated with carotid intima-media thickness 38
(Boutouyrie et al. 1999) and therefore with no changes in brachial or femoral vascular diameter, 39
it is suggestive that the HIIT programme had no effect on vascular structure. 40
There were no significant changes to any cardiac structural measures in response to training 41
13
morphology, however the present study found no change in cardiac structural measures most 1
likely due to the relatively short-duration of the study (Wislof et al, 2007). Whilst significant 2
decreases in ejection fraction were observed in both groups, these changes were small and 3
likely to be of little consequence as values were within the normal interstudy reliability range 4
of 7% (Grothues et al. 2002). There was a significant difference in ESV between groups at 5
each time-point but this is likely due to pre-intervention differences. With no meaningful 6
change in systolic function, these differences could be due to subtle heart rate variations with 7
changes within normal measurement variation. 8
Previous research has found improvements in autonomic cardiovascular control following 12 9
weeks of training (Hedari et al. 2013), whilst improvements in cardiac function have been seen 10
in cardiac patients including those with heart failure and coronary artery disease (Guiraud et 11
al. 2012) and additionally, a reduction in endocardial damage (Cassidy et al. 2017). The lack 12
of meaningful changes in cardiac function in the present study may be as a result of the good 13
health status observed in both the training and control groups. In contrast to patients with 14
cardiac disease, the subjects in the present study may have already been toward the upper end 15
of the cardiac adaptations possible without substantial increases in training load. Contrastingly, 16
the length of intervention may not have been sufficient to elicit significant structural and 17
functional changes at the cardiac level as the majority of studies who have seen these 18
improvements have been greater than 12 weeks (Wisloff et al. 2007). 19
Our study is strengthened by the supervision of all training sessions and the continual 20
verification of participants working at the correct intensities and completing the training 21
protocol. Participants were recreationally active and were therefore asked to continue their 22
normal habitual exercise that was monitored by training logs during the 6 weeks. Control 23
participants were recruited by convenience rather than random assignment and were matched 24
for age, physical activity levels and health status. They did exhibit a lower mean VO2max (4.75 25
ml.min-1.kg-1 mean difference) compared to the training group, but pairwise analysis showed 26
no significant difference between the groups at baseline (p=.242). Although the control group 27
were asked to maintain normal habitual exercise, this was not monitored. Whilst our 28
participants were classed as active, none of them were attaining the 150 minutes per week (self-29
reported) that is nationally recommended (NHS, 2017). Therefore, even though it might be 30
supposed that greater improvements may have been gained in more sedentary or diseased 31
individuals, it is important to ascertain the degree of improvement that a healthy adult can 32
obtain, since 33% of men are still not meeting the current recommended physical activity 33
guidelines (British Heart Foundation, 2015). Although Gold standard methods were mainly 34
employed, the measurement of resting arterial diameter was used solely as a marker of vascular 35
structure; additional methods which assess functional vascular responsiveness (e.g. FMD) 36
should be included in future studies. Furthermore, heart rate was not monitored during the 37
exercise training which may have helped ensure participants were operating at the desired 38
intensity. 39
Overall, six weeks of high-intensity training is enough to stimulate an increase in VO2max and 40
a reduction in peripheral systolic pressure, but did not elicit significant structural and functional 41
14
This study intentionally used a 15-minute protocol, since “lack of time” has been deemed the 1
most cited reason for not exercising, and adopted a HIIT protocol, as opposed to a SIT protocol, 2
as this has been deemed as more applicable to the general population (Ziemann, et al. 2011). 3
However, these findings demonstrate that although 15 minutes of high-intensity exercise 3 4
times per week can improve cardiorespiratory fitness, it is not sufficient to improve cardiac 5
indices, central arterial stiffness and blood lipid profiles and subsequently chronic disease risk 6
reduction within a 6 week period. This could be a result of employing this particular time-7
efficient volume of exercise or the intensity of the work periods. Further investigation is 8
required to elicit the time course at which improvement in these indices become apparent when 9
adopting a time-efficient HIIT protocol. 10
11
References 12
Angadi SS, Mookadam F, Lee CD, Tucker WJ, Haykowsky MJ, Gaesser GA (2015) High-13
intensity interval training vs. moderate-intensity continuous exercise training in heart failure 14
with preserved ejection fraction: a pilot study. J Appl Physiol 119(6):753-8. 15
Ashor AW, Lara J, Siervo M, Celis-Morales C, Mathers JC (2014) Effects of exercise 16
modalities on arterial stiffness and wave reflection: a systematic review and meta-analysis of 17
randomized controlled trials. PLoS One 15; 9(10):e110034. 18
Astorino TA, Allen RP, Roberson DW, Jurancich M (2012) Effect of high-intensity interval 19
training on cardiovascular function, VO2max, and muscular force. J Strength Cond Res 20
26(1):138-145. 21
Astorino TA, Edmunds RM, Clark A, King L, Gallant RA, Namm S, Fischer A, Wood KM 22
(2017) High-intensity interval training increases cardiac output and VO2max. Med Sci Sports 23
Exerc 49(2):265-73. 24
Batacan RB, Duncan MJ, Dalbo VJ, Tucker PS, Fenning AS (2016) Effects of high-intensity 25
interval training on cardiometabolic health: a systematic review and meta-analysis of 26
intervention studies. Br J Sports Med 51:494-503. 27
Boutouyrie P, Bussy C, Lacolley P, Girerd X, Laloux B, Laurent S (1999) Association between 28
local pulse pressure, mean blood pressure, and large-artery remodelling. Circulation 29
100(13):1387-93. 30
British Heart Foundation (2015). Physical activity statistics 2015. IOP British Heart 31
Foundation. https://www.bhf.org.uk/publications/statistics/physical-activity-statistics-2015. 32
Accessed 28 September 2017. 33
Buchheit M, Laursen PB (2013) High-intensity interval training, solutions to the programming 34
puzzle. Sports Med 43(5):313-38. 35
Cassidy S, Thoma C, Houghton D, Trenell MI (2017) High-intensity interval training: a review 36
15
Esfandiari S, Sasson Z, Goodman JM (2014) Short-term high-intensity interval and continuous 1
moderate-intensity training improve maximal aerobic power and diastolic filling during 2
exercise. Eur J Appl Physiol 114(2):331–43. 3
Eugene M, Vandewalle H, Bertholon JF, Teillac A (1986) Arterial elasticity and physical 4
working capacity in young men. J Appl Physiol 61(5):1720-3. 5
Feske W, Finkelstein SM, Francis G, Cohn JN (1988) Arterial vascular compliance response 6
to exercise in hypertension. Biomed Sci Instrum 24:161. 7
Gebel K, Ding D, Chey T, Stamatakis E, Brown WJ, Bauman AE (2015) Effect of moderate to 8
vigorous physical activity on all-cause mortality in middle-aged and older Australians. JAMA 9
Intern Med 175(6):970-7. 10
Godin G, Desharnais R, Valois P, Lepage L, Jobin J, Bradet R (1994) Differences in perceived 11
barriers to exercise between high and low intenders: observations among different populations. 12
American Am J Health Promot 8(4):279-85. 13
Gormley SE, Swain DP, High RE, Spina RJ, Dowling EA, Kotipalli US, Gandrakota RA 14
(2008) Effect of Intensity of Aerobic Training on VO2max. Med Sci Sports Exerc 40(7):1336. 15
Goto C, Higashi Y, Kimura M, Goto C, Higashi Y, Kimura M, Noma K, Hara K, Nakagawa 16
K, Kawamura M, Chayama K, Yoshizumi M, Nara L (2003) Effect of different intensities of 17
exercise on endothelium-dependent vasodilation in humans. Role of endothelium-dependent 18
nitric oxide and oxidative stress. Circulation 108:530–535. 19
Grothues F, Smith GC, Moon JC, Bellenger NG, Collins P, Klein HU, Pennell DJ (2002) 20
Comparison of interstudy reproducibility of cardiovascular magnetic resonance with two-21
dimensional echocardiography in normal subjects and in patients with heart failure or left 22
ventricular hypertrophy. Am J Cardiol 90(1):29-34. 23
Guiraud T, Nigam A, Gremeaux V, Meyer P, Juneau M, Bosquet L (2012) High-intensity 24
interval training in cardiac rehabilitation. Sports Med 42(7):587-605. 25
Harrison DG, Widder J Grumbach I, Chen W, Weber M, Searles C (2006) Endothelial 26
mechanotransduction, nitric oxide and vascular inflammation. J. Intern. Med 259(4):351-363. 27
Heisz JJ, Tejada MGM, Paolucci EM, Muir C (2016) Enjoyment for high-intensity interval 28
exercise increases during the first six weeks of training: implications for promoting exercise 29
adherence in sedentary adults. PloS one, 11(12), p.e0168534. 30
Helgerud J, Høydal K, Wang E, Karlsen T, Berg P, Bjerkaas M, Simonsen T, Helgesen C, 31
Hjorth N, Bach R, Hoff J (2007) Aerobic high-intensity intervals improve VO2max more than 32
moderate training. Med Sci Sports Exerc 39(4):665-71. 33
Heydari M, Boutcher YN, Boutcher SH (2013) High-intensity intermittent exercise and 34
16
Houmard JA, Tanner CJ, Slentz CA, Duscha BD, McCartney JS, Kraus WE (2004) Effect of 1
the volume and intensity of exercise training on insulin sensitivity. J Appl Physiol 96(1):101-2
6. 3
Jankowski P, Kawecka-Jaszcz K, Czarnecka D, Brzozowska-Kiszka M, Styczkiewicz K, 4
Loster M, Kloch-Badełek M, Wiliński J, Curyło AM, Dudek D (2008) Pulsatile but not steady 5
component of blood pressure predicts cardiovascular events in coronary patients. Hyperten 6
51(4):848-55. 7
Jung ME, Bourne JE, Beauchamp MR, Robinson E. Little JP (2015) High-intensity interval 8
training as an efficacious alternative to moderate-intensity continuous training for adults with 9
prediabetes. J Diabetes Res 2015. 10
Kaminsky LA, Arena R, Beckie TM, Brubaker PH, Church TS, Forman DE, Franklin BA, 11
Gulati M, Lavie CJ, Myers J, Patel MJ (2013) The Importance of Cardiorespiratory Fitness in 12
the United States: The Need for a National Registry. Circulation 127(5):652-62. 13
Karlsen T, Aamot II, Haykowsky M, Rognmo Ø (2017) High Intensity interval training for 14
maximizing health outcomes. Prog Cardiovasc Dis 60: 67–77. 15
Kemi OJ, Haram PM, Loennechen JP, Osnes JB, Skomedal T, Wisløff U, Ellingsen Ø (2005) 16
Moderate vs. high exercise intensity: differential effects on aerobic fitness, cardiomyocyte 17
contractility, and endothelial function. Cardiovasc Res 67(1):161-72. 18
Kraus WE, Houmard JA, Duscha BD, Knetzger KJ, Wharton MB, McCartney JS, Bales CW, 19
Henes S, Samsa GP, Otvos JD, Kulkarni KR (2002) Effects of the amount and intensity of 20
exercise on plasma lipoproteins. N Engl J Med 347(19):1483-92. 21
Lamb MJ, Westgate K, Brage S, Ekelund U, Long GH, Griffin SJ, Simmons RK, Cooper AJ 22
(2016) Prospective associations between sedentary time, physical activity, fitness and 23
cardiometabolic risk factors in people with type 2 diabetes. Diabetologia 59(1):110-20. 24
Lang RM, Badano LP, Mor-Avi V, Afilalo J, Armstrong A, Ernande L, Flachskampf FA, 25
Foster E, Goldstein SA, Kuznetsova T, Lancellotti P (2015) Recommendations for cardiac 26
chamber quantification by echocardiography in adults: an update from the American Society 27
of Echocardiography and the European Association of Cardiovascular Imaging. Eur Heart J 28
Cardiovasc Imaging 16(3):233-71. 29
Leon AS, Richardson M (1997) Exercise, health, and disease. In Roberts SO, Robergs RA, 30
Hanson P (ed) Clinical Exercise Testing and Prescription. Theory and Application, 1st edn. 31
CRC Press Inc, Boca Raton, FL, pp 281-302. 32
Macpherson RE, Hazell TJ, Olver TD, Paterson DH, Lemon PW (2011) Run sprint interval 33
training improves aerobic performance but not maximal cardiac output. Med Sci Sports Exerc 34
17
MRC Cognition and Brain Sciences Unit (2009) Rules of thumb on magnitudes of effect sizes. 1
IOP MRC Cognition and Brain Sciences Unit. http://imaging.mrc-2
cbu.cam.ac.uk/statswiki/FAQ/effectSize. Accessed 17 May 2017. 3
NHS (2017) Physical activity guidelines for adults. IOP NHS Choices. 4
https://www.nhs.uk/Livewell/fitness/Pages/physical-activity-guidelines-for-adults.aspx. 5
Accessed 26 September 2017. 6
Nybo L, Sundstrup E, Jakobsen MD, Mohr M, Hornstrup T, Simonsen L, Bülow J, Randers 7
MB, Nielsen JJ, Aagaard P, Krustrup P (2010) High-intensity training versus traditional 8
exercise interventions for promoting health. Med Sci Sports Exerc 42(10):1951-8. 9
Padilla J, Harris RA, Rink LD, Wallace JP (2008) Characterization of the brachial artery shear 10
stress following walking exercise. Vas Med 13(2):105-11. 11
Pini R, Cavallini MC, Palmieri V, Marchionni N, Di Bari M, Devereux RB, Masotti G, Roman 12
MJ (2008) Central but not brachial blood pressure predicts cardiovascular events in an 13
unselected geriatric population: the ICARe Dicomano Study. J Am Coll Cardiol 51(25):2432-14
9. 15
Roman MJ, Devereux RB, Kizer JR, Lee ET, Galloway JM, Ali T, Umans JG, Howard BV 16
(2007) Central pressure more strongly relates to vascular disease and outcome than does 17
brachial pressure. Hyperten 50(1):197-203. 18
Smulyan H, Siddiqui DS, Carlson RJ, London GM, Safar ME (2003) Clinical utility of aortic 19
pulses and pressures calculated from applanated radial-artery pulses. Hyperten 42(2):150-20
155. 21
Tanaka H, Shimizu S, Ohmori F, Muraoka Y, Kumagai M, Yoshizawa M, Kagaya A (2006) 22
Increases in blood flow and shear stress to nonworking limbs during incremental exercise. Med 23
Sci Sports Exerc 38(1):81-5. 24
Tarnawski M, Cybulski G, Doorly D, Dumoulin C, Darrow R, Caro C (1994) Noninvasive 25
determination of local wave speed and distensibility of the femoral artery by comb-excited 26
Fourier velocity-encoded magnetic resonance imaging: measurements on athletic and 27
nonathletic human subjects. Heart Vessels 9(4):194-201. 28
Thijssen DH, Dawson EA, Black MA, Hopman MT, Cable NT, Green DJ (2009) Brachial 29
artery blood flow responses to different modalities of lower limb exercise. Med Sci Sports 30
Exerc 41(5):1072-9. 31
Tschakert G, Hofmann P (2013) High-intensity intermittent exercise: methodological and 32
physiological aspects. Int J Sports Physiol Perform 8(6):600-10. 33
Van Bortel LM, Laurent S, Boutouyrie P, Chowienczyk P, Cruickshank JK, De Backer T, 34
Filipovsky J, Huybrechts S, Mattace-Raso FU, Protogerou AD, Schillaci G (2012) Expert 35
consensus document on the measurement of aortic stiffness in daily practice using carotid-36
18
Wen CP, Wai JP, Tsai MK, Yang YC, Cheng TY, Lee MC, Chan HT, Tsao CK, Tsai SP, Wu 1
X (2011) Minimum amount of physical activity for reduced mortality and extended life 2
expectancy: a prospective cohort study. Lancet 378(9798):1244-53. 3
Weston KS, Wisløff U, Coombes JS (2014) High-intensity interval training in patients with 4
lifestyle-induced cardiometabolic disease: a systematic review and meta-analysis. Br J Sports 5
Med 48(16):1227-34. 6
Wilkinson IB, Fuchs SA, Jansen IM, Spratt JC, Murray GD, Cockcroft JR, Webb DJ (1998) 7
Reproducibility of pulse wave velocity and augmentation index measured by pulse wave 8
analysis. J Hypertens 16(12):2079-84. 9
Wilkinson IB, Prasad K, Hall IR, Thomas A, MacCallum H, Webb DJ, Frenneaux MP, 10
Cockcroft JR (2002) Increased central pulse pressure and augmentation index in subjects with 11
hypercholesterolemia. J Am Coll Cardiol 39(6):1005-11. 12
Wilson MG, Ellison GM, Cable NT (2015) Basic science behind the cardiovascular benefits of 13
exercise. Heart 101(10):758-65. 14
Wood KM, Olive B, LaValle K, Thompson H, Greer K, Astorino TA (2016) Dissimilar 15
physiological and perceptual responses between sprint interval training and high-intensity 16
interval training. J Strength Cond Res 30(1):244-50. 17
Ziemann E, Grzywacz T, Luszczyk M, Laskowski R, Olek RA, Gibson AL (2011) Aerobic and 18
anaerobic changes with high-intensity interval training in active college-aged men. J Strength 19
Cond Res 25(4):1104-12. 20
19
Table 1: Cardiometabolic and vascular indices before, mid-point and after the 6-week intervention period for the training group and control. Training group (n=12) Control group (n=9)
0 weeks 3 weeks 6 weeks 0 weeks 3 weeks 6 weeks
VO2max (mL·kg-1·min-1) 42.5 ± 8.3 44.3 ± 7.3 47.4 ± 8.5 * 37.7 ± 8.3 40.5 ± 8.7 40.0 ± 8.4 VO2max (L·min-1) 3.1 ± 0.6 3.2 ± 0.6 3.4 ± 0.6 2.7 ± 0.7 3.0 ± 0.6 2.8 ± 0.7 Clustered risk score -0.07 ± 0.57 -0.04 ± 0.89 -0.02 ± 0.88 -0.01 ± 0.32 0.05 ± 0.30 -0.03 ± 0.24
SBP (mmHg) 126 ± 8 120 ± 7 116 ± 8* 116 ± 7 125 ± 10 119 ± 8
DBP (mmHg) 70 ± 5 66 ± 8 65 ± 10 64 ± 8 65 ± 11 65 ± 7
DP (mmHg) 70 ± 6 67 ± 7 66 ± 9 64 ± 7 69 ± 8 68 ± 6
MAP (mmHg) 85 ± 6 80 ± 7 78 ± 8 77 ± 8 83 ± 9 80 ± 4
SP (mmHg) 109 ± 6 104 ± 6 102 ± 8 101 ± 8 106 ± 10 102 ± 6
PP (mmHg) 39 ± 6 37 ± 4 36 ± 6* 36 ± 5 37 ± 6 34 ± 7*
AP (mmHg) 4 ± 3 3 ± 4 4 ± 3 2 ± 3 1 ± 5 1 ± 5
Alx (%) 9 ± 8 8 ± 10 13 ± 9 7 ± 9 1 ± 13 4 ± 11
PWV (ms) 6 ± 1 5 ± 1 5 ± 1 5 ± 1 5 ± 1 5 ± 1
Brachial diameter (cm) 0.41 ± 0.05 0.44 ± 0.06 0.43 ± 0.04 0.42 ± 0.03 0.44 ± 0.06 0.43 ± 0.03 Femoral diameter (cm) 0.67 ± 0.06 0.70 ± 0.06 0.70 ± 0.05 0.65 ± 0.05 0.65 ± 0.05 0.63 ± 0.05
20
Table 2: Cardiac indices before, mid-point and after the 6-week intervention period for the training group and control.
Training group (n=12) Control group (n=9)
0 weeks 3 weeks 6 weeks 0 weeks 3 weeks 6 weeks
IVSd (mm) 9.4 ± 1.4 8.9 ± 1.4 9.3 ± 1.3 8.0 ± 0.8 8.0 ± 1.1 8.3 ± 0.8
LVPWd (mm) 9.5 ± 0.9 9.3 ± 1.5 9.7 ± 1.3 9.5 ± 0.9 9.4 ± 1.1 9.9 ± 0.8
LVEDV (ml) 122.2 ± 17.2 118.4 ± 16.9 126.7 ± 12.7 120.2 ± 16.4 131.9 ± 16.9 122.1 ± 22.9 LVESV (ml) 47.8 ± 10.7 52.1 ± 11.1 51.5 ± 6.5* 48.6 ± 6.2 58.8 ± 8.6 55.8 ± 11.2*
SV (ml) 74.6 ± 12.8 66.3 ± 7.3 75.1 ± 9.9 71.6 ± 12.4 73.0 ± 9.8 66.2 ± 12.2
EF (%) 61.0 ± 6.5 56.3 ± 4.5 59.1 ± 4.0* 59.4 ± 3.8 55.4 ± 3.1 54.3 ± 2.1*
E (cm·s) 0.81 ± 0.07 0.84 ± 0.10 0.80 ± 0.10† 0.72 ± 0.04 0.74 ± 0.08 0.70 ± 0.10 A (cm·s) 0.46 ± 0.08 0.45 ± 0.08 0.4 ± 0.10 0.41 ± 0.06 0.40 ± 0.05 0.40 ± 0.10
E:A 1.82 ± 0.39 1.95 ± 0.49 2.07 ± 0.41 1.84 ± 0.33 1.91 ± 0.14 1.77 ± 0.15
E’ (cm·s) 0.14 ± 0.02 0.14 ± 0.02 0.14 ± 0.02 0.16 ± 0.03 0.15 ± 0.03 0.14 ± 0.02 A’ (cm·s) 0.08 ± 0.02 0.08 ± 0.02 0.07 ± 0.01 0.09 ± 0.04 0.08 ± 0.03 0.07 ± 0.01 S’ (cm·s) 0.09 ± 0.02 0.10 ± 0.02 0.09 ± 0.02 0.10 ± 0.03 0.13 ± 0.07 0.08 ± 0.01