Harpenden, Herts, AL5 2JQ Telephone: +44 (0)1582 763133 Web: http://www.rothamsted.ac.uk/
Rothamsted Research is a Company Limited by Guarantee
Rothamsted Repository Download
A - Papers appearing in refereed journals
Cardenas, L. M., Bol, R., Lewicka-Szczebak, D., Gregory, A. S.,
Matthews, G. P., Whalley, W. R., Misselbrook, T. H., Scholefield, D. and
Well, R. 2017. Effect of soil saturation on denitrification in a grassland
soil. Biogeosciences. 14 (20), pp. 4691-4710.
The publisher's version can be accessed at:
•
https://dx.doi.org/10.5194/bg-14-4691-2017
The output can be accessed at:
https://repository.rothamsted.ac.uk/item/8v58w/effect-of-soil-saturation-on-denitrification-in-a-grassland-soil
.
© 23 October 2017, Please contact [email protected] for copyright queries.
https://doi.org/10.5194/bg-14-4691-2017 © Author(s) 2017. This work is distributed under the Creative Commons Attribution 3.0 License.
Effect of soil saturation on denitrification in a grassland soil
Laura Maritza Cardenas1, Roland Bol2, Dominika Lewicka-Szczebak3, Andrew Stuart Gregory4,
Graham Peter Matthews5, William Richard Whalley4, Thomas Henry Misselbrook1, David Scholefield1, and Reinhard Well3
1Rothamsted Research, North Wyke, Okehampton, Devon EX20 2SB, UK
2Institute of Bio- and Geosciences, IBG-3/Agrosphere, Forschungszentrum Jülich GmbH, 52428 Jülich, Germany
3Thünen Institute of Climate-Smart Agriculture, Federal Research Institute for Rural Areas, Forestry and Fisheries,
Bundesallee, 50, 38116 Braunschweig, Germany
4Rothamsted Research, Harpenden, Hertfordshire AL5 2JQ, UK
5University of Plymouth, Drake Circus, Plymouth, Devon PL4 8AA, UK
Correspondence to:Laura Maritza Cardenas ([email protected])
Received: 22 December 2016 – Discussion started: 30 January 2017 Revised: 6 July 2017 – Accepted: 7 July 2017 – Published: 23 October 2017
Abstract. Nitrous oxide (N2O) is of major importance as a
greenhouse gas and precursor of ozone (O3)destruction in
the stratosphere mostly produced in soils. The soil-emitted N2O is generally predominantly derived from denitrification
and, to a smaller extent, nitrification, both processes con-trolled by environmental factors and their interactions, and are influenced by agricultural management. Soil water con-tent expressed as water-filled pore space (WFPS) is a ma-jor controlling factor of emissions and its interaction with compaction, has not been studied at the micropore scale. A laboratory incubation was carried out at different saturation levels for a grassland soil and emissions of N2O and N2were
measured as well as the isotopocules of N2O. We found that
flux variability was larger in the less saturated soils proba-bly due to nutrient distribution heterogeneity created from soil cracks and consequently nutrient hot spots. The results agreed with denitrification as the main source of fluxes at the highest saturations, but nitrification could have occurred at the lower saturation, even though moisture was still high (71 % WFSP). The isotopocules data indicated isotopic sim-ilarities in the wettest treatments vs. the two drier ones. The results agreed with previous findings where it is clear there are two N pools with different dynamics: added N produc-ing intense denitrification vs. soil N resultproduc-ing in less isotopic fractionation.
1 Introduction
Nitrous oxide (N2O) is of major importance as a greenhouse
gas and precursor of ozone (O3) destruction in the
strato-sphere (Crutzen, 1970). Agriculture is a major source of greenhouse gases (GHGs), such as carbon dioxide (CO2),
methane (CH4) and also N2O (IPCC, 2006). The
applica-tion of organic and inorganic fertiliser N to agricultural soils enhances the production of N2O (Baggs et al., 2000). This
soil-emitted N2O is predominantly derived from
denitrifica-tion and to a smaller extent, nitrificadenitrifica-tion in soils (Davidson and Verchot, 2000). Denitrification is a microbial process in which reduction of nitrate (NO−3)occurs to produce N2O,
and N2is the final product of this process, benign for the
en-vironment, but represents a loss of N in agricultural systems. Nitrification is an oxidative process in which ammonium (NH+4)is converted to NO−3 (Davidson and Verchot, 2000). Both processes are controlled by environmental factors and their interactions, and are influenced by agricultural manage-ment (Firestone and Davidson, 1989). It is well recognised that soil water content expressed as water-filled pore space (WFPS) is a major controlling factor, and as Davidson (1991) illustrated, nitrification is a source of N2O until WFPS
Davidson also suggested that at WFPS values above 90 % only N2 is produced. Several studies have later proposed
models to relate WFPS with emissions (Schmidt et al., 2000; Dobbie and Smith, 2001; Parton et al., 2001; del Prado et al., 2006; Castellano et al., 2010) but the “optimum” WFPS for N2O emissions varies from soil to soil (Davidson, 1991).
Soil structure could be influencing this effect and it has been identified to strongly interact with soil moisture (Ball et al., 1999; van Groenigen et al., 2005) through changes in WFPS. Particularly soil compaction due to livestock treading and the use of heavy machinery affect soil structure and emissions as reported by studies relating bulk density to fluxes (Klefoth et al., 2014) and degrees of tillage to emissions (Ludwig et al., 2011).
Compaction is known to affect the size of the larger pores (macropores) thereby reducing the soil air volume and there-fore increasing the WFPS (for the same moisture content) (van der Weerden et al., 2012). However, little is known about the effect of compaction on the smaller soil pores (mi-cropores), and this could provide valuable information for understanding the simultaneous behaviour of the dynamics of water in the various pore sizes in soil. Such an understand-ing would lead to the development of better N2O mitigation
strategies via dealing with soil compaction issues.
The role of water in soils is closely linked to microbial activity but also relates to the degree of aeration and gas diffusivity in soils (Morley and Baggs, 2010). Water facili-tates nutrient supply to microbes and restricts gas diffusion, thereby increasing the residence time of gases in soil, and the chance of further N2O reduction before it can be released
to the atmosphere. This is further aided by the restriction of the diffusion of atmospheric O2(Dobbie and Smith, 2001),
increasing the potential for denitrification. In consequence, counteracting effects (high microbial activity vs. low diffu-sion) occur simultaneously, making it difficult to predict net processes and corresponding outputs (Davidson, 1991). De-tailed understanding of the sources of N2O and the influence
of physical factors, i.e. soil structure and its interaction with moisture, is a powerful basis for developing effective mitiga-tion strategies.
Isotopocules of N2O represent the isotopic substitution of
the O and/or the two N atoms within the N2O molecule.
The isotopomers of N2O, are those differing in the
periph-eral (β)and central N positions (α)of the linear molecule (Toyoda and Yoshida, 1999) with the intramolecular15N site preference (SP; the difference between δ15Nα andδ15Nβ) used to identify production processes at the level of mi-crobial species or enzymes involved (Toyoda et al., 2005; Ostrom and Ostrom, 2011). Moreover, δ18O,δ15N and SP of emitted N2O depend on the denitrification product ratio
(N2O/(N2+N2O)) and hence provide insight into the
dy-namics of N2O reduction (Well and Flessa, 2009;
Lewicka-Szczebak et al., 2014, 2015). Koster et al. (2013), for ex-ample, recently reported δ15Nbulk values of N2O between
−36.8 and −31.9 ‰ under the conditions of their
exper-iment, which are indicative of denitrification according to Perez et al. (2006) and Well and Flessa (2009), who proposed the range −54 to −10 ‰ relative to the substrate. Baggs (2008) summarised that values between−90 and−40 ‰ are indicative of nitrification. Determination of these values is normally carried out in pure culture studies or in conditions favouring either production or reduction of N2O (Well and
Flessa, 2009). The SP is, however, considered a better pre-dictor of the N2O source due to its independence from the
substrate signature (Ostrom and Ostrom, 2011).
Simultaneous occurrence, production and reduction of N2O as in natural conditions present a challenge for isotopic
factors determination due to uncertainty on N2O reduction
and the co-existence of different microbial communities pro-ducing N2O (Lewicka-Szczebak et al., 2014). Recently,
us-ing data from the experiment reported here, where soil was incubated under aerobic atmosphere and the complete den-itrification process occurs, Lewicka-Szczebak et al. (2015) determined fractionation factors associated with N2O
pro-duction and repro-duction using a modelling approach. The anal-ysis comprised measurements of the N2O and N2fluxes
com-bined with isotopocule data. Net isotope effects (ηvalues) are variable to a certain extent as they result from a com-bination of several processes causing isotopic fractionation (Well et al., 2012). The results generally confirmed the range of values ofη (net isotope effects) and η18O/ η15N ratios reported by previous studies for N2O reduction for that part
of the soil volume were denitrification was enhanced by the N+C amendment. This did not apply for the other part of the soil volume not reached by the N+C amendment, show-ing that the validity of published net isotope effects for soil conditions with low denitrification activity still needs to be evaluated.
Lewicka-Szczebak et al. (2015) observed a clear re-lationship between 15N and 18O isotope effects during N2O production and denitrification rates. For N2O
reduc-tion, differential isotope effects were observed for two dis-tinct soil pools characterised by different product ratios N2O/(N2+N2O). For moderate product ratios (from 0.1 to
1.0) the range of isotope effects given by previous studies was confirmed and refined, whereas for very low product ra-tios (below 0.1) the net isotope effects were much smaller. In this paper, we present the results from the gas emissions measurements from soils collected from a long-term perma-nent grassland soil to assess the impact of different levels of soil saturation on N2O and N2 and CO2 emissions after
compaction. CO2 emissions were measured in addition as
an estimate of aerobic respiration and thus of O2
consump-tion, which indicates denitrification is promoted. The mea-surements included the soil isotopomer (15Nα,15Nβ and site preference) analysis of emitted N2O, which in combination
with the bulk15N and18O was used to distinguish between N2O from bacterial denitrification and other processes (e.g.
We conducted measurements at defined saturation of pores size fractions as a prerequisite to model denitrification as a function of water status (Butterbach Bahl et al., 2013; Müller and Clough, 2014). We have under controlled conditions cre-ated a single compaction stress of 200 kPa (typical of soils compacted after grazing) in incremental layers using a uni-axial pneumatic piston to simulate a grazing pressure. We hy-pothesised that at high water saturation, spatial heterogeneity of N emissions decreases due to more homogeneous distri-bution of the soil nutrients and/or anaerobic microsites. We also hypothesised that even at high soil moisture a mixture of nitrification and denitrification can occur. We base this on the creation of pockets of aerobicity as well of anaerobic-ity at high soil moisture, mainly driven by soil respiration after application of N and C (using up O2)and further
re-covery after nutrients are used becoming limiting (increasing aeration). We also aimed to assess how these effects (spatial heterogeneity and source processes) occur in a relatively nar-row range of moisture (70–100 %). As far as we know there no other studies going to this level of detail. They mostly rely on the knowledge of the effect of moisture on soil pro-cesses, whilst in our study we combined direct measurements of both N2O and N2with isotopomers of N2O to verify the
source processes. In addition, the packing of the cores in our study was of great precision, increasing our potential to achieve reproducibility in the replicates where a mixture of aerobic/anaerobic pores might have occurred. We aimed to understand changes in the ratio N2O/(N2O+N2)at the
different moisture levels studied in a controlled manner on soil micro- and macropores. The N2emissions were based
on direct measurements from the incubated soils, avoiding methodologies that rely on inhibitors such as acetylene with limitations in diffusion in soil and causing oxidation of NO (Nadeem et al., 2013). Moreover, we used isotopocule val-ues of N2O to evaluate whether the contribution of bacterial
denitrification to the total N2O flux was affected by moisture
status.
2 Materials and methods
2.1 Soil used in the study
An agricultural soil, under grassland management since at least 1838 (Barré et al., 2010), was collected from a location adjacent to a long-term ley-arable experiment at Rotham-sted Research in Hertfordshire (Highfield; see soil proper-ties in Table 1 and further details in Rothamsted Research, 2006; Gregory et al., 2010). The mixed sward is dominated byLoliumandTrifoliumspecies and is cut two–three times a year. The soil was sampled as described in Gregory et al. (2010). Briefly, it was sampled from the upper 150 mm of the profile, air-dried in the laboratory, crumbled and sieved (<4 mm), mixed to make a bulk sample, and equilibrated at
a pre-determined water content (37 g 100 g−1; Gregory et al., 2010) in airtight containers at 4◦C for at least 48 h.
2.2 Preparation of soil blocks
The equilibrated soil was then packed into 12 stainless-steel blocks (145 mm diameter; h: 100 mm), each of which con-tained three cylindrical holes (i.d: 50 mm; h: 100 mm each). The cores were packed to a single compaction stress of 200 kPa in incremental layers using a uniaxial pneumatic pis-ton. The three hole blocks were used to facilitate the com-pression of the cores. The 200 kPa stress was analogous to a severe compaction event by a tractor (Gregory et al., 2010) or livestock (Scholefield et al., 1985). The total area of the upper surface of soil in each block was therefore 58.9 cm2 (3×19.6 cm2)and the target volume of soil was set to be 544.28 cm3 (3×181.43 cm3) with the objective of leaving a headspace of approximately 45 cm3 (3×15 cm3) for the subsequent experiment. The precise height of the soil (and hence the volume) was measured using the displacement measurement system of a DN10 Test Frame (Davenport-Nene, Wigston, Leicester, UK) with a precision of 0.001 mm.
2.3 Equilibration of soil cores at different saturations
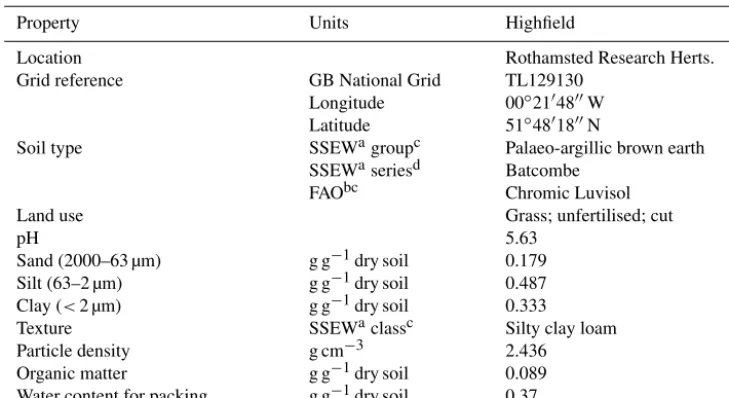
Table 1.Highfield soil properties.
Property Units Highfield
Location Grid reference
Soil type
Land use pH
Sand (2000–63 µm) Silt (63–2 µm)
Clay (<2 µm)
Texture Particle density Organic matter
Water content for packing
GB National Grid Longitude Latitude
SSEWagroupc
SSEWaseriesd
FAObc
g g−1dry soil
g g−1dry soil
g g−1dry soil
SSEWaclassc
g cm−3
g g−1dry soil
g g−1dry soil
Rothamsted Research Herts. TL129130
00◦2104800W
51◦4801800N
Palaeo-argillic brown earth Batcombe
Chromic Luvisol Grass; unfertilised; cut 5.63
0.179 0.487 0.333
Silty clay loam 2.436
0.089 0.37
aSoil Survey of England and Wales classification system.bUnited Nations Food and Agriculture Organization World Reference
Base for Soil Resources classification system (approximation).cAvery (1980).dClayden and Hollis (1984).
by either lowering the water level in the reservoir (sand ta-bles and tension plate) or by increasing the air pressure (pres-sure chambers). At the end of equilibration period, the blocks were removed carefully from the apparatus, wrapped in air-tight film, and maintained at 4◦C until the subsequent incu-bation.
2.4 Incubation
The study was carried out under controlled laboratory condi-tions, using a specialised laboratory denitrification (DENIS) incubation system (Cardenas et al., 2003). Each block con-taining three cores was placed in an individual incubation vessel of the automated laboratory system in a randomised block design to avoid effect of vessel. The lids for the vessels containing three holes were lined with the cores in the block to ensure that the solution to be applied later would fall on top of each soil core. Stainless steel bulkheads fitted (size for 1/4 in. tubing) on the lids had a three-layered Teflon coated silicone septum (4 mm thick×7 mm diameter) for supply-ing the amendment solution by ussupply-ing a gas tight hypodermic syringe. The bulkheads were covered with a stainless-steel nut and only open when amendment was applied. The in-cubation experiment lasted 13 days from the time the cores started to be flushed until the end of the incubation. The incu-bation vessels with the soils were contained in a temperature controlled cabinet and the temperature set at 20◦C. The in-cubation vessels were flushed from the bottom at a rate of 30 mL min−1 with a He/O2 mixture (21 % O2, natural
at-mospheric concentration) for 24 h, or until the system and the soil atmosphere were emitting low background levels of both N2 and N2O (N2can get down to levels of 280 ppm much
smaller than atmospheric values). Subsequently, the He/O2
supply was reduced to 10 mL min−1and directed across the soil surface and measurements of N2O and N2 carried out
at approximately 2-hourly cycles to sample from all the 12 vessels. Emissions of CO2were simultaneously measured.
2.5 Application of amendment
An amendment solution equivalent to 75 kg N ha−1 and 400 kg C ha−1was applied as a 5 mL aliquot a solution con-taining KNO3and glucose to each of the three cores in each
vessel on day 0 of the incubation. Glucose is added to op-timise conditions for denitrification to occur (Morley and Baggs, 2010). The aliquot was placed in a stainless-steel con-tainer (volume 1.2 L) which had three holes drilled with bulk-heads fitted: two to connect stainless-steel tubing for flushing the vessel and the third one to place a septum on a bulkhead to withdraw solution. Flushing was carried out with He for half an hour before the solution was required for application to the soil cores and continued during the application process to avoid atmospheric N2contamination (a total of 1.5 h). The
amendment solution was manually withdrawn from the con-tainer with a glass syringe fitted with a three-way valve onto the soil surface; care was taken to minimise contamination from atmospheric N2entering the system. The syringe
con-tent was injected to the soil cores via the inlets on the lids consecutively in each lid (three cores) and all vessels, com-pleting a total of 36 applications that lasted about 45 min. Incubation continued for 12 days, and the evolution of N2O,
N2and CO2was measured continuously. At the end of each
taken and analysed for mineral N, total N and C, and mois-ture status.
2.6 Gas measurements
Gas samples were directed to the relevant analysers via an automated injection valve fitted with two loops to direct the sample to two gas chromatographs. Emissions of N2O
and CO2were measured by gas chromatographs (GCs),
fit-ted with an electron capture detector (ECD) and separation achieved by a stainless-steel packed column (2 m long, 4 mm bore) filled with “Porapak Q” (80–100 mesh) and using N2
as the carrier gas. The detection limit for N2O was
equiva-lent to 2.3 g N ha−1d−1. The N2was measured by GC with
a He ionisation detector (HID) and separation was achieved by a PLOT column (30 m long 0.53 mm i.d.), with He as the carrier gas. The detection limit was 9.6 g N ha−1d−1. The re-sponse of the two GCs was assessed by measuring a range of concentrations for N2O, CO2 and N2. Parent standards
of the mixtures 10 133 ppm N2O+1015.8 ppm N2, 501 ppm
N2O+253 ppm N2, and 49.5 ppm N2O + 100.6 ppm N2
were diluted by means of mass flow controllers with He to give a range of concentrations of up to 750 ppm for N2O and
1015 ppm for N2. For CO2, a parent standard of 30 100 ppm
was diluted down to 1136 ppm (all standards were in He as the balance gas). Daily calibrations were carried out for N2O
and N2by using the low standard and doing repeated
mea-surements. The temperature inside the refrigeration cabinet containing the incubation vessels was logged on an hourly basis and checked at the end of the incubation. The gas out-flow rates were also measured and recorded daily, and subse-quently used to calculate the flux.
2.7 Measurement of N2O isotopic signatures
Gas samples for isotopocule analysis were collected in 115 mL serum bottles sealed with grey butyl crimp-cap septa (part no. 611012, Altmann, Holzkirchen, Germany). The bot-tles were connected by a Teflon tube to the end of the cham-ber vents and were vented to the atmosphere through a nee-dle in order to maintain flow through the experimental sys-tem. Dual isotope and isotopocule signatures of N2O, i.e.
δ18O of N2O (δ18O-N2O), averageδ15N (δ15Nbulk)andδ15N
from the central N position (δ15Nα)were analysed after cryo-focussing by isotope ratio mass spectrometry as described previously (Well et al., 2008).15N site preference (SP) was obtained as SP=2×(δ15Nα –δ15Nbulk). Dual isotope and isotopocule ratios of a sample (Rsample)were expressed as
per mille deviation from15N/14N and18O/16O ratios of the reference standard materials (Rstd), atmospheric N2and
stan-dard mean ocean water (SMOW), respectively:
δX=(Rsample/Rstd−1)×1000, (1)
whereX=15Nbulk,15Nα,15Nβ, or18O.
2.8 Data analysis and additional measurements undertaken
The areas under the curves for the N2O, CO2 and N2 data
were calculated by using GenStat 11 (VSN International Ltd, Hemel Hempstead, Herts, UK). The resulting areas for the different treatments were analysed by applying analy-sis of variance (ANOVA). The isotopic (15Nbulk,18O), and site preference (SP) differences between the four treatment for the different sampling dates were analysed by two-way ANOVA. We also used the Student’s t test to check for changes in soil water content over the course of the exper-iments.
Calculation of the relative contribution of the N2O derived
from bacterial denitrification (%BDEN) was done
accord-ing to Lewicka-Szczebak et al. (2015). The isotopic value of initially produced N2O, i.e. prior to its partial reduction
(δ0), was determined using a Rayleigh model (Mariotti et al.,
1982), wereδ0is calculated using the fractionation factor of
N2O reduction (ηN2O−N2)for SP and the fraction of residual N2O (rN2O)which is equal to the N2O/(N2+N2O) prod-uct ratio obtained from direct measurements of N2and N2O
flux. An endmember mixing model was then used to calcu-late the percentage of bacterial N2O in the total N2O flux
(%BDEN)from calculatedδ0values and the SP andδ18O
end-member values of bacterial denitrification and fungal denitri-fication/nitrification. The range in endmember andηN2O−N2 values assumed (adopted from Lewicka-Szczebak, 2017) to calculated maximum and minimum estimates of %BDEN is
given in Table 4. We also fitted three functions through these data (SP vs. N2O/(N2+N2O)) including a second-degree
polynomial and a linear and logarithmic function.
Because both, endmember values andηN2O−N2 values are not constant but subject to the given ranges, we calculated here several scenarios using combinations of maximum, min-imum and average endmember andηN2O−N2values (Table 4) to illustrate the possible range of %BDEN for each sample.
For occasional cases where %BDEN>100 % the values were
set to 100 %.
3 Results
3.1 Soil composition
The results after moisture adjustment at the start of the ex-periment resulted in a range of WFPS of 100 to 71 % for the four treatments (Table 2). The results from the end of the incubation also confirmed that there remained signifi-cant differences in soil moisture between the high-moisture treatments (SAT/sat and HALFSAT/sat) and the two lower-moisture treatments (Table 3; one-way ANOVA,p <0.05). Soils in the two wettest states lost statistically significant amounts of water (10 % (p=0.006) and 4.4 % (p <0.001) for SAT/sat and HALFSAT/sat, respectively) over the course of the 13-day incubation experiment. This was inevitable as there was no way to hold a high (near-saturation) matric po-tential once the soil was inside the DENIS assembly, and wa-ter would have begun to drain by gravitational forces out of the largest macropores (>30 µm). An additional factor was the continuous He/O2 delivery over the soil surface
which would have caused some drying. We accepted these as unavoidable features of the experimental set-up, but we assume that the main response of the gaseous emissions oc-curred under the initial conditions, prior to the loss of water over subsequent days. Soil in the two drier conditions had no significant change in their water content over the experi-mental period (p=0.153 and 0.051 for UNSAT/sat and UN-SAT/halfsat, respectively). The results of the initial soil com-position for mineral N were 85.5 mg NO−3-N kg−1dry soil and 136.2 mg NH+4-N kg−1dry soil. The mineral N contents of the soils at the end of the incubation are reported in Table 3, showing that NO−3 was very low in treatments SAT/sat and HALFSAT/sat (∼1 mg N kg−1dry soil) compared to UN-SAT/sat and UNSAT/halfsat (50–100 mg N kg−1dry soil) at the end of the incubation. Therefore, there was a signif-icant difference in soil NO−3 between the former high-moisture treatments and the latter drier (UNSAT) treat-ments, which were also significantly different between them-selves (p <0.001 for both). The NH+4 content was sim-ilar in treatments SAT/sat, HALFSAT/sat and UNSAT/sat (∼100 mg N kg−1dry soil), but slightly lower in treatment UNSAT/halfsat (71.3 mg N kg−1dry soil); however, overall differences were not significant, probably due to the large variability on the driest treatment (p >0.05).
3.2 Gaseous emissions of N2O, CO2and N2
All datasets of N2O and N2emissions showed normal
dis-tribution (Fpr.<0.001). The treatments SAT/sat and HALF-SAT/sat for all three gases (N2O, CO2and N2) showed fluxes
that were well replicated for all the vessels (see Fig. 1); in contrast, for UNSAT/sat and UNSAT/halfsat the emissions between the various replicated vessel in each treatment was not as consistent, leading to a larger within-treatment vari-ability in the magnitude and shape of the GHG fluxes
mea-sured. The cumulative fluxes also resulted in larger variabil-ity for the drier treatments (Table 3).
3.2.1 Nitrous oxide and nitrogen gas
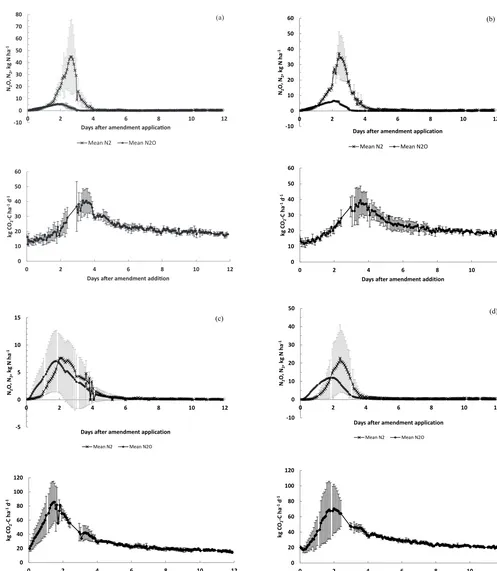
The general trend was that the N2O concentrations in the
headspace increased shortly after the application of the amendment (Fig. 1). The duration of the N2O peak for each
replicate soil samples was about 3 days, except for UN-SAT/halfsat, in which one of the replicate soils exhibits a peak which lasted for about 5 days. The N2O maximum
in the SAT/sat and HALFSAT/sat treatments was of sim-ilar magnitude (means of 5.5 and 6.5 kg N ha−1d−1, re-spectively) but not those of UNSAT/sat and UNSAT/halfsat (means of 7.1 and 11.9 kg N ha−1d−1, respectively). The N2
concentrations always increased before the soil-emitted N2O
reached the maximum. The lag between both N2O and N2
peak for all samples was only a few hours. Peaks of N2
generally lasted just over 4 days, except in UNSAT/halfsat, where one replicate lasted about 6 days (Fig. 1). Unlike in the N2O data, there was larger within treatment variability in
the replicates for all four treatments. The standard deviations of each mean (Table 3) also indicate the large variability in treatments UNSAT/sat and UNSAT/halfsat for both N2O and
N2.
The product ratios, i.e. N2O/(N2O+N2), resulted in a
peak just after amendment addition by ca. 0.73 (at 0.49 days), 0.65 (at 0.48 days), 0.99 (at 0.35 days) and 0.88 (at 0.42 days) for SAT/sat, HALFSAT/sat, UNSAT/sat and UNSAT/halfsat, respectively, and then decreases gradually until day 3, where it becomes nearly zero for the two wettest treatments and stays stable for the driest treatments between 0.1 and 0.2 (see Table 5, where the daily means of these ratios are presented). The cumulative areas of the N2O and N2peaks analysed
by one-way ANOVA resulted in no significant differences be-tween treatments for both N2O and N2(Table 3). Due to the
large variation in treatments UNSAT/sat and UNSAT/halfsat we carried out a pair wise analysis by using a weighted t test (Cochran and Cox, 1957). This analysis resulted in treatment differences between SAT/sat and HALFSAT/sat, HALFSAT/sat and UNSAT/sat, and SAT/sat and UNSAT/sat, but only at the 10 % significance level (P <0.1 for both N2O
and N2).
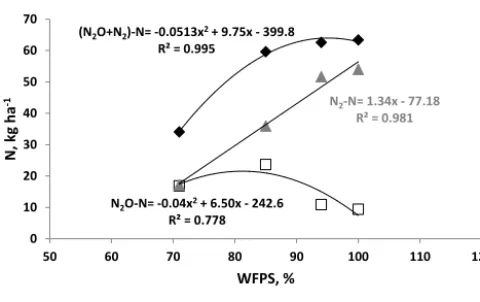
The results showed that total N emission (N2O+N2)
(Table 3) decreased between the highest and lowest soil moistures, i.e. from 63.4 for SAT/sat (100 % WFPS) to 34.1 kg N ha−1(71 % WFPS) for UNSAT/halfsat. The max-imum cumulative N2O occurred at around 80 % WFPS
(Fig. 2), whereas the total N2O+N2 was largest at about
95 % and for N2it was our upper treatment at 100 % WFPS.
3.2.2 Carbon dioxide
The background CO2fluxes (before amendment application,
-10 0 10 20 30 40 50 60 70 80
0 2 4 6 8 10 12
N2
O,
N2
, kg
N
h
a
-1
Days after amendment application
Mean N2 Mean N2O
0 10 20 30 40 50 60
0 2 4 6 8 10 12
kg
C
O2
-C
ha
-1 d
-1
Days after amendment addition
-10 0 10 20 30 40 50 60
0 2 4 6 8 10 12
N2
O,
N2
, k
g N
h
a
-1
Days after amendment application Mean N2 Mean N2O
(b)
0 10 20 30 40 50 60
0 2 4 6 8 10 12
kg
CO
2
-C h
a
-1 d
-1
Days after amendment addition
-5 0 5 10 15
0 2 4 6 8 10 12
N2
O,
N2
, k
g N
h
a
-1
Days after amendment application
Mean N2 Mean N2O
(c)
0 20 40 60 80 100 120
0 2 4 6 8 10 12
kg
CO
2
-C h
a
-1 d
-1
Days after amendment addition
-10 0 10 20 30 40 50
0 2 4 6 8 10 12
N2
O,
N2
, k
g N
h
a
-1
Days after amendment application
Mean N2 Mean N2O
(d)
0 20 40 60 80 100 120
0 2 4 6 8 10 12
kg
CO
2
-C h
a
-1 d
-1
Days after amendment addition
(a)
Figure 1.Mean of the three replicates for N2O, N2and CO2emissions from(a)SAT/sat treatment,(b)HALFSAT/sat,(c)UNSAT/sat and
(d)UNSAT/halfsat. Grey lines correspond to the standard error of the means (incanddonly errors for the N2are shown to avoid overlapping
Table 2.The four saturation conditions set for the Highfield soil.
Saturation condition SAT/sat HALFSAT/sat UNSAT/sat UNSAT/halfsat
Macropores Micropores
As prepared:
Matric potential, kPa
Water content, g 100 g−1
Water content, cm−3100 cm−3
Water-filled pore space, % Threshold pore size saturated, µm
Final, following amendment:
Matric potential, kPa
Water content, g 100 g−1
Water content, cm−3100 cm−3
Water-filled pore space, % Threshold pore size saturated, µm
Saturated Saturated
4.1 47.7 61.1 98 73
0 49.8 63.8 100 all
Half-saturated Saturated
12.3 42.5 54.4 91 24
8.6 44.6 57.1 94 35
Unsaturated Saturated
27.3 37.2 47.7 82 11
20.0 39.3 50.4 85 15
Unsaturated Half-saturated
136.9 29.4 37.3 68 2
78.1 31.5 40.0 71 4
(N2O+N2)-N= -0.0513x2 + 9.75x - 399.8
R² = 0.995
N2O-N= -0.04x2 + 6.50x - 242.6
R² = 0.778
N2-N= 1.34x - 77.18
R² = 0.981
0 10 20 30 40 50 60 70
50 60 70 80 90 100 110 120
N,
kg
h
a
-1
WFPS, %
N2O+N2 N2O N2
Figure 2. Total N emissions (N2O+N2)-N, N2O and N2 vs.
WFPS. Fitted functions through each dataset are also shown.
and variable (not shown). The CO2 concentrations in the
headspace increased within a few hours after amendment ap-plication. The maximum CO2flux was reached earlier in the
drier treatments (about 1–2 days;∼70 kg C ha−1d−1) com-pared to the wettest (3 days;∼40 kg C ha−1d−1)and former peaks were also sharper (Fig. 1). The cumulative CO2fluxes
were significantly larger in the two drier unsaturated treat-ments (ca. 400–420 kg C ha−1)when compared to the wetter more saturated treatment (ca. 280–290 kg C ha−1,P <0.05) (Table 3).
3.2.3 Isotopocules of N2O
The δ15Nbulk of the soil-emitted N2O in our study
dif-fered significantly among the four treatments and between the seven sampling dates (p <0.001 for both); there was also a significant treatment×sampling date interaction (p < 0.001). The maximumδ15Nbulkgenerally occurred on day 3, except for SAT/sat on day 4 (Table 6).
The maximumδ18O-N2O values were also found on day 3,
except for SAT/sat, which peaked at day 2 (Table 6). Overall, theδ18O-N2O values varied significantly between treatment
and sampling dates (p <0.001 for both), but there was no significant treatment×time interaction (p >0.05).
The site preference (SP) for the SAT/sat treatment had an initial maximum value on day 2 (6.3 ‰), which decreased thereafter in the period from day 3 to 5 to mean SP values of the emitted N2O of 2.0 ‰ on day 5, subsequently rising
to 8.4 ‰ on day 12 of the experiment (Table 6). The HALF-SAT/sat treatment had the highest initial SP values on day 2 and 3 (both 6.4 ‰), decreasing again to a value of 2.0 ‰, but now on day 4 followed by subsequent higher SP values of up to 9.2 ‰ on day 7 (Table 6). The two driest treatments (UN-SAT/sat and UNSAT/halfsat) both had an initial maximum on day 3 (11.9 and 5.9 ‰, respectively), and in UNSAT/sat the SP value then decreased to day 7 (3.9 ‰). However, in the UNSAT/halfsat treatment, after a marginal decrease on day 4 (5.4 ‰), it then increased throughout the experiment, reaching 11.8 ‰ on day 12 (Table 6). The lowest SP values were generally on day 1 in all treatments. Overall, for all pa-rameters, there was more similarity between the more satu-rated treatments SAT/sat and HALFSAT/sat, and between the two more dry and aerobic treatments UNSAT/sat and UN-SAT/halfsat.
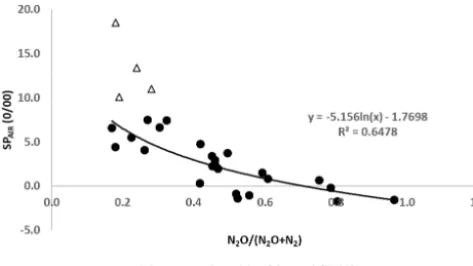
The N2O/(N2O + N2)ratios vs. SP for all treatments
in the first 2 days (when N2O was increasing and the
N2O/(N2O+N2)ratio was decreasing) shows a significant
negative response of the SP when the ratio increased (Fig. 3). This behaviour suggests that when the emitted gaseous N is dominated by N2O (ratio close to 1) the SP values will
be slightly negative with an intercept of−2 ‰ (Fig. 3), i.e. within the SP range of bacterial denitrification. With decreas-ing N2O/(N2O+N2)ratio the SP values of soil-emitted
N2O were increasing to values up to 8 ‰. This is in
Figure 3.Ratio N2O/(N2O+N2)vs. site preference (SP) for all
for treatments in the first 2 days. A logarithmic function was fitted through the data; the corresponding equation and correlation coeffi-cient are given. Also shown data from Lewicka et al. (2014).
by N2, or N2O is low, where the SP values of soil-emitted
N2O were much higher (Fig. 3), pointing to an overall
prod-uct ratio related to an “isotopic shift” of 10 to 12.5 ‰. The fitted logarithmic function in Fig. 3 is in almost perfect agree-ment with Lewicka-Szczebak et al. (2014).
It has been reported that the combination of the isotopic signatures of N2O potentially identifies the contribution of
processes other than bacterial denitrification (Köster et al., 2015; Wu et al., 2016; Deppe et al., 2017). The question arises of to what extent the relationships between the δ18O andδ15Nbulkand betweenδ18O and SP within the individual treatments denitrification dynamics are related. We checked this to evaluate the robustness of isotope effects during N2O
reduction as a prerequisite to calculate the percentage of bac-terial denitrification in N2O production. In our data,
maxi-mumδ18O and SP values were generally observed at or near the peak of N2 emissions on days 2–3, independent of the
moisture treatment (Table 6 and Fig. 3).δ15Nbulkvalues of all treatments were mostly negative when N2O fluxes started to
increase (day 1, Fig. 1, Table 6), except for UNSAT/halfsat, in which the lowest value was before amendment application, reaching their highest values between days 3 and 4 for when N2O fluxes were back to the low initial values, and then
de-creased during the remaining period.δ18O values increased about 10–20 ‰ after day 1, reaching maximum values on days 2 or 3 in all treatments, while SP increased in paral-lel, at least by 3 ‰ (SAT/sat) and up to 12 ‰ (UNSAT/sat). Whileδ18O exhibited a steady decreasing trend after day 3, SP behaved oppositely to δ15Nbulk with decreasing values, whileδ15Nbulkwas rising again after days 4 or 5.
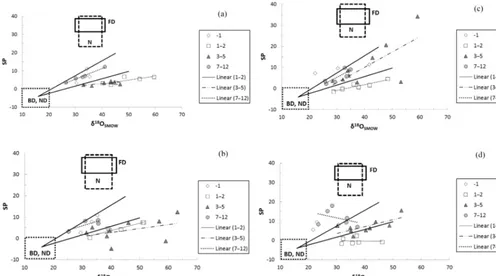
We further explored the data by looking at the relation-ships between theδ18O andδ15Nbulk for all the treatments. The δ18O vs. δ15Nbulk for all treatments is presented sep-arating the data in three periods (see Fig. 4). There was a strong and significant relationship (P <0.001 and 0.05, re-spectively) betweenδ18O vs.δ15Nbulkfor the high-moisture treatments (R2=0.973 and 0.923 for SAT/sat and
HALF-SAT/sat, respectively) at the beginning of the incubation (“1– 2”) when the N2O emissions are still increasing, in contrast
to those of the lower soil moisture treatments that were lower and not significant (R2=0.294 and 0.622, for UNSAT/sat and UNSAT/halfsat, respectively). The relationships between δ18O vs.δ15Nbulkof emitted N2O for the “3–12” period were
significant for SAT/sat and HALFSAT/sat withR2values be-tween 0.549 and 0.896 andP values<0.05 and 0.001, re-spectively (Fig. 4). Regressions were also significant for this period for the driest treatments (P <0.001). Interestingly, with decreasing soil moisture content (Fig. 4a to d) the re-gression lines of “1–2” and “3–12” day period got closer to-gether in the graphs. Overall, theδ15Nbulkisotopic distances between the two lines was larger for a givenδ18O-N2O value
for SAT/sat and HALFSAT/sat (ca. 20 ‰) when compared to the UNSAT/sat and UNSAT/halfsat treatments (ca. 13 ‰) (Fig. 4). Therefore, it seems theδ15Nbulk/ δ18O-N2O
signa-tures are more similar for the drier soils than the two wettest treatments. In addition, Fig. 4 exactly reflects the two-pool dynamics with increasingδ15N andδ18O while the product ratio goes down (days 2, 3), then only δ15N continues in-creasing due to fractionation of the NO−3 during exhaustion of pool 1 in the wet soil (days 3, 4, 5). Finally, as pool 1 is de-pleted and more and more comes from pool 2, the product ra-tio increases somewhat, andδ15N decreases somewhat since pool 2 is less fractionated and alsoδ18O decreases due to slightly increasing product ratio. Note that the turning points ofδ18O and product ratio (Tables 3 and 4) for the wetter soils almost coincide.
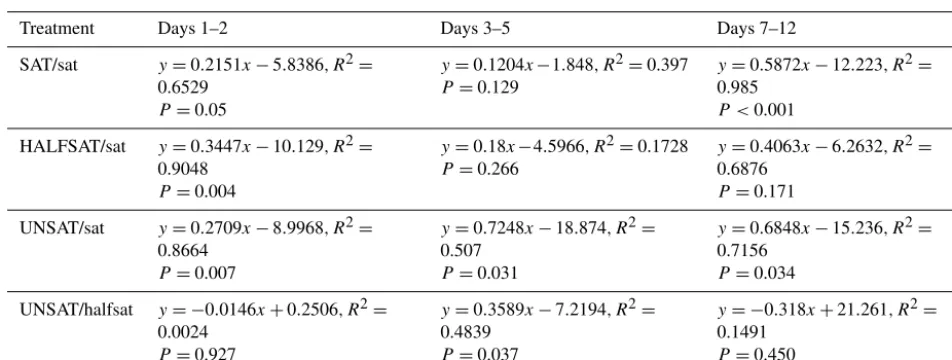
Similarly to Fig. 4, δ18O vs. the SP (Fig. 5) was anal-ysed for the different phases of the experiment. Generally, the slopes (Table 7) for days 1–2 for the three wettest treat-ments were similar (∼0.2–0.3) following the range of known reduction slopes and also had high and significant (P < 0.05) regression coefficients (R2=0.65, 0.90 and 0.87 for SAT/sat, HALFSAT/Sat and UNSAT/sat, respectively). The slopes on days 3–5 were variable but slightly similar on days 7–12 (between 41 and 0.68) for the same three treatments. They were only significant for the two driest treatments (P <0.05). On days 7–12 SAT/sat and UNSAT/sat gave sig-nificant correlations (P <0.001 and 0.05, respectively). Fig-ure 5 also shows the “map” for the values of SP andδ18O from all treatments. Reduction lines (vectors) represent mimum and maxmimum routes of isotopocules values with in-creasing N2O reduction to N2based on the reported range
in the ratio between the isotope fractionation factors of N2O
reduction for SP andδ18O (Lewicka-Szczebak et al. (2017). Most samples are located within the vectors (from Lewicka-Szczebak et al., 2017) area of N2O production by bacterial
denitrification with partial N2O reduction to N2(within
up-permost and lowermost N2O reduction vectors representing
y = 1.134x + 37.7 R² = 0.866
P=0.239 y = 1.060x + 62.6
R² = 0.973 P<0.001
y = 1.046x + 42.9 R² = 0.549
P=0.002
20 30 40 50 60 70
-40 -20 0 20
δ
18O
SM
OW
(
0/ 00
)
δ15NbulkAIR (0/00)
y = 0.907x + 60.3 R² = 0.923
P=0.002
y = 1.122x + 42.5 R² = 0.896
P<0.001
20 30 40 50 60 70
-40 -20 0 20
δ
18O
SM
OW
(
0/ 00
)
δ15N
bulkAIR (0/00)
(a)
(b)
y = 0.778x + 50.1 R² = 0.294
P=0.266 y = 1.269x + 48.5
R² = 0.642 P<0.001
20 30 40 50 60 70
-40 -20 0 20
δ
18O
SM
OW
(
0/ 00
)
δ15NbulkAIR (0/00)
y = 0.764x + 50.1 R² = 0.622
P=0.062
y = 0.731x + 44.3 R² = 0.745
P<0.001 20
30 40 50 60 70
-40 -20 0 20
δ
18O
SM
OW
(
0/ 00
)
δ15N bulkAIR (0/00)
(d) (c)
Figure 4.δ18O vs.δ15Nbulkin all treatments for three periods: “−1”, withδ18O vs.δ15Nbulkvalues 1 day prior to the moisture adjustment
(and N and C application); “1–2”, with values in the first 2 days after the addition of water, N and C, and N2O emissions were generally
increasing in all treatments; and “3–12”, the period in days after moisture adjustment and N and C addition when N2O emissions generally
decreased back to baseline soil emissions (day−1 in diamond symbols, days 1–2 in square symbols and days 3–12 in triangle symbols) in the
experiment.(a)SAT/sat treatment,(b)HALFSAT/sat,(c)UNSAT/sat and(d)UNSAT/halfsat. Equations of fitted functions and correlation
coefficients are shown. Correlations are unadjusted; thePvalue tests whether the slope is different from zero.
more close or within the vector area of mixing between bac-terial denitrification and fungal denitrification/nitrification.
The estimated ranges of the proportion of emitted N2O
re-sulting from bacterial denitrification (%BDEN)were on day
1 and 2 after the amendment comparable in all four moisture treatments (Table 6). However, during day 3 to 12 the %BDEN
ranged from 78 to 100 % in SAT/sat and 79 to 100 % HALF-SAT/Sat, which was generally higher than that estimated at 54–86 % for UNSAT/halfsat treatment. The %BDEN of
UN-SAT/halfsat in that period was intermediate between SAT/sat and UNSAT/sat with range of range 60–100 % (Table 6). The final values were similar to those on day−1, except for the UNSAT/sat treatment.
4 Discussion
4.1 N2O and N2fluxes
4.1.1 Effect of soil moisture
The observed decrease in total N emissions with decreas-ing initial soil moisture reflects the effect of soil moisture as reported in previous studies (Well et al., 2006). The differ-ences when comparing the cumulative fluxes, however, were only marginally (p <0.1) significant (Table 3) mostly due to large variability within replicates in the drier treatments (see Fig. 1b). Davidson et al. (1991) provided a WFPS thresh-old for determination of source process, with a value of 60 % WFPS as the borderline between nitrification and denitrifi-cation as source processes for N2O production. The WFPS
in all treatments in our study was larger than 70 %, above this 60 % threshold, and referred to as the “optimum water content” for N2O by Scheer et al. (2009), so we can be
Figure 5. Site preference (‰) vs.δ18O (‰) in all treatments for three periods (day−1, days 1–2 and days 3–12) in the experiment:
(a)SAT/sat treatment;(b)HALFSAT/sat;(c)UNSAT/sat;(d)UNSAT/halfsat. Equations of fitted functions and correlation coefficients are
in Table 7 for 1–2, 3–5 and 7–12 (5–12 forc). Endmember areas for nitrification, N; bacterial denitrification, D; fungal denitrification,
FD; and nitrifier denitrification, ND, as well as corresponding vectors or reduction lines (black solid lines) are from Lewicka-Szczebak et
al. (2017) and represent minimum and maximum routes of isotopocule values with increasing N2O reduction to N2based on the reported
range in the ratio between the isotope fractionation factors of NO reduction for SP andδ18O (Lewicka-Szczebak et al., 2017).
source process in our experiment. In addition, Bateman et al. (2004) observed the largest N2O fluxes at 70 % WFPS on
a silty loam soil, lower than the 80 % value for the largest fluxes from the clay soil in our study (Fig. 2), suggesting that this optimum value could change with soil type. Further, the maximum total measured N lost (N2O+N2)in our study
occurred at about 95 % WFPS (Fig. 2), but not many stud-ies report N2fluxes for comparison and we are still missing
measurements of nitric oxide (NO) (Davidson et al., 2000) and ammonia (NH3)to account for the total N losses. It is,
however, possible that the N2O+N2 fluxes in the SAT/sat
treatment were underestimated due to low diffusivity in the water-filled pores (Well et al., 2001). Gases would have been trapped (particularly in the higher saturation treatments) due to low diffusion and thus possibly masked differences in N2
and N2O production since this fraction of gases was not
de-tected (Harter et al., 2016). It is worth mentioning that there was some drying during the incubation. The flow of the gas is very slow (10 mL min−1), simulating a low wind speed, so normally this would dry the soil in field conditions too. It would represent a rainfall event where the initial moisture differs between treatments but some drying occurs due to the wind flow. We believe, however, that the effect of drying will
be more relevant (and significant relative to the initial mois-ture) later in the incubation.
The smaller standard errors in both N2O and N2data for
the larger soil moisture levels (Table 3 and Fig. 1) could sug-gest that, at high moisture contents, nutrient distribution (N and C) on the top of the core is more homogeneous, causing replicate cores to behave similarly. At the lower soil mois-ture for both N2O and N2, it is possible that some cracks
ap-pear on the soil surface, causing downwards nutrient move-ment, resulting in heterogeneity in nutrient distribution on the surface and increasing variability between replicates, re-flected in the larger standard errors of the fluxes. Laudone et al. (2011) studied, using a biophysical model, the positioning of the hot-spot zones away from the critical percolation path (described as “where air first breaks through the structure as water is removed at increasing tensions”) and found it slowed the increase and decline in emission of CO2, N2O and N2.
T able 3. Contents of soil moisture, NO − 3 , NH + 4 and C :N ratio, and cumul ati v e flux es of N 2 O and N 2 and CO 2 from all treatments at the end of the incubation. V alues in brack ets are standard de viation of the mean of three v alues (emissions are expressed per area and soil weight basis) . T reatment % mean moisture NO − 3 , mg N kg − 1 dry soil NH + 4 , mg N kg − 1 dry soil T otal C, % T otal N, % N 2 O, kg N ha − 1 N 2O, mg N kg − 1 dry soil N 2, kg N ha − 1 N 2, mg N kg − 1 dry soil T otal emitted N, kg N ha − 1 CO 2 ,kg C ha − 1 SA T/sat 39.8 (1.3) 1.1 (0.4) 104.3 (1.1) 3.61 (0.04) 0.35 (0.004) 9.4 (1.1) 7.8 (0.9) 54.0 (14.0) 44.8 (11.6) 63.4 289.2 (30.4) HALFSA T/sat 40.2 (0.2) 0.8 (1.0) 104.2 (6.8) 3.64 (0.08) 0.36 (0.004) 10.9 (0.4) 9.0 (0.3) 51.7 (9.0) 42.8 (7.4) 62.6 283.0 (35.5) UNSA T/sat 36.5 (2.1) 51.2 (37.4) 100.8 (5.7) 3.64 (0.10) 0.36 (0.007) 23.7 (11.0) 20.0 (9.5) 36.0 (28.5) 30.2 (23.7) 59.7 417.6 (57.1) UNSA T/halfsat 34.3 (1.1) 100.6 (16.1) 71.3 (33.6) 3.53 (0.08) 0.36 (0.01) 16.8 (15.8) 14.0 (13.1) 17.2 (19.4) 14.3 (16.1) 34.1 399.7 (40.6)
used for modelling the effect of soil compaction and satura-tion on the emission of N2O. They suggest that, having
deter-mined biophysical parameters influencing N2O production,
it remains to be determined whether soil structure, or simply saturation, is the determining factor when the biological pa-rameters are constrained. Furthermore, Clough et al. (2013) indicate that microbial-scale models need to be included in larger models linking microbial processes and nutrient cy-cling in order to consider spatial and temporal variation. Kulkarni et al. (2008) refer to “hot spots” and “hot moments” of denitrification as scale-dependant and highlight the limi-tations for extrapolating fluxes to larger scales due to these inherent variabilities. In addition, in order to understand het-erogeneity of added amendment, we assumed (for modelling purposes) multiple pools after N and glucose amendment. In Bergstermann et al. (2011), for example, we presumed they occupied 10 % of the pore volume of the core (pool 1), be-cause this resulted in a good fit for measured and modelled N2and N2O fluxes as well asδ15Nbulkvalues. In the current
study, we could assume that in the wettest treatment this (pro-portional) volume was smaller, i.e. similar to the pore volume displaced by the added 5 mL of amendment, since pores were almost completely filled with water. Furthermore, we could assume that it would have been the largest in the driest treat-ment, where the amendment solution was also able to infil-trate air-filled pores in the partly saturated pore space and thereby increase the water content in the infiltrated volume. With regards to leaching, it was minimal (<0.5 mL water in the core) and so significant leaching of amendment can thus be excluded. Other techniques such as X-ray and MRI could help determine the distribution of added nutrients in the soil matrix.
4.1.2 Relationship with soil parameters to determine processes
Our results, for the two highest water contents (SAT/sat and HALFSAT/sat), indicated that N2O only contributed 20 % of
the total N emissions, as compared to 40–50 % at the low-est water contents (UNSAT/sat and UNSAT/halfsat, Table 3). This was due to reduction to N2 at the high moisture level,
confirmed by the larger N2fluxes, favoured by low gas
diffu-sion, which increased the N2O residence time and the chance
Table 4.Scenarios with different combinations ofδ18O and site preference (SP) endmember values andηN2O−N2values to calculate
maxi-mum and minimaxi-mum estimates of %Bden(minimum, maximum and average values adopted from Lewicka-Szczabak et al., 2017).
SP0BD SP0FDN ηSP η18O
Model (min endmember plusη) −11 30 −2 −12
Model (max endmember plusη) 0 37 −8 −12
Model (max endmember) 0 37 −5.4 −12
Model (min endmember) −11 30 −5.4 −12
Model (maxη) −5 33 −8 −12
Model (minη) −5 33 −2 −12
Table 5.Ratios N2O/(N2O+N2)for all treatments.
SAT/sat HALFSAT/sat UNSAT/halfsat UNSAT/sat
Days mean SE mean SE mean SE mean SE
−1 0.276 0.043 0.222 0.009 0.849 0.043 0.408 0.076
0 0.630 0.022 0.538 0.038 0.763 0.053 0.861 0.043
1 0.371 0.025 0.360 0.019 0.622 0.018 0.644 0.031
2 0.096 0.016 0.139 0.015 0.425 0.005 0.296 0.020
3 0.004 0.002 0.015 0.006 0.439 0.052 0.256 0.025
4 0.017 0.002 0.008 0.001 0.475 0.049 0.232 0.012
5 0.019 0.003 0.012 0.001 0.503 0.037 0.174 0.010
6 0.068 0.008 0.020 0.001 0.459 0.052 0.135 0.010
7 0.085 0.008 0.047 0.003 0.333 0.057 0.127 0.003
8 0.106 0.004 0.066 0.002 0.277 0.006 0.122 0.002
9 0.089 0.003 0.053 0.005 0.265 0.006 0.122 0.005
10 0.060 0.003 0.090 0.014 0.428 0.086 0.118 0.006
11 0.063 0.002 0.053 0.002 0.414 0.051 0.125 0.005
N2O with larger consumption of NO−3 at the higher moisture
and larger N2to N2O ratios (5.7, 4.7 for SAT/sat and
HALF-SAT/sat, respectively), whereas at the lower moisture, ratios were lower (1.5 and 1.0 for UNSAT/sat and UNSAT/halfsat, respectively) (Davidson, 1991). This also indicates that with WFPS above the 60 % threshold for N2O production from
denitrification, there was an increasing proportion of anaer-obic microsites with increase in saturation controlling NO−3 consumption and N2/N2O ratios in an almost linear manner.
With WFPS values between 71 and 100 % and N2/N2O
be-tween 1.0 and 5.7, a regression can be estimated:Y =0.1723 X−11.82 (R2=0.8585), where Y is N2/N2O and X is
%WFPS. In summary, we propose that heterogeneous distri-bution of anaerobic microsites could have been the limiting factor for complete depletion of NO−3 and conversion to N2O
in the two drier treatments. In addition, in the UNSAT/halfsat treatment there was a decrease in soil NH+4 at the end of the incubation (almost 50 %; Table 3), suggesting nitrifica-tion could have been occurring at this water content which also agrees with the increase in NO−3, even though WFPS was relatively high (>71 %) (Table 3). It is important to note that as we did not assess gross nitrification, the observed net nitrification based on lowering in NH+4 could underestimate gross nitrification since there might have been substantial N
mineralisation during the incubation. However, under condi-tions favouring denitrification at high soil moisture the typi-cal N2O produced from nitrification is much lower compared
to that from denitrification (Lewicka-Szczebak et al., 2017) with the maximum reported values for the N2O yield of
nitri-fication of 1–3 % (e.g. Deppe et al., 2017). If this is the case, nitrification fluxes could not have exceeded 1 kg N with NH+4 loss of<30 kg×3 %∼1 kg N. This would have represented for the driest treatment, if conditions were suitable only for one day, that nitrification-derived N2O would have been 6 %
of the total N2O produced. Loss of NH3 was not probable
at such low pH (5.6). The corresponding rate of NO−3 pro-duction using the initial and final soil contents and assuming other processes were less important in magnitude would have been<1 mg NO−3-N kg dry soil−1d−1, which is a reasonable rate (Hatch et al., 2002). The other three treatments lost sim-ilar amounts of soil NH+4 during the incubation (23–26 %), which could have been due to some degree of nitrification at the start of the incubation before O2was depleted in the soil
microsites or due to NH+4 immobilisation (Table 3) (Geis-seler et al., 2010).
A mass N balance, considering the initial and final soil NO−3, NH+4, added NO−3 and the emitted N (as N2O and N2),
Table 6.The temporal trends inδ15Nbulk,δ18O,δ15Nα, site preference (SP) and %BDENfor all experimental treatments (values in brackets
are the standard deviation of the mean).
δ15NbulkAIR(‰)
Day SAT/sat HALFSAT/sat UNSAT/sat UNSAT/halfsat
−1 −3.8 (2.1) −6.2 (1.5) −14.2 (10.9) −23.6 (1.1)
1 −18.9 (1.6) −25.5 (4.6) −20.3 (2.6) −20.8 (2.3)
2 −7.7 (4.2) −12.7 (2.7) −12.2 (2.0) −13.9 (5.7)
3 −2.4 (1.8) 14.0 (2.2) −1.1 (7.6) −4.4 (3.0)
4 −0.9 (2.2) −0.3 (3.6) −7.8 (4.6) −9.3 (3.7)
5 −6.9 (0.9) −4.3 (6.1) −11.3 (3.7) −8.9 (7.7)
7 −9.6 (1.5) −10.0 (1.6) −14.3 (4.7) −13.4 (13.5)
12 −7.5 (1.2) −8.6 (0.9) −11.8 (2.6) −21.3 (6.9)
δ18OSMOW(‰)
SAT/sat HALFSAT/sat UNSAT/sat UNSAT/halfsat
−1 33.3 (2.6) 32.7 (3.0) 31.4 (9.8) 25.2 (4.9)
1 42.9 (2.4) 37.1 (3.8) 32.3 (3.6) 33.3 (2.1)
2 54.0 (5.7) 48.7 (4.5) 42.7 (5.3) 40.5 (5.0)
3 45.7 (1.5) 59.7 (3.2) 53.4 (5.7) 41.2 (1.0)
4 42.5 (1.4) 42.0 (3.7) 38.1 (4.5) 39.9 (7.7)
5 36.0 (2.9) 34.6 (3.7) 30.4 (2.6) 36.5 (6.9)
7 32.2 (5.5) 31.6 (5.5) 28.4 (4.4) 32.7 (5.4)
12 34.9 (5.6) 34.1 (2.7) 32.4 (2.9) 28.5 (5.0)
δ15NαAIR(‰)
SAT/sat HALFSAT/sat UNSAT/sat UNSAT/halfsat
−1 −0.3 (3.4) −2.6 (1.8) −9.5 (12.0) −19.7 (2.1)
1 −17.4 (1.8) −24.0 (5.8) −20.2 (2.0) −21.1 (2.6)
2 −4.6 (4.2) −9.5 (3.6) −11.1 (1.1) −13.8 (5.9)
3 −0.8 (1.3) 17.2 (4.0) 7.6 (4.7) −2.7 (3.2)
4 1.0 (2.5) 0.7 (2.2) −3.5 (3.7) −2.8 (7.7)
5 −5.9 (0.7) −2.9 (5.4) −9.4 (3.9) −5.2 (7.9)
7 −7.8 (2.3) −5.3 (4.2) −12.3 (5.6) −7.7 (11.5)
12 −3.3 (2.1) −4.6 (0.6) −8.1 (4.2) −15.3 (5.5)
SPAIR(‰)
SAT/sat HALFSAT/sat UNSAT/sat UNSAT/halfsat
−1 7.0 (3.9) 7.1 (4.2) 9.4 (2.1) 7.7 (1.9)
1 2.9 (0.6) 3.0 (2.3) 0.1 (1.8) −0.7 (1.4)
2 6.3 (0.64) 6.4 (1.9) 2.2 (2.0) 0.2 (1.9)
3 3.3 (1.0) 6.4 (6.9) 11.9 (12.4) 5.9 (0.8)
4 3.7 (0.6) 2.0 (6.2) 8.7 (5.9) 5.4 (3.0)
5 2.0 (0.4) 3.0 (2.1) 3.9 (0.5) 7.4 (2.3)
7 5.0 (2.1) 9.2 (5.2) 3.9 (1.8) 11.2 (4.1)
12 8.4 (3.3) 7.9 (0.8) 7.3 (3.7) 11.8 (5.3)
Estimated range of %BDEN
SAT/sat HALFSAT/sat UNSAT/sat UNSAT/halfsat
−1 63–100 60–100 53–85 56–84
1–2 68–100 67–100 73–100 77–100
Table 7.Equations of fitted functions and correlation coefficients corresponding to Fig. 5 for site preference (SP) (yaxis) vs.δ18O (xaxis)
in all treatments for three periods. Correlations are unadjusted; theP value tests whether the slope is different from zero.
Treatment Days 1–2 Days 3–5 Days 7–12
SAT/sat y=0.2151x−5.8386, R2=
0.6529
P =0.05
y=0.1204x−1.848, R2=0.397
P=0.129
y=0.5872x−12.223, R2=
0.985
P <0.001
HALFSAT/sat y=0.3447x−10.129, R2=
0.9048
P =0.004
y=0.18x−4.5966, R2=0.1728
P=0.266
y=0.4063x−6.2632, R2=
0.6876
P =0.171
UNSAT/sat y=0.2709x−8.9968, R2=
0.8664
P =0.007
y=0.7248x−18.874, R2=
0.507
P=0.031
y=0.6848x−15.236, R2=
0.7156
P =0.034
UNSAT/halfsat y= −0.0146x+0.2506, R2=
0.0024
P =0.927
y=0.3589x−7.2194, R2=
0.4839
P=0.037
y= −0.318x+21.261, R2=
0.1491
P =0.450
110.8 mg N kg−1 for SAT/sat, HALFSAT/sat, UNSAT/sat and UNSAT/halfsat, respectively, that could have been emit-ted as other N gases (such as NO), and some immobilised in the microbial biomass. NO fluxes reported by Loick et al. (2016), for example, result in a ratio N2O/NO of 0.4.
In summary, unaccounted-for N loss is 2 to 3 times the total measured gas loss (Table 3). In addition, in the SAT/sat treat-ment there was probably an underestimation of the produced N2 and N2O due to restricted diffusion at the high WFPS
(e.g. Well et al., 2001).
4.1.3 Implications for field distribution of fluxes
Well et al. (2003) found that under saturated conditions there was good agreement between laboratory and field measure-ments of denitrification, and attributed deviations, under un-saturated conditions, to spatial variability of anaerobic mi-crosites and redox potential. Dealing with spatial variability when measuring N2O fluxes in the field remains a challenge,
but the uncertainty could be potentially reduced if water dis-tribution is known. Our laboratory study suggests that soil N2O and N2emission for higher moisture levels would be
less variable than for drier soils and suggests that for the for-mer a smaller number of spatially defined samples will be needed to get an accurate field estimate. This applied to a lesser extent to the CO2fluxes.
4.2 Isotopocule trends
Trends of isotopocule values of emitted N2O coincided with
those of N2and N2O fluxes. The results from the isotopocule
data (Table 6 and Fig. 3) also indicated that generally there were more isotopic similarities between the two wettest treat-ments when compared to the two contrasting drier soil mois-ture treatments.
Isotopocule values of emitted N2O reflect multiple
pro-cesses where all signatures are affected by the admixture of several microbial processes, the extent of N2O
reduc-tion to N2 and the variability of the associated isotope
ef-fects (Lewicka-Szczebak et al., 2015). Moreover, forδ18O andδ15Nbulk the precursor signatures are variable (Decock and Six, 2013), and forδ18O the O exchange with water can be also variable (Lewicka-Szczebak et al., 2017). Since the number of influencing factors clearly exceeds the number of isotopocule values, unequivocal results can only be obtained if certain processes can be excluded or be determined inde-pendently (Lewicka-Szczebak et al., 2015, 2017). The two latter conditions were fulfilled in this study, i.e. N2O fluxes
were high and several orders of magnitude above possible nitrification fluxes, since the N2O – to – NO−3 ratio yield of
nitrification products rarely exceeds 1 % (Well et al., 2008). Moreover, N2fluxes and thus N2O reduction rates were
ex-actly quantified.
The estimated values of %BDENindicate that, in the period
immediately after amendment application, all moisture treat-ments were similar, reflecting that the microbial response to N and C added was the same and denitrification dominated. This was the same for the rest of the period for the wetter treatments. In the drier treatments, proportions decreased af-terwards and were similar to values before amendment appli-cation, possibly due to recovery of more aerobic conditions that could have encouraged other processes to contribute. As N2was still produced in the driest treatment (but in smaller
amounts), this indicated ongoing denitrifying conditions and thus large contributions to the total N2O flux from
nitrifica-tion were not probable, but some occurred as suggested by NH+4 consumption.
et al., 2010; Bergstermann et al., 2011) where the same soil was used, resulting in two locally distinct NO−3 pools with differing denitrification dynamics. In the soil volume reached by the NO−3 /glucose amendment, denitrification was ini-tially intense with high N2and N2O fluxes and rapid isotopic
enrichment of the NO−3-N. When the NO−3 and/or glucose of this first pool was exhausted, N2and N2O fluxes were much
lower and dominated by the initial NO−3 pool that was not reached by the glucose/NO−3 amendment and that is less fractionated due to its lower exhaustion by denitrification, causing decreasing trends inδ15Nbulkof emitted N2O.
This is also reflected in Fig. 4, where N2O fluxes from
both pools exhibited correlations (and mostly significant) be-tweenδ15Nbulkandδ18O due to varying N2O reduction, but
δ15Nbulkvalues in days 1 and 2 – i.e. the phase when pool 1 dominated – were distinct from the previous and later phase. The fit of15Nbulk/18O data to two distinct and distant re-gression lines can be attributed to two facts: firstly, in the wet treatment (Fig. 4a, b) pool 1 was probably completely exhausted and there was little NO−3 formation from nitrifi-cation (indicated by final NO−3 values close to 0, Table 3), whereas the drier treatment exhibited substantial NO−3 for-mation and high residual NO−3. Hence, there was probably still some N2O from pool 1 after day 2 in the dry treatment
but not in the wetter ones. Secondly, the product ratios af-ter day 2 of the drier treatments were higher (0.13 to 0.44) compared to the wetter treatments (0.001 to 0.09). Thus the isotope effect of N2O reduction was smaller in the drier
treat-ments, leading to a smaller upshift ofδ15Nbulkand thus more negative values after day 2, i.e. with values closer to days 1+2.
This finding further confirms thatδ15N/ δ18O patterns are useful to identify the presence of several N pools, e.g. typi-cally occurring after application of liquid organic fertilisers, which has been previously demonstrated using isotopocule patterns (Koster et al., 2015).
Interestingly, the highest δ15Nbulk and δ18O values of the emitted N2O were found in the soils of the
HALF-SAT/sat treatment, although it may have been expected that the highest isotope values from the N2O would be found in
the wettest soil (SAT/sat) because N2O reduction to N2 is
favoured under water-saturated conditions due to extended residence time of produced N2O (Well et al., 2012).
How-ever, N2O/(N2+N2O) ratios of the SAT/sat and SAT/halfsat
treatments were not different (Table 5). Bol et al. (2004) also found that some estuarine soils under flooded condi-tions (akin to our SAT/sat) showed some strong simultane-ous depletions (rather than enrichments) of the emitted N2O
δ15Nbulk andδ18O values. These authors suggested that this observation may have resulted from a flux contribution of an “isotopically” unidentified N2O production pathway.
An-other explanation could be complete consumption of some of the produced N2O in isolated micro-niches in the SAT/sat
treatment due to inhibited diffusivity in the fully saturated pore space. N2formation in these isolated domains would not
affect the isotopocule values of emitted N2O and this would
thus result in lower apparent isotope effects of N2O
reduc-tion in water saturated environments as suggested by Well et al. (2012).
The SP values obtained were generally below 12 ‰, in agreement with reported ranges attributed to bacterial den-itrification:−2.5 to 1.8 ‰ (Sutka et al., 2006), 3.1 to 8.9 ‰ (Well and Flessa, 2009) and−12.5 to 17.6 ‰ (Ostrom and Ostrom, 2011). The SP, believed to be a better predictor of the N2O source as it is independent of the substrate isotopic
signature (Ostrom and Ostrom, 2011), has been suggested as it can be used to estimate N2O reduction to N2 in cases
when bacterial denitrification can be assumed to dominate N2O fluxes (Koster et al., 2013; Lewicka-Szczebak et al.,
2015). There was a strong correlation between the SP and N2O/(N2O+N2)ratios on the first 2 days of the
incuba-tion for all treatments up until the N2O reached its maximum
(Fig. 3), which reflects the accumulation ofδ15N at the al-pha position during ongoing N2O reduction to N2. Later on
in the experiment, beyond day 3, this was not observed prob-ably because in that period the product ratio remained almost unchanged and very low (Table 6). Similar observations have been reported by Meijide et al. (2010) and Bergstermann et al. (2011), as they also found a decrease in SP during the peak flux period in total N2+N2O emissions, but only when
the soil had been kept wet prior to the start of the experi-ment (Bergstermann et al., 2011). These results confirm from two independent studies (Lewicka-Szczebak et al., 2014) that there is a relationship between the product ratios and iso-topic signatures of the N2O emitted. Theδ18O vs. SP
regres-sions indicate more similarity between the three wettest treat-ments as well as high regression coefficients, suggesting this SP /δ18O ratio could also be used to help identify patterns for emissions and their sources.
4.3 Link to modelling approaches.
Since isotopocule data could be compared to N2 and N2O
fluxes, the variability of isotope effects of N2O production
and reduction to N2by denitrification could be determined
from this dataset (Lewicka-Szczebak et al., 2015), and this included modelling the two pool dynamics discussed above. It was demonstrated that net isotope effects of N2O reduction
(ηN2O−N2)determined for both NO
−
3 pools differed. Pool 1
representing amended soil and resulting in high fluxes but moderate product ratio, exhibited ηN2O−N2 values and the characteristicη18O/ η15N ratios similar to those previously reported, whereas for pool 2 (amendment-free soil), charac-terised by lower fluxes and very low product ratio, the net iso-tope effects were much smaller and theη18O/ η15N ratios, previously accepted as typical for N2O reduction processes
(i.e. higher than 2), were not valid. The question arises of whether the poor coincidence of pool 2 isotopologue fluxes with previous N2O reduction studies reflects the variability of