R E S E A R C H
Open Access
Revealing protein functions based on
relationships of interacting proteins and
GO terms
Zhixia Teng
1,2*, Maozu Guo
2*, Xiaoyan Liu
2, Zhen Tian
2and Kai Che
2FromBiological Ontologies and Knowledge bases workshop on IEEE BIBM 2016 Shenzhen, China. 16 December 2016
Abstract
Background:In recent years, numerous computational methods predicted protein function based on the protein-protein interaction (PPI) network. These methods supposed that two proteins share the same function if they interact with each other. However, it is reported by recent studies that the functions of two interacting proteins may be just related. It will mislead the prediction of protein function. Therefore, there is a need for investigating the functional relationship between interacting proteins.
Results:In this paper, the functional relationship between interacting proteins is studied and a novel method, called as GoDIN, is advanced to annotate functions of interacting proteins in Gene Ontology (GO) context. It is assumed that the functional difference between interacting proteins can be expressed by semantic difference between GO term and its relatives. Thus, the method uses GO term and its relatives to annotate the interacting proteins separately according to their functional roles in the PPI network. The method is validated by a series of experiments and compared with the concerned method. The experimental results confirm the assumption and suggest that GoDIN is effective on predicting functions of protein.
Conclusions:This study demonstrates that: (1) interacting proteins are not equal in the PPI network, and their function may be same or similar, or just related; (2) functional difference between interacting proteins can be measured by their degrees in the PPI network; (3) functional relationship between interacting proteins can be expressed by relationship between GO term and its relatives.
Keywords:Protein function, Interacting protein, Gene ontology, Directed network
Background
Characterizing protein functions is critical to understand-ing biological pathway, investigatunderstand-ing disease and develop-ing drugs [1, 2]. To elucidate protein functions, numerous research efforts have been made based on techniques ran-ging from sequence homology detection to text mining of scientific literature. However, only some of proteins are annotated with functional information for well-studied
model organisms so far. The situations would be even worse for the other organisms.
Recently, biological network provides chance of study-ing gene and its products (e.g protein, microRNA) at system level [3, 4]. It is widely recognized that a protein performs functions according to its partners in protein-protein interaction (PPI) network. This recognition has motivated the development of numerous network-based methods for predicting protein function. These methods are proposed on the principle of guilt-by-association (GBA), that is, the closer the two proteins are in the net-work the more similar are their functions [5]. These network-based methods can be roughly grouped into two major classes: direct annotation methods [6–11] * Correspondence:tengzhixia@nefu.edu.cn;maozuguo@hit.edu.cn
1Department of Information Management and Information System,
Northeast Forestry University, Harbin 150040, China
2Department of Computer Science and Engineering, Harbin Institute of
Technology, Harbin 150001, China
notations of the group’s members. In recent years, chi et al. [17] proposed a method named CIA, which iteratively updated annotations of a protein according to functional similarity between the protein and its partners. Wang [18] put forward a method named FCML to predict pro-tein function by multi-label learning. The FCML took functional association between Gene Ontology (GO) terms [19] under consideration when it worked. Almost all of these methods predicted protein functions using PPI network and GO terms. In these methods, predict-ing protein function is to associate term with protein ac-cording to functional semantic information of the term. The result of predicting is named as annotation of pro-teins and an annotation is represented by a term. These methods have promoted the development of the protein functional predicting. However, most of them ignored some crucial information which affect the quality of prediction:
(1)The PPI network is usually supposed as non-directional. In fact, it is commonplace in the PPI network that regulation relationship, upstream-downstream relations between interacting proteins when they are involved in signal transduction, tran-scriptional regulation, cell cycle or metabolism [20]. Moreover, it is reported by recent studies [21–23] that GBA is the exception rather than the rule in the PPI network and protein functions are deter-mined by specific and critical interactions. Hence the relationship between interacting proteins may affect their functions and should be considered in the process of predicting protein functions. (2)In GO context, a series of standard terms are
defined to describe characteristics of gene products (i.e. protein), and the terms are arranged as directed acyclic graph (DAG) hierarchy according to functional associations of them. Therefore, the functional information is not only expressed by semantics of terms but also contained in the hierarchy. Thus, the predictions of protein functions may be misled if the functional associations of terms are ignored. In fact, the information underlying in GO hierarchy are crucial for functional predicting of proteins.
the reactive protein. And then a directed PPI network is generated according to the functional proactive-reactive relationships of interacting proteins. Secondly, a coefficient variation is defined to measure functional difference between interacting proteins. Finally, func-tional associations of GO terms are taken into consid-eration in the process of annotating interacting proteins. By a proposed iterative algorithm, GO terms are allocated to describe protein functions in the PPI network under the control of coefficient variations. The method will be illustrated in the following section.
Methods
Functional relationship between interacting proteins As reported, many proteins play functional roles that are different from their neighbors in the PPI network. For example, a protein annotated with terms: “RNA trans-port”, “RNA binding” may involve in translation mech-anism and bind with diverse functional unrelated proteins [23]. For instance, the function of proteins which help others fold correctly may be unrelated to that of their partners. These proteins are more likely to be hubs than others in the PPI network. The hubs often have many partners and may involve in several different biological activities. In general, a protein is multi-functional if it takes part in many different biological ac-tivities. As reported [22], the more multi-functionality of a protein is, the less specific is its function. Besides, Gil-lis et al. also found that the multi-functionality of a pro-tein is highly correlated with its degree in the PPI network. Specifically, a protein with high degree may perform general function so that they could collaborate with other proteins in diverse biological activities. It can be considered that the low degree proteins are proactive and the high degree proteins are reactive in biological activities. Thus, the relationship between interacting proteins can be generalized as functional proactive-reactive according to their degrees in PPI network.
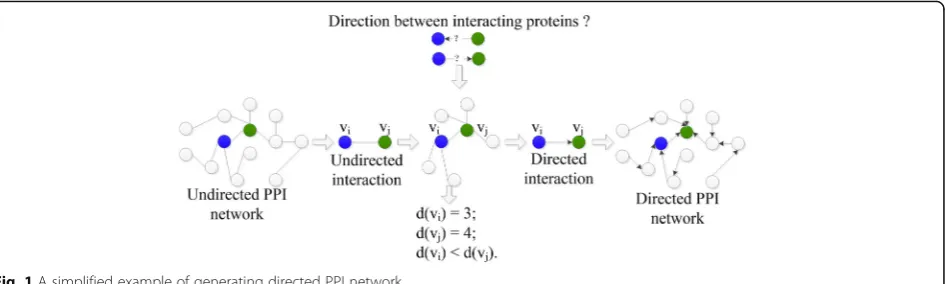
Let the PPI network be generalized as a digraph, in which a node presents a protein and an arch links two interacting proteins, oriented from the low degree one to the high degree one. Note that, two interacting
bidirectional arch. Accordingly, as displayed in Fig. 1, a novel directed PPI network is generated from the original undirected PPI network.
As discussed above, the functional specificity may descent on the direction from proactive protein to re-active protein. Thus, the descent direction of func-tional specificity between two interacting proteins is defined as (1). In the formula, O(vi, vj) represents the
descent direction of functional specificity between the two interacting proteins vi and vj; d(.) denotes the
de-gree of a protein in the PPI network. The formula means that: vi plays more specific functions than vj if
O(vi, vj) =1; vi play general functions than vj if O(vi,
vj) = −1; vi and vj are equal in the network and they
share the same function if O(vi, vj) =0.
O vi; ;vj
¼
1;d vð Þi <d vj ;
0;d vð Þ ¼i d vj ;
−1;d vð Þi >d vj :
8 > < >
: ð1Þ
Measuring functional difference between interacting proteins
Here the functional difference between two interact-ing proteins is measured. It is considered that a pro-tein perform specific functions if the propro-tein is involved in few activities, vice versa. In the PPI net-work, the number of connections of a protein can re-flect the number of activities the protein involves in. Thus, the functional specificity of a protein can be measured by degree of the protein in the PPI net-work. For two interacting proteins, their functional difference may be determined by the specificity differ-ence of the functions which are performed by their interaction. Accordingly, a coefficient variation is de-fined to measure the functional difference between two interacting proteins. The functional coefficient
variation between two interacting proteins vi and vj is
marked as CV(vi, vj) and can be measured by (2).
CV vi; ;vj
¼ 1
d vð Þi −
1 d vj
ð2Þ
Annotate the interacting proteins with GO terms based on their functional difference
In traditional methods, the known GO terms of a protein were directly associated with interacting partners of the protein. These methods ignored the functional difference between the interacting proteins. In fact, the functions of interacting proteins may be same or similar, or related but different. Therefore, the relatives of known terms of a protein are selected to annotate inter-acting partners of the protein in our method.
To select relatives, it is supposed that an ideal term can annotate functions of neighbors exactly. Semantic value of the ideal term can be estimated based on those of the known terms of interacting proteins and tional coefficient variation and descent direction of func-tional specificity between them. In our method, semantic value of a term gmis marked as S(gm) and computed by
(3). In the formula, dep(gm) is the depth of gm, and
desc(gm) is number of descendants of gm, and Gtotal is
the total number of terms in GO hierarchy. Equation (3) is proved to be effective on calculating semantic values of terms in [24]. The semantic value of a term is big if the term has few descendants or lies at deep level in GO hierarchy. The bigger the semantic value of the term is, the more specific is the function described by the term.
S gm ¼dep gm : 1−log desc gm þ1
logðGtotalÞ
ð3Þ
For interacting proteins viand vj, gm is a known term
of the protein vi; an ideal term gm* can be inferred from
most similar with the ideal term in term of the semantic value, are selected to describe functions of the protein vj.
In practice, the selected relatives may be grandparents, parents, siblings, children or grandchildren of the known terms.
arg min
gr m∈R gð Þm
S grm −S gm
ð5Þ
Generally speaking, this process provides three kinds of predictions: (1) some ancestors of the known terms of the proactive protein may be appropriate to describe the reactive protein; (2) some descendants of the known terms of the reactive protein can annotate the proactive protein; (3) terms of two interacting proteins can be shared directly by them if the proteins are equal in the PPI network.
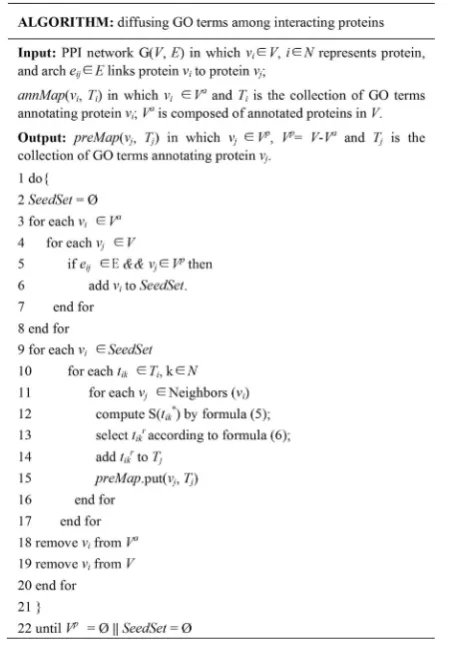
Diffusing functional information in the PPI network To mine functional information as much as possible, an iterative algorithm is designed to diffuse GO terms in the whole PPI network. As described in Fig. 2, the algo-rithm includes four steps as following.
Step 1: Select seed proteins from annotated proteins of which proactive partners have not been annotated yet;
Step 2: Select relatives of known terms of seed pro-teins to describe functions of their interacting partners according to formulas (4) and (5);
Step 3: Update terms of seed proteins based on their annotated reactive partners according to formulas (4) and (5);
Step 4: Remove seed proteins from the annotated pro-teins; the edges related to the seed proteins cannot me-diate diffusing between interacting proteins; and go to step 1 until all proteins in the PPI network are annotated or there does not exist annotated partners for remained unannotated proteins.
Time complexity analysis
Given a PPI network including n proteins, the time com-plexity of determining functional relationship between proteins is O(n2). Similarly, the time complexity of meas-uring functional difference between proteins is O(n2) too. If the proteins is at most annotated by p GO terms, and
the maximum degree of the proteins is k, the time com-plexity of diffusing functional information between two proteins is O(p × k). Accordingly, diffusing functional in-formation in the whole PPI network is O(m × p × k) if there are m proteins are annotated in the PPI network. Based on these analysis, the time complexity of the GoDIN should be O(n2) + O(n2) + O(m × p × k). Because the maximal value of m is n and the maximal value of k is n-1, the time complexity of the GoDIN is about O(n2).
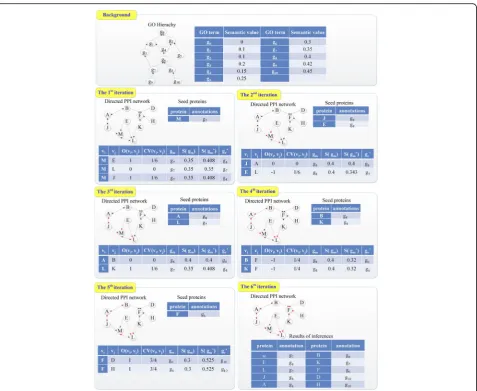
A simple example of GoDIN
To make our method clearly, a simple example is illus-trated in Fig. 3. In the Background of the Fig. 3, some GO terms are organized as DAG, in which terms are linked with arches oriented from child to parent. As well, semantic values of the terms are all listed in the
Background. Initially, protein M is annotated with term g7, L is annotated with term g4, and the other proteins
in the subnetwork are unannotated. The functional proactive-reactive relationship between interacting teins has been marked by an arch oriented from the pro-active protein to the repro-active protein. To reveal functions of the other proteins, annotations of M and L are diffused between interacting proteins iteratively. In
our example, the diffusing process is finished through six iterations. In each round, some functional inferences are made and key information of inferences is displayed in a table. The key information include the descent dir-ection of functional specificity between two interacting proteins (O(vi, vj)), functional coefficient variant between
seed protein and its neighbor (CV(vi, vj)), known term
(gm) and its semantic value (S(gm)), semantic value of
ideal term (S(gm* )) and selected relative of the known
term (gr*).
In the first iteration, M is regarded as a seed protein and its neighbors include E, L and J. According to the formula (1) and (2), O(M, E) is 1 and CV(M, E) is 1/6. The known GO term of M is g7and the semantic value
of g7, S(g7) is 0.35. By replacing parameters in the
for-mula (4) with these data, S(g7*) is estimated as 0.408.
Ac-cording to the formula (5), g8is appropriate to annotate
protein E. Similarly, the annotations of L and J are
predicted by the same means. Note that, because L has been annotated before diffusion, L’s term g4should also
be diffused to the seed proteins M. According to True Path Rule (TPR), g4also annotates M if g4is an ancestor
of g7. Thus, the annotations of M cannot be changed by
GO term g4. In addition, the protein M cannot be
se-lected as a seed protein again and arches M ← J, M ← E, M↔L cannot be used to diffuse GO terms again.
In the second iteration, J, E and L are candidates for seed proteins. Because the protein L has a proactive an-notated partner E, L cannot be taken as a seed protein. Therefore, J and E are selected as seed proteins. Accord-ing to the formula (1), O(J, A) is 0, which means that the protein J and A share the same function. Thus, pro-tein A can be annotated with term g8, which is also can
be inferred though the formula (4) and (5). Different from L, A has not been annotated at all before diffusion,
to the previous iterations. Due to Space Limitations, the details of these iterations are not described here. In the 6th iteration, it can be found that all proteins in the sub-network have been annotated already and no arch which can mediate diffusing between interacting proteins re-mains. Thus, the iteration is terminated and the diffus-ing of GO terms though the subnetwork is finished. The result of inferences are collected and listed in the table.
Experiments and discussions Experimental datasets
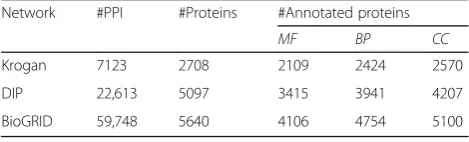
Three high reliable PPI networks of saccharoinyces cere-visiae (Krogan, DIP, BioGRID) are used to study the per-formance of the proposed method GoDIN. Krogan [25] consists of interactions with probabilities above 0.273. The latest version of DIP was downloaded from database of interacting protein (http://dip.doe-mbi.ucla.edu/dip/) [26] on July 7, 2013. BioGRID consists of the physical in-teractions of saccharoinyces cerevisiae and it was down-loaded from biological general repository for interaction datasets (http://thebiogrid.org/download.php) [27] on March 10, 2015. At the same time, the functional anno-tations of proteins of saccharoinyces cerevisiae were download from GO website and the annotations with evidence code ‘IEA’ (Inferred from Electronic Annota-tion), ‘NR’ (Not Recorded), ‘ND’ (No biological Data available), or ‘IC’ (Inferred by Curator) were excluded. The basic information of the three PPI networks are listed in Table 1. In the table, #PPI is the number of in-teractions in the network; #Proteins is the number of proteins in the network; #Annotated proteins is the number of the proteins with GO annotations; MF, BP and CC represent the annotation aspects: molecular function, biological process and cellular component respectively.
comparisons of the concerned methods. Supposed that x represents a target protein and K (x) is a set of known terms of x, P can be calculated as Eq. (6). In Eq. (6), P(x) is the set of predictive annotations; S is the target pro-tein set for testing; m is the number of propro-teins which at least have one predictive term. Similarly, R and F can be computed by Eq. (7) and Eq. (8) respectively.
P¼ 1 m
X
x∈S
K xð Þ∩P xð Þ
j j
P xð Þ
j j ð6Þ
R¼ 1 S j j
X
x∈S
K xð Þ∩P xð Þ
j j
K xð Þ
j j ð7Þ
F¼ 2P:R
PþR ð8Þ
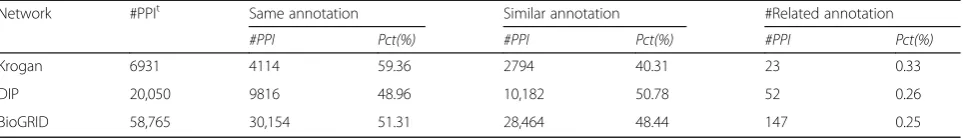
Functional relationship between interacting proteins To study functional relationships of interacting proteins, the interactions of Krogan, DIP and BioGRID are ana-lyzed thoroughly. Firstly, annotations of proteins in the networks are processed and the terms with evidence code ‘IPI’ (Inferred from Physical Interaction),‘IGI’ (In-ferred from Genetic Interaction) are excluded to avoid circular judgement. Secondly, the interactions are com-posed of two annotated proteins are selected for analysis. Finally, the selected interactions are grouped into: (1) the same annotation group, (2) the similar annotation group and (3) the related annotation group. The same annotation group consists of interactions which are composed of proteins with the same term. The similar annotation group consists of interactions which are composed of proteins with different terms of the same ontology. Usually, the terms of the same sub-ontology are similar. The related annotation group con-sists of interactions which are composed of proteins only with terms of different sub-ontologies. The results of analysis are displayed in Table 2. In the table, #PPIt is the number of interactions in the network; #PPI is the number of interactions in the group; Pct(%) presents the percentage of interactions in the group.
From Table 2, it can be seen that nearly 60% of inter-actions in the three networks belong to the first group; about 40% of interactions belong to the second group;
Table 1Basic information of the three PPI networks
Network #PPI #Proteins #Annotated proteins
MF BP CC
Krogan 7123 2708 2109 2424 2570
DIP 22,613 5097 3415 3941 4207
only less than 1% of interactions belong to the third group. As far as we know, none of methods relying on PPI network could annotate the interacting protein cor-rectly in the third group. The traditional methods sup-posed that the interacting proteins share the same term. Thus, about 40% of functional predictions may not be correct. Meanwhile, the results suggest that the majority of interacting proteins share the same or similar terms, which is consistent with basic assumptions of GoDIN.
Functional difference between interacting proteins To investigate the influence of the degree on functional difference between proteins, the annotations and degrees of interacting proteins are analyzed. The analysis is per-formed on Krogan, DIP, BioGRID and the interactions of the networks are grouped into: the same annotation group and the similar annotation group. The former consists of interactions which are composed of proteins with the same term, and the latter includes interactions of which the proteins are annotated by similar terms. The results derived from the same annotation groups and the similar annotation groups are illustrated in Table 3 and Table 4 separately. In the tables, #PPI is the number of tions in the group; #SameDeg is the number of interac-tions in which the interacting proteins with the same degree in the group; #DiffDeg is the number of interac-tions in which the interacting proteins with different de-grees in the group; Pct(%) presents the percentage of interactions in the group. The results suggest that the ma-jority of the interacting proteins have different degrees in the three networks. Some of the interacting proteins with different degrees are annotated by similar terms while the others share the same term.
To explain this phenomenon, coefficient variation is used to measure functional difference between the inter-acting proteins. The coefficient variations of proteins with different degrees in the same annotation group are
compared with those in the similar group. As shown in Fig. 3, the box-whisker plots are used to display the dis-tributions of coefficient variations of different groups. In the figure, the distributions of the coefficient variations in the same annotation groups are represented by dashed boxes and lines. Meanwhile, the distributions of coefficient variations in the similar annotation groups are represented by solid boxes and lines. As known, the bottom and top of the boxes are always the first and third quartiles of coefficient variations, and the bands in-side the boxes are the second quartiles (the median) of coefficient variations, and the hollow spots inside the boxes are the averages of coefficient variations. For clear, the same annotation groups of the three networks: Krogan, DIP and BioGRID are marked as SameKrogan, SameDIP, SameBIO respectively. Accordingly, the similar annotation groups of those networks are signed as Simi-larKrogan, SimilarDIP and SimilarBIO.
As displayed in Fig. 4, coefficient variations in the two different groups of the same network show obvious dif-ferent distributions. According to the median, average, the first and third quartiles, the coefficient variations in the same annotation groups are higher than those in the similar annotation groups. This may suggest that the functional differences of interacting proteins in the same annotation groups are smaller than those in the similar annotation groups. Sometimes, although the degrees of proteins are different, the functional coefficient variation between the proteins is tiny small. Therefore, the func-tional difference between the proteins may be negligible and they share the same term. This just explains why some of the interacting proteins with different degrees share the same term. According to the results and ana-lysis, the coefficient variation defined by GoDIN is ef-fective to measure the functional difference between interacting proteins. The functional coefficient variation between interacting proteins can be considered as a positive clue to predict protein function.
Table 2Functional relationship of interacting proteins
Network #PPIt Same annotation Similar annotation #Related annotation
#PPI Pct(%) #PPI Pct(%) #PPI Pct(%)
Krogan 6931 4114 59.36 2794 40.31 23 0.33
DIP 20,050 9816 48.96 10,182 50.78 52 0.26
BioGRID 58,765 30,154 51.31 28,464 48.44 147 0.25
Table 3Relationship between function and degree of interacting proteins in the same annotation group
Network #PPI #SameDeg Pct(%) #DiffDeg Pct(%)
Krogan 4114 243 5.9 3871 94.1
DIP 9816 531 5.4 9285 94.6
BioGRID 30,154 406 1.3 29,748 98.7
Table 4Relationship between function and degree of interacting proteins in the similar annotation group
Network #PPI #SameDeg Pct(%) #DiffDeg Pct(%)
Krogan 2794 91 3.26 2703 96.74
DIP 10,182 159 1.56 10,023 98.44
Comparison with the related methods
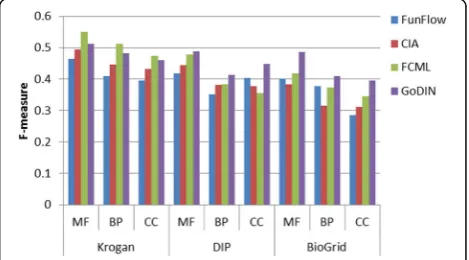
To test the performances of GoDIN, we take FunFlow [7], CIA [17], FCML [18] as comparing methods. These comparing methods have been discussed in the intro-duction. They are three typical methods of predicting protein function based on PPI network and GO context respectively. The comparisons are performed on Krogan, DIP and BioGRID from three annotation aspects: mo-lecular function (MF), biological process (BP) and cellu-lar component (CC) respectively. Figures 4, 5 and 6 show the precision, recall and F-measure of these methods on different networks and annotation aspects.
As shown in Fig. 5, the precision of GoDIN is compar-able to the best methods: CIA and FCML on Krogan. Meanwhile, GoDIN shows better precision than the other methods on DIP and BioGRID. FunFlow performs better than the others on DIP but it shows the lower precision than other methods on Krogan and BioGRID. In GoDIN, the functional differences of interacting proteins are con-sidered and the differences of terms are used to demon-strate the functional differences during predicting protein function. This is why GoDIN shows better performances
than the others in term of the precision. The functional relationships of terms are also considered thoroughly in CIA and FCML, but they pay no attention to the func-tional differences of interacting proteins. FunFlow ignores the functional relationships of terms in the process of pre-dicting protein function so that it performs not as well as the others.
In addition, it is also found that all of the methods show relatively low accuracy. This may be due to two issues: (1) the large number of GO terms; (2) the dependency of GO terms. The influence of the above issues will be more ob-vious while the proteins are annotated by more terms. This would be a place to start the future study.
As displayed in Fig. 6, FunFlow shows the best recall on almost all of the networks while GoDIN performs better on most of the networks and annotation aspects than FCML and CIA. The performances of CIA are not better than those of FCML. This may be attributed to global characteristics and local characteristics of PPI network. Specifically, CIA only takes local characteristics of PPI net-work into consideration in predicting protein functions while the other methods consider both global and local characteristics of PPI network. This may be the reasons why the recall of CIA is lower than those of the other methods. Besides, some proteins in the datasets are anno-tated by shallow terms, and the misjudgments on these
Fig. 4Comparison of coefficient variants based on different annotation groups
Fig. 5Comparison of precision of the related methods
Fig. 6Comparison of recall of the related methods
proteins have obvious negative impact on the recall. This would be a place to start our future study.
As shown in Fig. 7, GoDIN performs almost as well as the best method FCML on Krogan while shows the best F-measure on DIP and BioGRID. FunFlow performs not bet-ter than the others on all of the networks. Overall, GoDIN shows better performances than the three methods in terms of metrics: precision, recall and F-measures when they are applied to predict protein functions.
Conclusions
Predicting protein function based on PPI network is a hotspot of biological research in recent years. In this paper, the functional relationship between interacting proteins is studied and a novel method of protein func-tion predicfunc-tion is proposed based on the relafunc-tionship. To validate the effectiveness of the method, a series of analysis and experiments are performed on the three high reliable networks from the different annotation as-pects. The results suggest that: (1) interacting proteins are not equal in the PPI network, and their function may be same or similar, or just related; (2) functional difference between interacting proteins can be measured by their degrees in the PPI network; (3) functional rela-tionship between interacting proteins can be expressed by semantic relationship between GO term and its rela-tives; (4) compared with the other concerned methods, GoDIN has high precision and f-measure and it is effect-ive on predicting protein function.
Acknowledgements
We would like to thank the editors and the anonymous reviewers for their comments that led to significant improvements in our manuscript.
Funding
Publication of this article was funded by Fundamental Research Funds for the Central Universities (DB13AB02, DL13AB02) and Natural Science Foundation of China (61,671,189, 61,271,346, 61,571,163, 61,532,014 and 91,335,112).
Availability of data and materials
Not applicable.
About this supplement
This article has been published as part of Journal of Biomedical Semantics Volume 8 Supplement 1,2017: Selected articles from the Biological Ontologies and Knowledge bases workshop. The full contents of the supplement are available online at https://jbiomedsem.biomedcentral.com/ articles/supplements/volume-8-supplement-1.
Authors’contributions
Conceived and designed the approach: ZXT, MZG. Implemented the approach and performed the experiments: ZXT,ZT, KC. Analyzed the results: ZXT, MZG, XYL, ZT. Contributed to the writing of the manuscript: ZXT, MZG, XYL. All the authors have approved the final manuscript.
Ethics approval and consent to participate
Not applicable.
Consent for publication
Not applicable.
Competing interests
The authors declare that they have no competing interests.
Publisher’s Note
Springer Nature remains neutral with regard to jurisdictional claims in published maps and institutional affiliations.
Published: 20 September 2017
References
1. Liang C, et al. DisSim: an online system for exploring significant similar diseases and exhibiting potential therapeutic drugs. Sci Rep. 2016;6:30024. 2. Peng J, Bai K, Shang X, Wang G, Xue H, Jin S, Cheng L, Wang Y, Chen J.
Predicting disease-related genes using integrated biomedical networks. BMC Genomics. 2017;18(1):1043.
3. Zeng X, Zhang X, Zou Q. Integrative approaches for predicting microRNA function and prioritizing disease-related microRNA using biological interaction networks. Brief Bioinform. 2016;7(2):193–203.
4. Quan Z, et al. Similarity computation strategies in the microRNA-disease network: a survey. Brief Funct Genomics. 2016;15(1):55–64.
5. Sharan R, Ulitsky I, Shamir R. Network-based prediction of protein function. Mol Syst Biol. 2007;3:88.
6. Schwikowski B, Uetz P, Fields S. A network of protein–protein interactions in yeast. Nat Biotechnol. 2000;18(12):1257–61.
7. Nabieva E, et al. Whole-proteome prediction of protein function via graph-theoretic analysis of interaction maps. Bioinformatics. 2005;21(Suppl 1):i302–10. 8. Lee I, Li Z, Marcotte EM. An improved, bias-reduced probabilistic functional gene network of baker's yeast,Saccharomyces cerevisiae. PLoS One. 2007;2(10):e988. 9. Mostafavi S, et al. GeneMANIA: a real-time multiple association network
integration algorithm for predicting gene function. Genome Biol. 2008; 9(Suppl 1):S4.
10. Kourmpetis YA, van Dijk A, Ter Braak CJ. Gene ontology consistent protein function prediction: the FALCON algorithm applied to six eukaryotic genomes. Algorithms Mol Biol. 2013;8(1):10.
11. Kourmpetis YA, et al. Bayesian Markov random field analysis for protein function prediction based on network data. PLoS One. 2010;5(2):e9293. 12. Bader GD, Hogue CW. An automated method for finding molecular complexes
in large protein interaction networks. BMC Bioinformatics. 2003;4(1):2. 13. Bader JS, et al. Gaining confidence in high-throughput protein interaction
networks. Nat Biotechnol. 2004;22(1):78–85.
14. Adamcsek B, et al. CFinder: locating cliques and overlapping modules in biological networks. Bioinformatics. 2006;22(8):1021–3.
15. Ahn YY, Bagrow JP, Lehmann S. Link communities reveal multiscale complexity in networks. Nature. 2010;466(7307):761–4.
16. Janga SC, Diaz-Mejia JJ, Moreno-Hagelsieb G. Network-based function prediction and interactomics: the case for metabolic enzymes. Metab Eng. 2011;13(1):1–10. 17. Chi X, Hou J. An iterative approach of protein function prediction. BMC
Bioinformatics. 2011;12(71):16107–12.
18. Wang H, Huang H, Ding C. Function-function correlated multi-label protein function prediction over interaction networks. J Comput Biol. 2013;20(4):322–43. 19. Huntley RP, et al. The GOA database: gene ontology annotation updates for
2015. Nucleic Acids Res. 2015;43(D1):D1057–63.
20. Liu W, et al. Proteome-wide prediction of signal flow direction in protein interaction networks based on interacting domains. Mol Cell Proteomics. 2009;8(9):2063–70.
21. Gillis, J. and P. Pavlidis,“Guilt by association”is the exception rather than the rule in gene networks.PLoS Comput Biol, 2012. 8(3): p. e1002444. 22. Gillis J, Pavlidis P. The impact of multifunctional genes on "guilt by
association" analysis. PLoS One. 2011;6(2):e17258.
23. Cao M, et al. Going the distance for protein function prediction: a new distance metric for protein interaction networks. PLoS One. 2013;8(10):e76339. 24. Teng Z, et al. Measuring gene functional similarity based on group-wise
comparison of GO terms. Bioinformatics. 2013;29(11):1424–32. 25. Krogan NJ, et al. Global landscape of protein complexes in the yeast
Saccharomyces Cerevisiae. Nature. 2006;440(7084):637–43.
26. Lukasz S, et al. The database of interacting proteins: 2004 update. Nucleic Acids Res. 2004;32(22):D449–51.
27. Andrew CA, et al. The BioGRID interaction database: 2015 update. Nucleic Acids Res. 2015;43(1):D637–40.