www.orientjchem.org
An International Open Free Access, Peer Reviewed Research Journal
2018, Vol. 34, No.(5): Pg. 2554-2561
This is an Open Access article licensed under a Creative Commons Attribution-Non Commercial-Share Alike 4.0 International License (https://creativecommons.org/licenses/by-nc-sa/4.0/), which permits unrestricted Non Commercial use, distribution and reproduction in any medium, provided the original work is properly cited.
Novel Stress Indicating RP-HPLC Method Development and
Validation for the Simultaneous Estimation of Ertugliflozin
and Sitagliptin in Bulk and its Formulation
D. CHINA BABU
1*, C. MADHUSUDHANA CHETTY
2and Sk. MASTANAMMA
31Research & Development, Jawaharlal Nehru Technological University Kakinada, Kakinada, Andhra Pradesh India & Department of Pharmaceutical Analysis, Santhiram College of Pharmacy,
Nandyal, Andhra Pradesh, India.
2Santhiram College of Pharmacy, Nandyal, Kurnool District, Andhra Pradesh, India. 3Department of Pharmaceutical Analysis, University College of Pharmaceutical Sciences,
Nagarjuna Nagar, Guntur, Andhra Pradesh, India. *Corresponding author E-mail: [email protected]
http://dx.doi.org/10.13005/ojc/340543 (Received: July 14, 2018; Accepted: August 10, 2018)
ABSTRACT
A selective, sensitive RP-HPLC method was developed for the simultaneous estimation of the Ertugliflozin (ETR) and Sitagliptin (SGT) in bulk and its dosage form. The separation and determination was carried on water’s C18 column capacitate (250X4.6 mm, 5 µm particle size), retention times of Ertugliflozin and Sitagliptin were found to be 2.39 and 4.60 min. respectively. The wavelength was fixed at 215 nm with PDA detection. The mobile phase was consisted mixture of 0.5 mM potassium dihydrogen ortho phosphate buffer: Methanol in the ratio of 55:45 v/v, pH 5.3 was adjusted with HCl and flow of mobile phase was maintained 1mL/min. The calibration curve was linear and regression co-efficient (R2) value found to be 0.999 and concentration ranging from 37.5-112.5 and
250-750 µg/mL for Ertugliflozin and Sitagliptin respectively. The quantization limit and detection limit of the method were found 0.1 & 0.3 µg/ml and 0.4 and 1µg/ml for Ertugliflozin and Sitagliptin.
keywords: Ertugliflozin, Sitagliptin, Reversed Phase High Performance
Liquid Chromatography, Methanol.
INTRODUCTION
A novel class of anti-diabetic drugs, which are inhibitors of dipeptidyl-peptidase IV (DPP4),which included sitagliptin,vildagliptin and saxagliptin1,2,3,4,5. Type 2 diabetes mellitus (T2DM)
sodium–glucose transporter 2 inhibitor. The study assessed the efficacy and safety of co initiation of Ertugliflozin and sitagliptin compared with placebo in patients with T2DM in adequately controlled on diet and exercise11,12. Ertugliflozin (1S,2S,3S,4R,5S) 5[4 chloro 3[4ethoxyphenyl]methyl]phenyl]1 (hydroxymethyl)6,7 dioxabicyclo[3.2.1]2,3,4 triol.13 Sitagliptin chemically7[(3R)3amino1oxo 4(2,4,5 trifluorophenyl)butyl] 5,6,7,8 tetrahydro 3(trifluoromethyl) 1,2,4 triazolo[4,3a]pyrazine phosphate (1:1) monohydrate14,15,16. The placebo-adjusted differences in changes from baseline in systolic blood pressure were not statistically significant. Ertugliflozin is used for the treatment a higher prevalence of genital mycotic infections occurred in men and women with Ertugliflozin compared with placebo17. The most of the methods were reported for the separation and estimation of Sitagliptin, metformin and few are only on estimation of Sitagliptin.18,19,20,21,22,23,24,25 The structures of Ertugliflozin and Sitagliptin showed in Figures 1 and 2.
MATERIALS AND METHODS
Reagents & chemicals
All the chemicals and reagents in this experiment were of analytical grade. Water was double distilled and filtered with a membrane filter. Methanol – HPLC grade (Merck, India), hydrochloric acid and potassium di hydrogen ortho phosphate (SD fine chem, India) were used to prepare mobile phase. Pharmaceutical grade standard drugs viz., Ertugliflozin and Sitagliptin were kindly gifted by Ajanta Pharma Ltd, Mumbai, India. The combined tablet formulation contains 15 mg of Ertugliflozin and 100mg of Sitagliptin (Steglujan, Natco) purchased from local market of Kurnool.
Preparation of standard solution
Weigh accurately 10 mg of Ertugliflozin & Sitagliptin and transferred in to individual 10 ml volumetric flasks with small quantity of mobile phase. The solution was sonicated for 10 min. and volume made with mobile phase and concentration 1000 µg/ml. This solution further diluted for the preparation of working standard solutions to get final concentrations of 75 µg/mL of Ertugliflozin and 500 µg/mL of Sitagliptin working standard solutions.
Preparation of sample solution
Twenty tablets were weighed and finely powdered. The average weight of tablets was determined. The powder equivalent to 10 mg of ETR was weighed and transferred to a 10 mL volumetric flask. 10 mL of diluent was added to disintegrate tablets completely by using ultra sonicated for 10 minute. The aliquot portion of the filtrate was further diluted to get final concentrations 75 µg/mL of ETR and 500 µg/mL of SGT. The solution was filtered through membrane filter. The 20 µL of this solution was injected in to HPLC system.
Chromatographic Settings
The mobile phase used for the development of method was 0.5 mM potassium dihydrogen ortho phosphate buffer: Methanol in the ratio of 55:45 v/v, pH 5.3 was attuned with HCl and flow of mobile phase was filtered through membrane filter and flow rate was kept 1mL/min. The effluents were supervised at 215 nm with PDA detector and injected 20 µl of solution through chromatographic column.
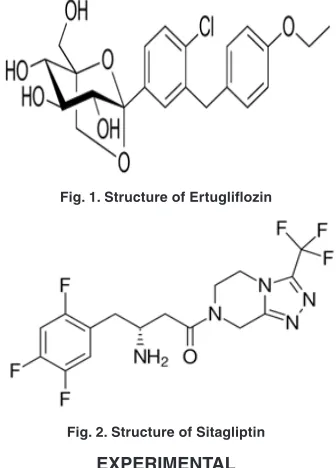
Fig. 1. Structure of Ertugliflozin
Fig. 2. Structure of Sitagliptin
EXPERIMENTAL
Apparatus
RESULTS AND DISCUSION
Method development
The method was developed with different buffers and organic solvents but the composition
of potassium dihydrogen ortho phosphate and methanol was showed good resolution, symmetrical peaks, high theoretical plates, and low retention times of both Ertugliflozin and Sitagliptin. The optimized parameters were showed in Table 1.
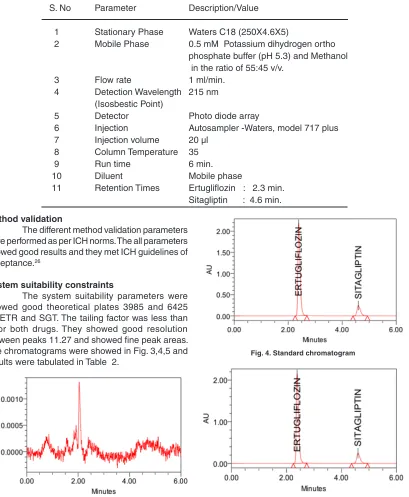
Table 1: Optimized conditions for separation and estimation of Ertugliflozin, Sitagliptin
S. No Parameter Description/Value 1 Stationary Phase Waters C18 (250X4.6X5)
2 Mobile Phase 0.5 mM Potassium dihydrogen ortho phosphate buffer (pH 5.3) and Methanol in the ratio of 55:45 v/v.
3 Flow rate 1 ml/min. 4 Detection Wavelength 215 nm
(Isosbestic Point)
5 Detector Photo diode array
6 Injection Autosampler -Waters, model 717 plus 7 Injection volume 20 µl
8 Column Temperature 35 9 Run time 6 min. 10 Diluent Mobile phase
11 Retention Times Ertugliflozin : 2.3 min.
Sitagliptin : 4.6 min.
Method validation
The different method validation parameters were performed as per ICH norms. The all parameters showed good results and they met ICH guidelines of acceptance.26
System suitability constraints
The system suitability parameters were showed good theoretical plates 3985 and 6425 for ETR and SGT. The tailing factor was less than 2 for both drugs. They showed good resolution between peaks 11.27 and showed fine peak areas. The chromatograms were showed in Fig. 3,4,5 and results were tabulated in Table 2.
Fig. 3. Blank chromatogram
Fig. 4. Standard chromatogram
Table 2: System suitability results of ETF & SGT
S. No Parameter ETF SGT
1 Theoritical 3985 6425
Plate Count
2 Peak Area 12553232 6608681 3 Peak Height 2151554 240210
4 RT 2.39 4.603
5 Tailing 1.58 1.35
6 Resolution - 11.27
7 S/N 6.014 670
Specificity
The stress degradation studies were implies the specificity of the method. Different parameters were evaluated depend upon separation between degradants and active moiety, as well as method showed ability to analyze analyte in the presence of other products.
Common Suggested procedure for Linearity
The calibration curve linear over concentration range and R2 values were found to be 0.999 for both Ertugliflozin and Sitagliptin. The standard solution was showed linearity concentration range from 37.5-112.5µg/mL for Ertugliflozin & 250-750 µg/mL for Sitagliptin. The data of graphs were showed in Figures 6 & 7.
Fig. 6. Linearity graph of Ertugliflozin
Fig. 7. Linearity graph of Sitagliptin
Precision
The precision was assessed through system precision and method precision. The method precision was estimated through assay. The optimized concentrations of standard and sample solutions were injected in to chromatographic system for the system precision and method precision. The %RSD values varied from 0.55-0.66%. The results of the method showed good precision of the values. The results were tabulated in Table 3 and 4.
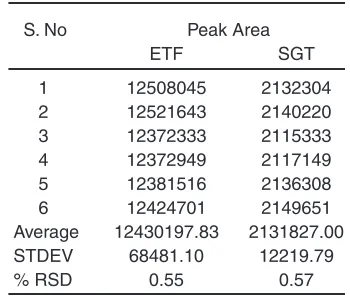
Table 3: System precision
S. No Peak Area
ETF SGT
1 12508045 2132304 2 12521643 2140220 3 12372333 2115333 4 12372949 2117149 5 12381516 2136308 6 12424701 2149651 Average 12430197.83 2131827.00 STDEV 68481.10 12219.79
% RSD 0.55 0.57
Table 4: Precision results of ETF & SGT
S. No Peak Area % Assay
ETF SGT ETF SGT
1 12381516 2117149 98.64 98.71 2 12372949 2132304 98.57 99.42 3 12508045 2115333 99.64 98.63 4 12521643 2140220 99.75 99.79 5 12372333 2136308 98.56 99.61 6 12424701 2149651 98.98 100.23 Average 12430197.83 2131827.50 99.02 99.40 STDEV 68481.10 13386.11 0.55 0.62 % RSD 0.55 0.62 0.55 0.62
Accuracy
Table 5: Accuracy results of ETZ & SGT
Parameters Peak Area Amount added(µg) Amount recovered (µg) % of recovery % mean recovery Ertugliflozin
50% 6209103 37.13 37.09 99.90 99.90
100% 12465890 74.26 74.48 100.29 100.29
150% 18802423 111.39 112.33 100.84 100.84
Sitagliptin
50% 1071497 37.13 37.46 100.91 100.91
100% 2127492 74.26 74.39 100.18 100.18
150% 3181111 111.39 111.23 99.86 99.86
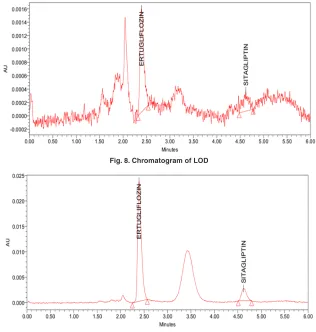
Limit of detection & Limit of quantification
The LOD and LOQ were estimated 12.71µg/ml-42.37µg/ml for Ertugliflozin and 8.59µg/ml-28.65µg/ml for Sitagliptin. The limit of detection and
quantitation limits performed based on the slope and standard deviation.The method showed ability to detect Ertugliflozin & Sitagliptin at low level of concentrations. The chromatograms were showed in Figures 8, 9.
Fig. 8. Chromatogram of LOD
Fig. 9. Chromatogram of LOQ
Robustness
The robustness of the method was performed with deliberate change of flow rate, temperature and mobile phase composition. The changed parameters were showed good percentage
Table 6: Robustness of ETZ & SGT
S. No Parameter Condition Ertugliflozin Sitagliptin
RT Peak Area % Assay RT Peak Area % Assay 1 Flow 0.8 ml/min. 1.92 12357028 99.24 3.71 2134138 99.51
2 1 ml/min. 2.39 12553232 100.00 4.60 2144839 100.00
3 1.2 ml/min. 3.82 13837314 101.47 6.01 2177984 101.08 4 Temp 30 °C 2.39 12553345 100.01 4.64 2141427 99.85
5 35 °C 2.39 12553232 100.00 4.60 2144839 100.00
6 40 °C 2.40 12581162 100.23 4.66 2154377 100.36
7 Mobile Phase B:M 55: 42 v/v 2.81 12532136 99.84 4.55 2139894 99.77 8 B:M 55:45 v/v 2.39 12553232 100.00 4.60 2144839 100.00 9 B:M 55:48 v/v 2.68 12574123 100.17 4.66 2152468 100.36
Assay of Ertugliflozin and Sitagliptin in commercial dosage form
The assay of the method was performed for tablet formulation. Powdered 20 tablets from that accurately weighed powder equivalent to 161.56 mg of Ertugliflozin. The final concentration was prepared as 75 µg/mL of Ertugliflozin and 500 µg/ mL of Sitagliptin. The % assay values were 99.02% & 99.40% for Ertugliflozin and Sitagliptin. The method was used for routine analysis of Ertugliflozin and Sitagliptin estimation in combined dosage form. The results were showed in Table 7.
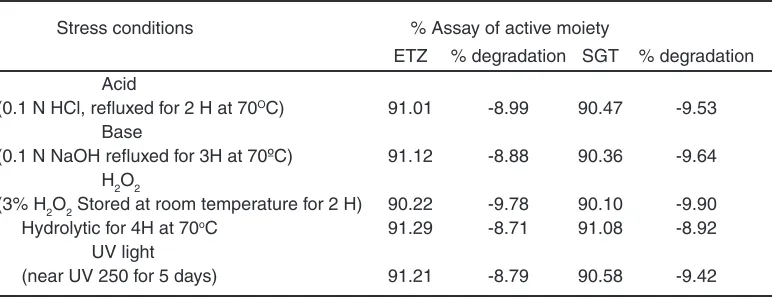
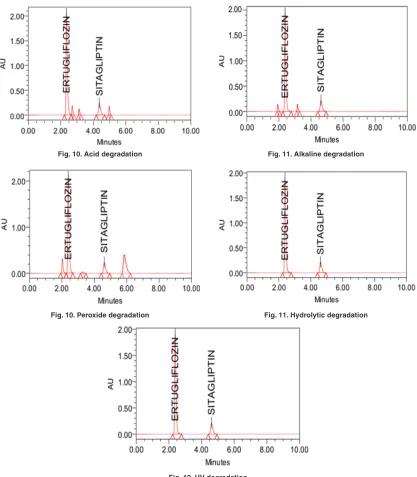
Force degradation studies
The stability studies were implemented on the Ertugliflozin and Sitagliptin. The method showed, there was no interference of degradants and blank. The developed RP-HPLC method verifies the proficiency of stability indicating method for the analysis of Ertugliflozin and Sitagliptin. Different stress indicating studies were conducted with 0.1 N HCl, refluxed for 3 H at 70OC, Base (0.1 N NaOH refluxed for 4H at 70OC), H
2O2 (3% H2O2 Stored at room temperature for 2 H), hydrolytic for 6H at 70OC and UV light (near UV 250
Table 7: Assay table for ETR and SGT
S.NO ETR SGT Peak Area % Assay Peak Aea % Assay 1 12381516 98.64 2117149 98.71 2 12372949 98.57 2132304 99.42 3 12508045 99.64 2115333 98.63 4 12521643 99.75 2140220 99.79 5 12372333 98.56 2136308 99.61 6 12424701 98.98 2149651 100.23 Mean 12430197.83 99.02 2131827.50 99.40 STDEV 68481.10 0.55 13386.11 0.62 % RSD 0.55 0.55 0.62 0.62
Table 8: Degradation studies of ETR & SGT
Stress conditions % Assay of active moiety
ETZ % degradation SGT % degradation Acid
(0.1 N HCl, refluxed for 2 H at 70OC) 91.01 -8.99 90.47 -9.53 Base
(0.1 N NaOH refluxed for 3H at 70ºC) 91.12 -8.88 90.36 -9.64 H2O2
(3% H2O2 Stored at room temperature for 2 H) 90.22 -9.78 90.10 -9.90 Hydrolytic for 4H at 70oC 91.29 -8.71 91.08 -8.92 UV light
(near UV 250 for 5 days) 91.21 -8.79 90.58 -9.42
Fig. 10. Acid degradation Fig. 11. Alkaline degradation
Fig. 10. Peroxide degradation Fig. 11. Hydrolytic degradation
Fig. 12. UV degradation
CONCLUSION
The developed and validated simultaneous estimation of Ertugliflozin and Sitagliptin by RP-HPLC method was showed low tailing factor and high theoretical plates. The method was exposed good precision, accuracy and robustness, met the all values with in the limit according to ICH guidelines. The linearity graphs showed good linearity between different concentrations solutions of ETR and
Table for LOD& LOQ
Parameter ETF SGT
Slope 16159 4264
STDEV 68481.00 12219.00 LOD 12.71µg/ml 8.59 µg/ml LOQ 42.37 µg/ml 28.65 µg/ml
ACkNOWLEDGEMENT
The authors are thankful to Ajantha Laboratories, Mumbai for providing drug standards. The authors are also thankful to Department of Pharmaceutical Analysis, Santhiram College of Pharmacy, Nandyal, AP, India for encouragement.
REFERENCES
1. Miao, Z.; Nucci, G.; Amin, N., Drug Metab Dispos., 2013, 41, 445–456.
2. El-Bagary, RI.; Elkady, EF.; Ayoub, BM., Int J Biomed Sci., 2011, 7, 62–69.
3. Jiu, X.F.; Nei, W.; Xu, S.; Min,Y., Journal of Chinese Pharmaceutical Science., 2011, 20,
63–69.
4. Sahasrabudhe, V.; Terra, S G.; Hickman, A.; Saur, D.; Shi, H., J Clin Pharmacol., 2017,
57(11), 1432-1443.
5. Terra, S G.; Focht, K.; Davies, M.; Frias, J.; Derosa, G., Diabetes Obes Metab., 2017, 19,
721–728.
6. Lauring, B.; Liu, J.; Da Gogo Jack, S.; Amorin, G., 52nd Annual Meeting of the European Association for the Study of Diabetes (EASD).
2016, 12, 16, Munich, Germany.
7. Shyamala, M.; Mohideen, S.; Satyanarayana, T.; Narasimha Raju, CH.; Suresh Kumar, P.; Swetha, K., Am J Pharm Tech Res., 2011, 1,
193–201.
8. Srinivasa Reddy.; Imran Ahmed.; Iqbal Ahmad.; Arindam Mukhopadhyay., Journal of Chromatographic Science., 2015, 53(9),
1549–1556.
9. Patel, TR.; Patel, TB.; Suhagia, BN., Indo Am J Pharm Res., 2014, 4, 1993–1999.
10. P.Ramalingam,V.; Udaya Bhaskar,Y.; Padmanabha Reddy, K.; Vinod Kumar., Indian J Pharm Sci., 2014, 76(5), 407–414.
11. Ghazala, K.; Dinesh, S.; Agrawal, YP.; Neetu, S.; Avnish, J.; Gupta, AK., Asian J Biochem Pham Res., 2011, 2, 223–229.
12. Tarkase, K.N.; Madhuri, B.; Sarode Sumit, A.; Gulve and Ashwini Gawade., Scholars Research Library Der Pharmacia Lettre.,
2013, 5(3),315-318.
13. Venkateswararao, P.; Lakshmanarao, A.; Prasad,S.V.U.M., Indo Am J Pharm Res.,
2018, 5(4), 2616-2617.
14. Karimulla, S K.; Vasanth, P M., Ramesh, T.; Ramesh, M., Scholars Research Library Der Pharmacia Lettre., 2013, 5(5),168-174.
15. Arun, M.; Kashid Anup, A.; Dhange Vandana, T.; Gawande Pankaj, B.; Miniyar Prasanna, A.; Datar Shashikant Dhawale C., Am. J. PharmTech Res., 2012, 2(5), 805-811.
16. Chellu, SN.; Malleswararao, M.; Suryanarayana, V., Sci Pharm., 2012, 80,139–152.
17. Pratley, RE.; Eldor, R.; Raji, A.; Golm, G.; Huyck, SB., Diabetes Obes Metab., 2017,
19(5), 721-728.
18. Sankar, A.S.K.; Suraj Sythana.; Aakula Jhansi.; Shanmuga sundharam, P.;sumithra, M., International Journal of Pharm Tech Research., 2013, 5(4), 1736-1744.
19. Swales, JG.; Gallagher, RT.; Denn, M.; Peter, RM., J Pharm Biomed Anal., 2011, 55,
554–551.
20. Pathade, P.; Imran, M.; Bairagi, V.; Ahire, Y., Journal of Pharmacy Research., 2011, 4(3),
871–873.
21. Sohajda, T.; Hui, WH.; Zeng, LL.; Li, H.; Szente, L.; Noszal, B.; Electrophoresis., 2011,
32, 2648–2654.
22. Jain, P.; Chaudhary, A.; Desai, B.; Patel, S.; Patel, S.; Shimpi, H., Int J Drug Dev Res.,
2011, 3, 194–199.
23. Bala Sekaran, C.; Prameela Rani, A.; Int J Pharm Sci., 2010, 2, 138–142.
24. Zeng, W.; Musson, DG.; Fisher, AL.; Michael, LS.; Schwartz, JS.; Wang, AQ., J Pharm Biomed Anal., 2008, 46, 534–542.
25. Herman, GA.; Stevens, C.; Van Dyck, K.; Bergman, A.; Yi, B.; Clin Pharmacol Ther.,
2005, 78, 675–688.