A STUDY ON FINANCIAL PERFORMANCE ANALYSIS TOWARDS CARBORUNDAM UNIVERSAL LTD, HOSUR.
Dr.K.Priya M.Com., M.phil., MBA.,SET., Ph.D Assistant Professor,
Department of Commerce,
Vivekanandha College of Arts & Sciences for Women, Elayampalayam
G.Palaniyammal.,M.Phil.,(scholar), Department of commerce, Vivekanandha college of arts & sciences for women(autonomous),
Elayampalayam Tiruchengode.
ABSTRACT:
This finance project report on ratio analysis assesses the financial strengths and weakness of carborundum universal. Ltd, Hosur, through FINANCIAL RATIO ANALYSIS. To evaluate the performance of the company by using ratios as a yardstick to measure the efficiency of the company. To understand the liquidity, profitability and efficiency positions of the company during the study period. To evaluate and analyze various facts of the financial performance of the company. This study has made an attempt to make comparisons between the ratios during different periods.
Key words: Financial Ratios, Current Assets, Current Liability, Financial Performance, Financial Analysis.
INTRODUCTION:
During the early stages of automobile industry development, Indian automobile industry heavily depended on foreign technologies. However, over the years, the manufacturers in India have started using their own technology evolved in the native soil. The thriving market place in the country has attracted a number of automobile manufacturers including some of the reputed global leaders to set their foot in the soil looking forward to enhance their profile and prospects to new heights. Following a temporary setback on account of the global economic recession, the Indian automobile market has once again picked up a remarkable momentum witnessing a buoyant sale for the first time in its history in the month of September 2009.
A Monthly Double-Blind Peer Reviewed Refereed Open Access International e-Journal - Included in the International Serial Directories
COMPANY PROFILE-CARBORUNDUM UNIVERSAL LIMITED:
Carborundum universal ltd is an Indian based coated and bonded abrasive Manufacturing company carborundum universal murugappa Indian ltd (CUMI) Is an important segment of the murugappa group which is one of the leading Business group offering a wide range of product mix murugappa group is one Of India’s leading business. Conglomerates market leaders in diverse areas of Business including engineering. Abrasives Finance, General Insurance, cycle, sugar, From Inputs, Fertilizers, plantations, Bio- products and nutraceuticalls, its 29 Companies have manufacturing facilities spread across 13 states in India, The Organization fasters an environment of professionalism and has a work force of Over 32,000 employees.
OBJECTIVES OF THE STUDY
1. To analyze the impact on the profitability of the company. 2. To find out the operating strengths and weakness of the firm's. 3. To know the earnings capacity of the firm.
SCOPE OF THE STUDY
1. The management of the company can easily identify the existing financial problems & further identify the causes for those problems.
2. The study is based on the accounting information of the carborundum universal. Ltd, Hosur. The study covers the period of 2007-08 to 2012-13 for analyzing the financial statement such as income statements and balance sheet.
3. Considering the availability of time, information and sources of study is confined the performance of the carborundum universal Ltd, Hosur.This study aims at analyzing the overall.
RESEARCH METHODOLOGY
Research Design
Descriptive research is used in the study because it will ensure the minimization of bias and maximization of reliability of dada collected. The researcher had to use fact and information already available through financial statements of earlier years and analyze these to make critical evaluation of the available material. Hence by making the type of the research conducted to both Descriptive and analytical in nature. From the study, the types of data to be collected and the procedure to be use for this purpose were decided.
Sampling method
LIMITATIONS OF STUDY
1. Figures for the analysis are taken from the annual reports.
2. Financial statements may not be realistic because they are prepared by following certain concepts & conventions.
ANALYSIS AND INTERPRETATION OF DATA
Analysis and Interpretation of data are the creative aspect of research in financial performance decision is considered as one of the important decision to be made by any firm. The contents of financial performance comprise of a mix of long term funds like equity, preference shares, debentures and bonds.
The following ratios are studied to judge the long term financial position of the firm. These ratios indicate the mix of funds provide by the owners and the lenders in financing the assets.
Current Ratio Debt-Equity Ratio Proprietary Ratio
These ratios are studied to achieve the objective of analyzing the efficiency with which funds of the organization has been used during the period of study.
SHORT TERM SOLVANCY RATIO
Current Ratio
The ratio of current assets to current liabilities is called “current ratio”. Current ratio indicates the ability of a concern to meet its current obligations as and when they due are payment. Current assets
Current ratio = --- Current liability
Table No - 1
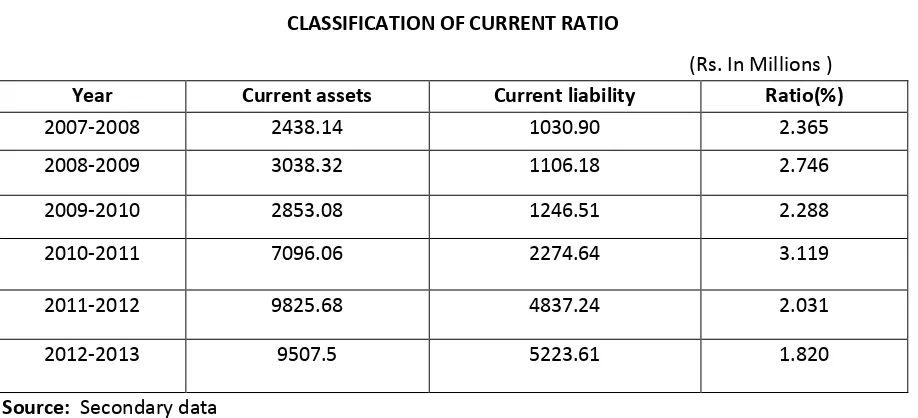
CLASSIFICATION OF CURRENT RATIO
(Rs. In Millions )
Year Current assets Current liability Ratio(%)
2007-2008 2438.14 1030.90 2.365
2008-2009 3038.32 1106.18 2.746
2009-2010 2853.08 1246.51 2.288
2010-2011 7096.06 2274.64 3.119
2011-2012 9825.68 4837.24 2.031
2012-2013 9507.5 5223.61 1.820
A Monthly Double-Blind Peer Reviewed Refereed Open Access International e-Journal - Included in the International Serial Directories
The table 1 reveals that the current ratio of Carborundum universal limited. In the year 2007-2008 the current ratio is 2.365, in the year 2008-2009 the current ratio was increased is 2.746, in the year 2009-2010 the current ratio was decreased 2.288, in the year 2010-2011 the current ratio was increased is 3.119, in the year 2011-2012 the current ratio was decreased 2.031, in the year 2012-2013 the current ratio was decreased is 1.820.
It is understand that the majority (3.119) of the current assets ratio in the year 2010-2011. LONG TERM SOLVANCY RATIO
Proprietary Ratio
Proprietary ratio is the ratio of shareholders funds to total assets. It is also called as “Net worth to total assets” ratio. It serves as a measure of long-term solvency ratio. Higher proprietary ratios indicate that sound financial positions and low proprietary ratio indicate that weak financial positions of the, cumi .
Shareholders’ funds Proprietary Ratio = --- Total Tangible Assets
Table No – 2
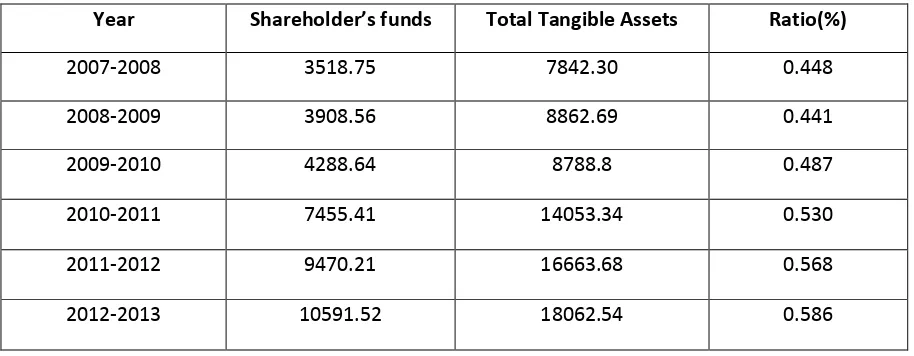
CLASSIFICATION OF PROPRIETARY RATIO
(Rs. In millions)
Year Shareholder’s funds Total Tangible Assets Ratio(%)
2007-2008 3518.75 7842.30 0.448
2008-2009 3908.56 8862.69 0.441
2009-2010 4288.64 8788.8 0.487
2010-2011 7455.41 14053.34 0.530
2011-2012 9470.21 16663.68 0.568
2012-2013 10591.52 18062.54 0.586
Source: Secondary Data
It shows that table 2 Proprietary Ratio during the year 2007-2008 is 0.448,in the year 2008-2009 proprietary ratio was decreased is 0.441, in the year 2008-2009-2010the proprietary ratio was increased is 0.487,in the year 2010-2011proprietory ratio was increased is 0.530,in the year 2011-2012 proprietary ratio was increased is 0.568, in the year 2011-2012-2013 proprietary ratio was increased is 0.586.
PROFITABILITY RATIO
Gross profit ratio
This ratio is also called as “gross margin” or “trading margin” ratio. It indicates the difference between sales and direct cost. Gross profit ratio explains the relationship between gross profit and net sales.
Gross profit
Gross profit ratio = --- X 100
Net sales
Table No – 3
CLASSIFICATION OF GROSS PROFIT RATIO
(Rs. In millions)
Year Gross profit Net sales Ratio (%)
2007-08 1371.84 5830.10 23.53
2008-09 860.80 6519.00 13.204
2009-10 841.70 7310.10 11.514
2010-11 2580.32 15531.75 16.613
2011-12 3226.99 19949.98 16.175
2012-13 1519.35 19714.05 7.706
Source: Secondary data
It shows that table 3 Gross profit Ratio during the year 2007-2008 is 23.53,in the year 2008-2009 Gross profit ratio was decreased is 13.204, in the year 2008-2009-2010the Gross profit ratio was decreased is 11.514,in the year 2010-2011 Gross profit ratio was increased is 16.613,in the year 2011-2012 Gross profit ratio was decreased is 16.175, in the year 2012-2013 Gross profit ratio was decreased is 7.706.
It is found from the study that, the majority (23.53) proprietary ratio is more in the year 2007-2008.
CONCLUSION
A Monthly Double-Blind Peer Reviewed Refereed Open Access International e-Journal - Included in the International Serial Directories
REFERENCES
1. Gupta S.P.Management accounting, sathiya bhavan, Agra, 1987.
2. Maheswari.S.N. Financial Management Sultan & Sons Publication, New Delhi, 2004. 3. Pillai.R.S.N. & Bagavathi, Management accounting S.chand & company ltd , New Delhi. 4. T.S. Reddy, Y. Hariprasad Reddy Management accouting margam publications
channai-600017.
5. Dr. V. R. Palanivelu financial management S. Chand & company ltd, New Delhi-110055.\ 6. Foster.G, “ Financial Statement Analysis ,” prentice Hall, 1986.
7. Dr. Umesh Holani ,”Analysis of financial statement ,”Himalaya Publishing House,1988. 8. Maheswari.S.N, “Financial Management ,Sultanchand&sons ,Delhi 2003.
9. Revathi .S , A study on the financial performance of villupuram district central co-operative ltd, project submitted to periyar university ., salem, April 2005.