Structure, stability, and tsunami hazard associated with a rock slope
in Knight Inlet, British Columbia
D. P. van Zeyl1, D. Stead1, M. Sturzenegger1, B. D. Bornhold2, and J. J. Clague1
1Department of Earth Sciences, Simon Fraser University, Burnaby, British Columbia, Canada 2Brian D. Bornhold Inc., Ladysmith, British Columbia, Canada
Correspondence to: D. P. van Zeyl (vanzeyl@jdmollard.com)
Received: 28 November 2014 – Published in Nat. Hazards Earth Syst. Sci. Discuss.: 07 January 2015 Revised: 25 May 2015 – Accepted: 29 May 2015 – Published: 30 June 2015
Abstract. Rockfalls and rockslides during the past 12 000 years have deposited bouldery debris cones on the seafloor beneath massive rock slopes throughout the inner part of Knight Inlet. The 885 m high rock slope, located across from a former First Nations village destroyed in the late 1500s by a slide-induced wave, exposes the contact between a Late Cretaceous dioritic pluton and metamorphic rocks of the Upper Triassic Karmutsen Formation. The pluton margin is strongly foliated parallel to primary and secondary fabrics in the metamorphic rocks, resulting in highly persistent brittle structures. Other important struc-tures include a set of sheeting joints and highly persistent mafic dykes and faults. Stability analysis indicates that planar and wedge rock slope failures up to about 500 000 m3 in volume could occur. We suspect that failures of this size in this setting would have the potential to generate locally hazardous waves. As several similar rock slopes fronted by large submarine debris cones exist in the inner part of Knight Inlet, it is clear that tsunami hazards should be considered in coastal infrastructure development and land-use planning in this area.
1 Introduction
Inlets on the British Columbia (BC) coast are likely to see fu-ture development in the form of fish farms, power generation, transmission lines, port facilities, pipelines, roads, and other coastal infrastructure, yet the hazards to this development re-main underappreciated because the region, until recently, has been remote and sparsely populated. Historical observations in similar mountainous coastal and lacustrine environments
have shown that tsunamis generated by subaerial landslides are common and can be highly destructive. For instance, Hu-ber (1982) reported over 500 fatalities associated with about 50 subaerial landslides that generated displacement waves in lakes and reservoirs in Switzerland over the past 600 years. Slide-induced waves have claimed more than 200 lives in the past 320 years in Norway (Blikra et al., 2005) and 10 lives in April 2007 in southern Chile (Sepúlveda et al., 2010). Dam-aging waves induced by subaerial landslides have also oc-curred on the coasts of Alaska (Miller, 1960a, b) and Green-land (Dahl-Jensen et al., 2004).
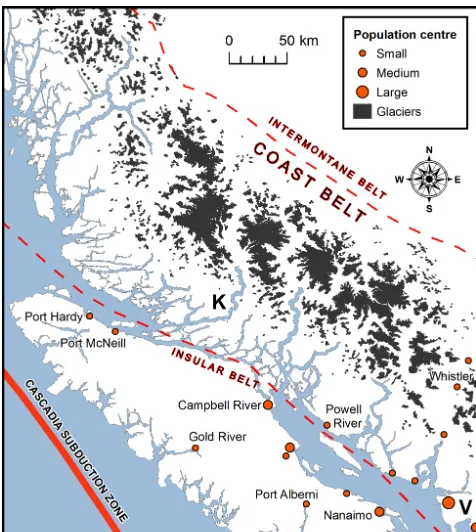
Knight Inlet, which extends to within 40 km of the highest glacier-clad peaks in the Coast Mountains (Fig. 1), is one of the longest and deepest fjords on the BC coast. Its precipi-tous, high walls are susceptible to rockfalls and rockslides, and several landslide deposits have been identified on the seafloor beneath these slopes (Fig. 2; van Zeyl, 2009). This evidence suggests that the inlet has been prone to landslide-generated tsunamis over the past 12 000 years. A recent study integrating archaeological and geological observations with oceanographic analysis suggests that the former village of Kwalate, located near the shoreline of Knight Inlet, was de-stroyed by a slide-induced wave in the late 1500s, with the possible loss of as many as 100 lives (Bornhold et al., 2007). In addition to this event, a slide from Three Finger Peak in November 1999 generated a wave that jostled log booms about 20 km to the north at the head of Knight Inlet.
1426 D. P. van Zeyl et al.: Structure, stability, and tsunami hazard in BC
Figure 1. Location of Knight Inlet (K) on the southern British
Columbia coast. Glaciers coincide with the highest parts of the Coast Mountains. V: Vancouver.
conditions encountered in an area of the BC coast suspected to be particularly prone to tsunamis generated by subaerial landslides. Apart from boat traffic, for example – associated with ecotourism, logging operations, and seasonal wild fish harvesting – there are few elements in Knight Inlet that are at risk from tsunamis, but this situation could change in the future with developments such as fish farming operations or port facilities. Currently there are no fish farms in the inner part of Knight Inlet, but in recent years the number of such operations in the inner parts of other inlets on the BC coast has increased.
2 Regional setting
The Coast Mountains form a belt of crystalline and meta-morphic rocks 1600 km long and up to 150 km wide, bor-dering the Pacific Ocean from Alaska to the Fraser Lowland near Vancouver. They rise abruptly from the sea and towards the axis of the range are characterized by rugged peaks and saw-toothed ridges. Numerous fjords, some more than 600 m deep, dissect the western margin of the Coast Mountains (Fig. 1).
The steep-walled fjords of the BC coast are former Ter-tiary river valleys that were greatly deepened and widened by glaciers during the Pleistocene (Clague, 1991; Math-ews, 1991). The last (Late Wisconsinan) glaciers of the Cordilleran ice sheet retreated eastward from the coast about
13 000–14 000 years ago, and Knight Inlet was probably ice-free by about 11 000 years ago (Clague, 1981; Dyke, 2004).
With a length of 125 km, Knight Inlet is one of the longest inlets on the BC coast (Fig. 1). It has a maximum depth of about 525 m and typical widths in the range of 2–4 km. The inlet extends 70 km eastward from the open coast and then bends to the north and winds its way through terrain of con-siderably higher relief to the mouths of the Klinaklini and Franklin rivers.
Van Zeyl (2009) identified postglacial submarine rock-fall and rockslide deposits on the seafloor within the inner part of Knight Inlet (Fig. 2). The blocky conical deposits are present beneath steep mountainsides extending as high as 1200 m a.s.l. within one lateral kilometre of the shore-line. The deposits must have formed after deglaciation and thus during the past 12 000 years, but nothing more is known about their age or history. One possibility is that rockfall and rockslide activity that produced many of these deposits was higher during the early Holocene as an immediate response to glacial debuttressing (cf. Evans and Clague, 1994). An-other possibility is that activity increased in the second half of the Holocene after thousands of years of progressive rock slope deformation and fatigue (Bjerrum and Jørstad, 1968) before the fjord walls could collapse. Knight Inlet lies within one of the most seismically active regions in Canada (Adams and Atkinson, 2005) – earthquakes are concentrated along or near the North American plate boundary, associated with the Cascadia subduction zone (Fig. 1) 200 km west of Knight In-let, and the Queen Charlotte transform fault 400 km to the northwest.
The maritime temperate climate of the southern main-land BC coast is characterized by average annual tem-peratures and monthly precipitation totals at sea level of about 8–10◦C and 1100–1800 mm, respectively (Environ-ment Canada, 2008). The wet season (October–February), with monthly precipitation totals in excess of 500 mm, could render this time of year more susceptible to rockfalls and rockslides due to increased water pressures exerted along dis-continuities within steeply sloping rock masses.
3 Methodology
3.1 Structural observations
Figure 2. Terrestrial and submarine topography of the middle part of Knight Inlet, showing many colluvial deposits beneath steep rock slopes
and side-entry deltas at the mouths of tributary streams. Many of the seafloor deposits mapped in this figure are hybrid colluvial–alluvial landforms; the alluvial deposit beneath Three Finger Creek, for example, contains material from a rock slope failure at Three Finger Peak that produced a wave in November 1999 that was observed 20 km to the north at the head of Knight Inlet. SONAR data used to generate DEM were provided by the Canadian Hydrographic Service (2008).
the rock slope. Georeferenced air photographs, digital ele-vation models (DEMs), stereoscopic aerial photographs from the 1950s through the 1990s, and scaled oblique photographs provided additional structural information.
3.2 Rock mass conditions
We assessed rock mass conditions using the rock quality designation (RQD; Deere et al., 1967) and the geological strength index (GSI; Marinos et al., 2005). RQD is the per-centage of intact core pieces larger than 10 cm to the length of core run or scanline. The GSI is used to derive field-scale rock mass properties for use in continuum rock mechanics modelling (Hoek et al., 2002). We estimated intact rock uni-axial compressive strength in the field using a rock hammer (ISRM, 1978).
3.3 Geomorphic analysis
Data on the morphology of the fjord were derived from dig-ital elevation models. We used Canadian Digdig-ital Elevation Data (CDED), 20 m resolution elevation models (GeoBase, 2008) to analyze the terrestrial parts of the fjord. A 2 m resolution elevation model generated from multibeam echo-sounding data provided by the Canadian Hydrographic Ser-vice (2008) allowed us to analyze the submarine parts of Knight Inlet.
3.4 Stability analysis
1428 D. P. van Zeyl et al.: Structure, stability, and tsunami hazard in BC
Figure 3. Oblique photograph of the rock slope at Adeane Point.
WS: west slope; c: central gully; w: west gully.
evaluate the potential for planar, wedge, and toppling fail-ure (Hoek and Bray, 1981; Wyllie and Mah, 2003). We then analyzed selected planar and wedge failure modes identified from kinematic analysis using the program Swedge (Roc-science, 2008) to compute the factor of safety of rigid blocks bounded by intersecting discontinuities. This analysis al-lowed us to rank the key failure types in terms of relative sta-bility and to help estimate possible landslide volumes. The procedure involved computing the factor of safety for each failure type over the full range of slopes and aspects observed at the site. The analysis assumed no tension crack, an upper slope of 15◦with the same aspect as the lower slope, a friction angle of 30◦, and zero cohesion. As the objective of the sta-bility analysis was to rank the different failure types in terms of relative stability, the assumed friction angle and cohesion had no influence on the results. Although pore pressure fluc-tuations and earthquake accelerations are undoubtedly im-portant factors in bringing slopes in this environment to fail-ure and likely are common triggering mechanisms, they were not considered in this preliminary stability analysis.
Figure 4. Vertical image showing the subaerial and submarine parts
of the rock slope at Adeane Point. The offshore area is represented by a slope map generated from swath bathymetry. WS: west slope; W: west wall; w: west gully; c: central gully; E: east wall; ES: east slope.
4 Rock slope characterization 4.1 Slope morphology
The north part of the unnamed mountain at Adeane Point is a bowl-shaped erosional basin that has a distinct U shape in plan, with a radius of curvature at the crest of the rock slope of about 400 m (Figs. 4, 5). The surface area of the terrestrial portion of this erosional basin is about 1.5 km2, a third of which is exposed bedrock.
Figure 5. Slope and aspect maps. The stereonet included with the
aspect map shows the 3-D shape of the slope.
The maximum elevation at Adeane Point is 885 m at the east peak. Based on the DEM, relief from seafloor to this summit is about 1400 m, with an average slope of about 45◦ (Fig. 6); the angle from the shoreline to the top of the slope is 55◦, and local slope angles are as great as 70–72◦near the tops of the east and west walls (Fig. 5).
4.2 Slope deposits
The submarine debris cone at the base of the slope dips 20– 24◦; it has a surface area of about 0.1 km2 (Fig. 6) and an estimated volume of 3.5 Mm3. Our analysis of images col-lected by Bornhold et al. (2007) from a remotely operated vehicle indicates that the debris cone comprises openwork, subangular blocks less than 2 m across that are dominantly 0.1–0.4 m in size.
We examined slope deposits in the central and west gul-lies (Figs. 3 and 4). The west gully gul-lies largely within meta-morphic rocks, and its source area is the west wall. Grass, lichens, and seedlings are present on the deposit, suggesting minimal recent rockfall activity from its source area. In con-trast, vegetation is generally absent in the central gully below the east wall; no lichens and mosses were observed on the rock blocks, and the blocks are less weathered than those in the west gully, suggesting greater rockfall activity from the
Figure 6. Profile of the rock slope at Adeane Point, including a
schematic representation of submarine debris cone and fjord infill sediments.
east wall. Oblique photographs also indicate a larger number of fresh rockfall scars on the east wall than on the west wall.
4.3 Bedrock geology
Rocks at Adeane Point consist of greenstone of the Upper Triassic Karmutsen Formation and Late Cretaceous diorite (Roddick and Woodsworth, 2006). The greenstone is mas-sive to foliated and contains intercalations of marble, sand-stone, argillite, phyllite, biotite-chlorite schist, and amphi-bolite (Bancroft, 1913; Roddick, 1977). The dioritic pluton exposed in the rock slope contains screens of amphibolites and schist and is in sharp contact with the greenstone (struc-ture 1a, Fig. 7); both the diorite and greenstone are foliated near the contact.
4.4 Structural geology 4.4.1 Major structures
Portions of some of the major structures exposed in the rock slope (Figs. 7, 8) were accessed from the top of the slope, and additional information on major structures was obtained from oblique photographs taken from a helicopter and from ground locations.
The most apparent and persistent structures, which we term set 1, are parallel to the foliation. At the crest of the slope, the four largest and most evident of these structures – labelled 1a, 1b, 1c, and 1d – are spaced about 50 m apart and are at least 100 m long (Figs. 7, 8). Field measurements of three of them indicate an average attitude of 54/028◦(dip/dip direction). Structure 1a extends the full height of the rock slope; locally recessed portions of this structure suggest the presence of weak layers or a fault zone.
1430 D. P. van Zeyl et al.: Structure, stability, and tsunami hazard in BC
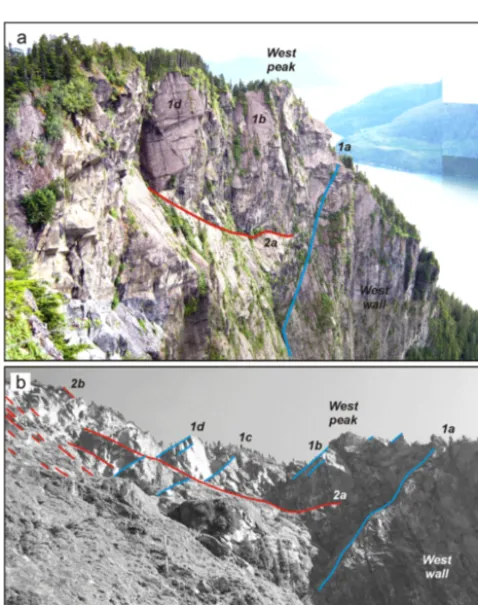
Figure 7. Left: oblique view of the rock slope. Right: map showing major structures exposed in the slope.
Figure 8. Oblique photographs showing major structures at the crest
of the rock slope. See text for explanation of discontinuity sets.
the scar and persists for at least 100 m, forming a potential sliding plane beneath a large rock mass encompassing the west peak (Figs. 7, 8). The lower part of this structure,
be-neath the west peak, is noticeably curvi-planar and does not appear to intersect structure 1a.
4.4.2 Foliation
Foliation joints (set 1) in the intrusive and metamorphic rocks are some of the most persistent structures exposed in the rock slope. The average orientation of the foliation is 55/027◦ (Fig. 9f).
The attitudes of the subaerial portion and submarine exten-sion of the west slope, as measured from the digital elevation models (Figs. 5, 9b), are similar to outcrop foliation mea-surements (Fig. 9f). For instance, the SONAR data show that the average orientation of a large portion of the submarine extension of the west slope is 47/023◦.
The foliation at Adeane Point is typical of foliation else-where in the southern Coast Belt, else-where structures in plutons and pendants are dominated by northwest-trending foliation that commonly dips steeply northeast (Woodsworth et al., 1991) and most plutonic rocks exhibit some degree of foli-ation, which is best developed near pluton margins (Roddick and Hutchison, 1974).
4.4.3 Bedding
foliation-present within the rock slope, and faulting may have occurred along these layers during emplacement of the pluton. Indeed, we observed fault-like structures beneath extensive foliation-parallel beds of massive greenstone in the central gully, and many more may exist than were observed in the field. Re-gional mappers have pointed out that it is almost impossible to determine whether faults exist in areas where the stratified rocks occur in thin beds (Bancroft, 1913).
4.4.4 Sheeting joints
A single structure (2b) associated with a distinct set of sheet-ing joints (set 2) exposed near the crest has an attitude of 55/273◦. In contrast, we observed gentler dips for this set in scanlines (Fig. 9d) and spot surveys at lower elevations, sug-gesting that the attitude of these joints conforms to the overall shape of the slope. Oblique photographs of the large rockfall scar at the crest show that the most visually apparent struc-tures of set 2 are typically about 12 m long with a spacing of about 3 m. The digital elevation model illustrates how the orientation of the east wall is similar to the orientation of this joint set (Fig. 9c).
Terzaghi (1962) referred to sheeting joints as “valley joints”, because they generally conform to the shape of the valley in which they occur. Bjerrum and Jørstad (1968) iden-tified them as an important control on rockslides and rock-falls in the fjords of Norway, and they are one of the main causes of rockfalls and rockslides along BC Highway 99 between Vancouver and Whistler (Hoek and Bray, 1981; Gilbert, 2008).
4.4.5 Mafic dykes
Mafic dykes cut both metamorphic and intrusive rocks. The dykes observed in the field range in thickness from about 15 cm to 2 m and consist of very strong to extremely strong, greenish-grey basalt. The dykes and the structures along which they were emplaced display great persistence; some of them were traced through the entire height of the west wall. The high degree of fracturing in the dykes compared to the adjacent host rock likely renders them as hydraulic con-duits, which is supported by the presence of springs emanat-ing from dykes at the apex of the central gully. Some of the dykes are parallel to the foliation (44/036◦), whereas others cut across it (84/311◦) (Fig. 9h).
Northwest- and northeast-trending dykes and brittle faults of Tertiary age are common along this part of the coast (Woodsworth et al., 1991). According to Bancroft (1913, p. 116), the dykes in this area “are frequently irregular in
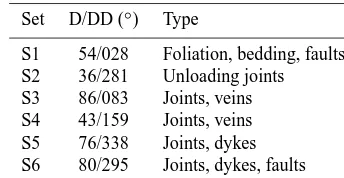
S3 86/083 Joints, veins S4 43/159 Joints, veins S5 76/338 Joints, dykes S6 80/295 Joints, dykes, faults
their strike, but the greater number of them either assume a direction which is parallel or transverse to the trend of the Coast Range”, and “where the walls of the fiord are devoid of vegetation, these dykes often appear as dark, ribbon-like bands of a remarkably constant width, extending from the shoreline to the summit of mountains several thousand feet high”.
4.4.6 Discontinuity system
To facilitate stability analysis, we developed a simple repre-sentation of the main discontinuity sets at this site based on the structures described above and on some additional struc-tural details provided below (Table 1, Fig. 9i).
Foliation, bedding, and associated faults form S1, and sheeting joints form S2. Scanlines and spot measurements provide evidence of a north-trending sub-vertical set (S3) of joints and quartz veins, as well as a set of joints and quartz veins (S4) dipping about 45◦ to the SSE (Fig. 9d, e). A pronounced set of north-trending lineaments observed a few kilometres south of the site may be related to the sub-vertical joints defined here as S3.
Because the orientations of the dykes and linear topo-graphic features at Adeane Point differ substantially, we de-fined two sub-vertical discontinuity sets to incorporate this variability into the stability analysis (S5 and S6). We defined S5 based on ENE-trending, sub-vertical joints and dykes in-tersected in scanlines; ENE-trending linear cliffs 100–150 m high on the submarine sidewall (Fig. 9a); and distinctive lin-eaments extending across the rock slope at 300–600 m ele-vation (Fig. 9). An important set of northeast-trending struc-tures (S6) extends through the crest of the rock slope south of the east peak (Fig. 9); one of these structures intersects structure 1c, forming a wedge-shaped cavity (Figs. 7, 8).
4.5 Rock mass conditions
1432 D. P. van Zeyl et al.: Structure, stability, and tsunami hazard in BC
Figure 9. Synthesis of field and remotely sensed structural data.
Average discontinuity spacing computed from scanline data are in the range of 15–50 cm for all sets, similar to the average block size observed in the submarine debris cone (10–40 cm). These values represent close to moderate spacing (ISRM, 1978), which qualify the rock mass as very blocky to blocky according to Cai et al. (2004) and Mari-nos et al. (2005). Typical discontinuity surfaces are rough, slightly rough, or smooth; we did not observe clay-filled joints in our surveys. The typical rock mass at this site has a GSI ranging from 40 to 90, reflecting favourable rock mass conditions. Similarly, scanlines indicate RQD values in the range of 75–82 %, reflecting “fair” to “good” rock mass con-ditions (Deere et al., 1967).
The observed outcrop-scale discontinuity spacing values in both dioritic and metamorphic rocks are typical of those in similar rocks described elsewhere in the Coast Moun-tains. Roddick (1965), for example, noted that hornblende-rich plutonic rocks, like the diorite at Adeane Point, are
more closely jointed and sheeted than biotite-rich plutonic rocks. Of the hornblende-rich rocks, medium- to coarse-grained rocks have larger joint spacing (60–120 cm) than finer-grained varieties (15–30 cm), and the smaller spacing in the finer-grained intrusive rocks is similar to that in adja-cent metamorphic belts.
Although average outcrop-scale joint persistence for all sets is in the range of 2–4 m, reflecting low to medium persis-tence (ISRM, 1978), oblique photographs of the rock slope suggest much greater persistence. Persistence “censoring” was an unavoidable reality at the outcrop scale, although in some cases, joint terminations were observed either in intact rock or against other discontinuities. Some of the more per-sistent structures observed in oblique photographs may rep-resent closely spaced discontinuities separated by intact rock bridges or step-path joints.
to-circular failure surface. As a result, stability analyses based on structurally controlled failure mechanisms are considered more appropriate for this site.
5 Stability analysis
We performed a kinematic analysis to identify possible fail-ure modes using the discontinuity sets summarized in Ta-ble 1. Although at the outcrop scale only three or four of the six sets might be present, all sets were considered in order to evaluate the true range of potential failure modes within different parts of the slope.
We compared the average orientation of the east and west walls to the interpreted rock mass structure to test for feasible modes of failure (Fig. 10). The most probable failure modes are planar sliding on S2 in the east wall (Fig. 10a) and wedge failure on the intersections of S1–S6 and S1–S3 in the west wall (Fig. 10d). However, if we account for the variability in discontinuity orientations and slope attitudes, wedge failure on the above intersections becomes feasible in the east wall and additional wedge intersections are feasible in both walls. Toppling on S6 in the east wall (Fig. 10a) and on S4 and S5 in the west wall (Fig. 10c) are also possible if variations in discontinuity orientations are considered. Based on evidence from oblique photographs, block toppling could be an impor-tant mechanism in localized over-steepened slope sections.
Given that wedge intersections in addition to those de-scribed above daylight on relatively steep slopes, the very steep slopes in the upper part of the rock slope would appear to be the most susceptible to structurally controlled failures. Confining pressures are also lowest on this part of the slope. In this context, it is interesting to note that rockfall scars are most common near the crest of the slope.
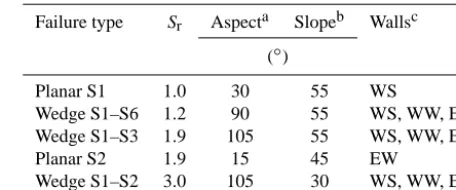
We analyzed selected failure types identified in the kine-matic analysis using Swedge. The orientations of S1, S2, S3, and S6, as summarized in Table 1, were used as input in the stability analysis. The results of the analysis are expressed as the stability (Sr) relative to the least-stable mode (Table 2).
As is evident in Table 2, planar failure is feasible over a small range of aspects on the west slope and east wall. We call attention to the fact that the dip of S2 used in this analysis (Table 1) is based on an average for the site, and joints from this set display steeper dips near the top of the slope. Analysis with a dip angle of 55◦would yield a factor of safety roughly equivalent to that observed for planar failure on S1.
Wedge failure is possible throughout the centre of the rock slope and on the periphery, covering a much wider range of aspects than planar failure. In this context, S1 is particularly
Wedge S1–S6 1.2 90 55 WS, WW, EW
Wedge S1–S3 1.9 105 55 WS, WW, EW
Planar S2 1.9 15 45 EW
Wedge S1–S2 3.0 105 30 WS, WW, EW
aRange in aspect where failure type is feasible. bMinimum slope in which failure type is feasible. cWalls in which failure type is feasible: WS: west slope;
WW: west wall; EW: east wall.
important because it is involved in all three wedge combina-tions. S3 and S6 intersect with S1 to form steeply plunging intersections (about 50◦) beneath narrow wedges, and these intersections can only occur on the steepest slopes. In con-trast, the intersection between S1 and S2 forms gently plung-ing wedges of larger size that can form on gentler slopes. An analysis using a steeper dip on S2, as observed near the slope crest, would reduce the stability of the S1–S2 wedge, but the plunge of the wedge intersection (about 40◦) would remain less than that formed between S1 and the steeper sets, S3 and S6.
The sketch shown in Fig. 11 illustrates two different scales of possible wedge failure at the slope crest. Considering a slope 200 m wide and 75 m high, with an orientation inter-mediate between that of the east and west walls (85/330◦), the volumes formed from wedges defined by the intersec-tions of S1 with S2, S3, and S6 would be 575 000, 38 000, and 38 000 m3, respectively. This example illustrates the pos-sible sizes of wedge failures that could occur from the upper-most 75 m of the rock slope. The required persistence to form these wedges would be about 300 m for the larger wedge and 100 m for the smaller wedges. The required persistence for the larger wedge is about 3 times that of the smaller two; therefore the large wedge failure is less likely. The lower like-lihood of a larger wedge failure is due not only to the higher factor of safety but also to the lower chance of such large intersecting structures being present without the existence of significant rock bridges.
As shown in Figs. 8 and 11, a large wedge, perhaps about 0.5 Mm3in size and bounded below by structures 1a and 2a, is present below the west peak. It is unknown to what extent these structures persist in the subsurface, but oblique pho-tographs suggest that structure 2a has limited persistence and does not intersect structure 1a. For failure to occur in this sit-uation, stress-induced fracturing might be required for day-lighting of a through-going failure surface.
progres-1434 D. P. van Zeyl et al.: Structure, stability, and tsunami hazard in BC
Figure 10. Equal area lower hemisphere stereonets showing (a) the planar and toppling check for the east wall, (b) the wedge failure check
for the east wall, (c) the planar and toppling check for the west wall, and (d) the wedge failure check for the west wall. A 30◦friction cone is assumed.
sive failure through the destruction of rock bridges along partially formed failure surfaces. Another possibility is that earthquakes or intense precipitation events might trigger nu-merous small failures over a wide area of the rock slope. In this way, multiple small failures could produce a larger cu-mulative volume of debris than a single large, structurally controlled failure. Considering these factors, it is possible that the cumulative size of a slope failure could be signifi-cantly larger than that of one simple, structurally controlled wedge or planar failure.
6 Tsunami hazard assessment
Several different analytical methods for estimating the heights of tsunamis triggered by subaerial landslides have been described in the literature (e.g. Noda, 1970; Slinger-land and Voight, 1979; Huber and Hager, 1997; Fritz et al., 2004). Typically, these methods are used to estimate max-imum wave heights within a short distance of the landslide impact site. They commonly produce conservative results
Figure 11. Sketch showing two scales of wedge-shaped blocks at
the crest of the rock slope at Adeane Point. Wedges formed by S1– S6 have dimensions of 50–75 m. The large wedge formed by S1– S2 has dimensions of about 75 and 250 m. Azimuths are the dip directions of the rock slope at the respective locations.
a past landslide at Adeane Point, assuming that the 3.5 Mm3 submarine debris cone at the base of the slope was emplaced by a single landslide. It is possible, however, that a slide of much smaller size was responsible for this event. It is im-portant to note that the analytical model used to hindcast the event was developed for submarine landslides (Murty, 1979; Striem and Miloh, 1975) and that the assumed proportion of landslide kinetic energy converted to wave energy was low (1–10 %) compared to values for subaerial landslides. For example, through extensive experimentation using 2-D and 3-D flume models involving granular subaerial slides, Huber (1980) found that up to 40 % of the kinetic slide energy was converted to wave energy, and Fritz (2002) found that up to 30 % of the kinetic slide energy was converted to the primary wave crest.
Our study focuses on the potential for future landslides, and our analysis of the structure, morphology, and stability of the rock slope at Adeane Point suggests the potential for failures of sizes ranging up to about 0.5 Mm3. Several other similar steep rock slopes situated above large submarine de-bris cones exist in the inner part of Knight Inlet, and these slopes could also be susceptible to rockslides and rockfalls of similar or perhaps larger size. Landslides of such size could generate waves that would be hazardous to any nearby future coastal infrastructure in Knight Inlet or to vessels underway within the fjord.
An example of a potential development that would be vul-nerable to landslide-induced waves in Knight Inlet is fish farms. The tsunami caused by the earthquake-triggered land-slide in southern Chile in April 2007 (Sepúlveda et al., 2010) illustrates the type of consequences that such events can have on fish farm operations, including loss of life, damage to fa-cilities, and the release of a large number of farmed fish into a natural aquatic ecosystem.
The November 1999 Three Finger Peak landslide-induced wave further indicates the potential for tsunamis in Knight Inlet.
7 Summary
The abundance of steep rock slopes towering above rockfall and rockslide deposits on the seafloor in the inner part of Knight Inlet suggests a history of tsunami-generating land-slides over the past 12 000 years. A recent study integrat-ing archaeological and geological observations with oceano-graphic analysis suggests that the former village of Kwalate in Knight Inlet was destroyed in the late 1500s by a landslide-induced wave. In light of this disaster, we studied the
struc-at Adeane Point. The greenstone and adjacent diorite are strongly foliated, resulting in highly persistent brittle struc-tures. Other important structures include a set of sheeting joints and highly persistent mafic dykes and faults. Stability analysis showed the potential for planar and wedge failures and highlighted the potential for wedge failures near the crest of the slope.
We performed kinematic and limit equilibrium analyses to identify and rank the importance of different failure mech-anisms and to estimate possible failure volumes. Based on the observed structure and morphology of the rock mass at Adeane Point, we see the potential for failures up to about 0.5 Mm3in size initiating from near the crest of the slope.
Landslides of the nature and size described above would generate waves that might damage coastal infrastructure or vessels underway in the fjord. Given that there are several similar steep rock slopes with large submarine debris cones in the inner part of Knight Inlet, this is an area where tsunami hazards should be considered in coastal infrastructure devel-opment and land-use planning.
Acknowledgements. Financial assistance for the project was provided by a Natural Sciences and Engineering Research Council of Canada grant to D. Stead and a graduate fellowship from Simon Fraser University to D. P. van Zeyl. The authors are grateful to Steve Israel, Dan Gibson, and Bert Struik for discussions on the structural geology of the rock slope at Adeane Point. We thank journal reviewers V. Kveldsvik, C. B. Harbitz, and F. Zaniboni for their helpful comments and suggestions, which have improved the manuscript considerably.
Edited by: I. Didenkulova
Reviewed by: C. B. Harbitz and F. Zaniboni
References
Adams, J. and Atkinson, G.: Development of seismic hazard maps for the proposed 2005 edition of the National Building Code of Canada, Can. J. Civil. Eng., 30, 255–271, 2005.
Bancroft, J. A.: Geology of the coast and islands between the Strait of Georgia and Queen Charlotte Sound, British Columbia, Mem-oir 23, Geological Survey of Canada, Ottawa, Ontario, 1913. Bjerrum, L. and Jørstad, F.: Stability of rock slopes in Norway,
1436 D. P. van Zeyl et al.: Structure, stability, and tsunami hazard in BC
Bornhold, B. D., Harper, J. R., McLaren, D., and Thomson, R. E.: Destruction of the first nations village of Kwalate by a rock avalanche-generated tsunami, Atmos. Ocean, 45, 123–128, 2007. Cai, M., Kaiser, P. K., Uno, H., Tasaka, Y., and Minami, M.: Esti-mation of rock mass strength and deforEsti-mation modulus of jointed hard rock masses using GSI system, Int. J. Rock Mech. Min., 41, 3–19, 2004.
Canadian Hydrographic Service: Multibeam bathymetry dataset, CHSDIR File 5025887, Knight Inlet, Department of Fisheries and Oceans Canada, Canadian Hydrographic Service, Vancou-ver, British Columbia, 2008.
Clague, J. J.: Late quaternary geology and geochronology of British Columbia, Part 2: Summary and discussion of radiocarbon-dated quaternary history, Paper 80-35, Geological Survey of Canada, Ottawa, Ontario, 1981.
Clague, J. J.: Quaternary glaciation and sedimentation, in: Geology of the Cordilleran Orogen in Canada, edited by: Gabrielse, H. and Yorath, C. J., Geology of Canada Series 4, Geological Survey of Canada, Ottawa, Ontario, 419–434, 1991.
Dahl-Jensen, T., Larsen, L. M., Pedersen, S. A. S., Pedersen, J., Jepsen, H. F., Pedersen, G., Nielsen, J., Pedersen, A. K., Von Platen-Hallermund, F., and Weng, W.: Landslide and tsunami 21 November 2000 in Paatuut, West Greenland, Nat. Hazards, 31, 277–287, 2004.
Deere, D. U., Hendron, A. J., Patton, F. D., and Cording, E. J.: De-sign of surface and near surface construction in rock, in: Failure and Breakage of Rock, Proceedings, 8th US Symposium on Rock Mechanics, edited by: Fairhurst, C., Society of Mining Engi-neers, American Institute of Mining, Metallurgy, and Petroleum Engineers, New York, 237–302, 1967.
Dyke, A. S.: An outline of North American deglaciation with em-phasis on Central and Northern Canada, in: Quaternary Glacia-tions, Extent and Chronology Part II: North America, edited by: Ehlers, J. and Gibbard, P. L., Elsevier, New York, 373–424, 2004. Environment Canada: National climate archive, available at: http:
//climate.weather.gc.ca/, last access: 23 September 2008. Evans, S. G. and Clague, J. J.: Recent climatic change and
catas-trophic geomorphic processes in mountain environments, Geo-morphology, 10, 107–128, 1994.
Fritz, H. M.: Initial phase of landslide generated impulse waves, PhD thesis, Swiss Federal Institute of Technology, Zürich, 2002. Fritz, H. M., Hager, W. H., and Minor, H.-E.: Near field charac-teristics of landslide generated impulse waves, J. Waterw. Port C.-ASCE, 130, 287–302, 2004.
GeoBase: Canadian digital elevation data (CDED), available at: available at: http://www.geobase.ca, last access: 8 Febru-ary 2008.
Gilbert, R.: Engineering consultant raises concerns over Porteau Bluff, Journal of Commerce, 18 August 2008.
Hoek, E. and Bray, J. W.: Rock Slope Engineering, 3rd Edn., Insti-tute of Mining and Metallurgy, London, 1981.
Hoek, E., Carranza-Torres, C., and Corkum, B.: Hoek-Brown crite-rion – 2002 edition, in: Proceedings, NARMS-TAC Conference, Toronto, Ontario, 1, 267–273, 2002.
Huber, A.: Schwallwellen in Seen als Folge von Felsstürzen, PhD thesis, Swiss Federal Institute of Technology, Zürich, 1980. Huber, A.: Felsbewegungen und Uferabbrüche an Schweizer Seen, ihre Ursachen und Auswirkungen, Eclogae Geol. Helv., 75, 563– 578, 1982.
Huber, A. and Hager, W. H.: Forecasting impulse waves in reser-voirs, in: Proceedings, 19th Congrès des Grands Barrages, C.31, ICOLD, Paris, 993–1005, 1997.
ISRM: Suggested methods for the quantitative description of dis-continuities in rock masses, Int. J. Rock Mech. Min., 15, 319– 368, 1978.
Marinos, V., Marinos, P., and Hoek, E.: The geological strength in-dex: applications and limitations, B. Eng. Geol. Environ., 64, 55– 65, 2005.
Mathews, W. H.: Ice sheets and ice streams: thoughts on the Cordilleran Ice Sheet Symposium, Geogr. Phys. Quatern., 45, 263–267, 1991.
Miller, D. J.: The Alaska earthquake of 10 July 1958: giant wave in Lituya Bay, B. Seismol. Soc. Am., 50, 253–266, 1960a. Miller, D. J.: Giant waves in Lituya Bay, Alaska, Professional
Pa-per 354-C, US Geological Survey, Denver, Colorado, 51–87, 1960b.
Murty, T. S.: Submarine slide-generated water waves in Kitimat, British Columbia, J. Geophys. Res., 84, 7777–7779, 1979. Noda, E.: Water waves generated by landslides, J. Waterway.
Div.-ASCE, 96, 835–855, 1970.
Rocscience: SWEDGE, Rocscience Inc., Toronto, Ontario, 2008. Roddick, J. A.: Notes on the stratified rocks of Bute Inlet map-area
(excluding Vancouver and Quadra islands), Open File 480, Geo-logical Survey of Canada, Ottawa, Ontario, 1977.
Roddick, J. A. and Hutchison, W. W.: Setting of the coast plutonic complex, British Columbia, Pacific Geology, 8, 91–108, 1974. Roddick, J. A. and Woodsworth, G. J.: Geology, Bute Inlet, British
Columbia, Open File 5037, Geological Survey of Canada, Ot-tawa, Ontario, 2006.
Sepúlveda, S. A., Serey, A., Lara, M., Pavez, A., and Rebolledo, S.: Landslides induced by the April 2007 Aysén fjord earthquake, Chilean Patagonia Landslides, 7, 483–492, 2010.
Slingerland, R. L. and Voight, B.: Occurrences, properties, and pre-dictive models of landslide-generated water waves, in: Rock-slides and Avalanches, vol. 2, edited by: Voight, B., Elsevier, New York, 317–397, 1979.
Striem, H. L. and Miloh, T.: Tsunamis induced by submarine slump-ings off the coast of Israel, Report IA-LD-1-102, Israel Atomic Energy Commission, Tel Aviv, 1975.
Terzaghi, K.: Stability of steep slopes on hard unweathered rock, Géotechnique, 12, 251–270, 1962.
van Zeyl, D. P.: Evaluation of subaerial landslide hazards in Knight Inlet and Howe Sound, British Columbia, MSc thesis, Simon Fraser University, Burnaby, British Columbia, 2009.
Woodsworth, G. J., Monger, J. W. H., and Gabrielse, H.: Part B, Coast Belt, Chapter 17, Structural styles, in: Geology of the Cordilleran Orogen in Canada, edited by: Gabrielse, H. and Yorath, C. J., Geology of Canada Series 4, Geological Survey of Canada, Ottawa, Ontario, 581–591, 1991.