Abstract—This paper describes the qualification of sensors envisioned for Cigéo, the planned deep disposal center for French radioactive waste. More precisely, it describes an in situ demonstrator, similar with the system planned to monitor intermediate level long lived radioactive wastes cells. These cells would be a tunnel, located 490 m deep, with 9 m in diameter, with concrete liners realized in three steps.
The demonstrator was instrumented in 2011 in the Andra’s Underground Research Laboratory. The instruments provide useful information on sensors’ adaptability to the environment; robustness and technology comparisons (accordance and discrepancies). As an example, accordance between localized sensors and distributed measurements for strains, by optical fiber sensors and vibrating wire extensometers and temperatures, by optical fiber sensors and platinum probe, was verified.
After 3 years more than 95% of sensors still provide measurements and show no drift over time.
Index Terms—Monitoring, radioactive waste, sensors, tunnel.
I. APPLICATION:CIGÉO PROJECT
Monitoring of underground facilities for radioactive waste repository, in France named Cigéo, is a big challenge because of harsh conditions and requirements on sensors. Indeed, sensors have to function for several decades without any maintenance. Reliability and accuracy are the key issues for such a system. In order to provide a system for the monitoring of Thermal, Hydraulic, Mechanical, Radiological and Chemical (THMRC) parameters, Andra (French Radioactive Waste Management Agency) has performed a qualification procedure in 4 steps for each parameter. After (i) a stat of the art investigation, (ii) several tests were performed in laboratory in order to qualify sensors in controlled environment. Therefore, (iii) in situ tests were performed in parallel with (iv) hardening to radiation.
This paper aims to describe the qualification of sensors, as a part of an in situ demonstrator, in order to be used to monitor intermediate level long lived radioactive wastes cells. The demonstrator is a tunnel mad by concrete in the Andra’s Underground Research Laboratory (URL). This demonstrator was instrumented in 2011 in the GCR gallery Fig. 1, according to a stiff liner’s concept. The instruments already provide useful information on sensors technologies accordance, adaptability to the environment and the robustness.
Manuscript received May 19, 2014; revised July 20, 2014.
The authors are with the French Radioactive Waste Management Agency, Bure, 55290, France (e-mail: Radwan.farhoud@andra.fr,
Celine.righiniwaz@andra.fr, Sylvie.lesoille@andra.fr, Stephane.buschaert@andra.fr ).
Fig. 1. Galleries in the Andra’s URL.
II. MONITORING SYSTEM’S REQUIREMENTS
The monitoring system of an underground repository for radioactive wastes cells have to provide useful information on the structural health of the supporting liners. These liners may be a concrete tunnel for intermediate level long lived wastes, and a steel tube for high level long lived wastes, in a clay rock.
The clay rock, named the Callovo - Oxfordian at – 490 m under the surface, guaranties the confinement of the wastes and avoids any radionuclide’s migration, because of its very low permeability, during an enough long period. The excavation damaged zone (EDZ) around the galleries is the key parameter to ensure these qualities of the rock. This means that it is forbidden to dig boreholes or installing sensors in the rock close to the gallery to preserve the EDZ and prevent its extension.
The concrete liner, have to guaranty the integrity of radioactive waste packages during the operational and the reversibility periods (it means, have the possibility to get out wastes’ packages during a century). It has also to limit the rock convergences in order to keep the rock compact and avoid EDZ Fig. 2 extension. This extension would change the rock thermo-hydro-mechanical behaviors.
In the disposal cells, which are tunnels, the THMCR parameters will have to be monitored in order to ensure operational safety, long term security and the reversibility. However, tunnels are not accessible as soon as the first nuclear waste package will be in place. This prevents traditional visual inspection to be performed in exploitation. A monitoring system has to be implemented. It must operate in harsh environment for a non-common long period. Indeed, sensors have to operate during several decades without any maintenance. In addition, some sensors have to operate in spite of high temperatures, radiations, corrosion, etc.
Monitoring System Design of Underground Repository for
Radioactive Wastes – In Situ Demonstrator
Radwan Farhoud, Sylvie Delepine-Lesoille, Stephane Buschaert, and Céline Righini-Waz
Fig. 2. EDZ around the galleries in the Andra’s URL according to the major (Up) or minor (down) horizontal stress field.
In order to provide a monitoring system able to operate in such environment, for such long time, Andra developed a research and development program with 4 steps qualification for each sensor. It starts by the stat of the art and finishes by hardening to radiation, and passes by in situ demonstrator which must contain a large part of sensors planned to be used in order to be representative to the reel monitoring system. This representative system means involving possible difficulties like (i) several number of sensors in a close area, (ii) an important number of cables and (iii) installation phases in the same time of construction phases (i.e. an important co-activities).
III. MONITORING SYSTEM DESIGN
In order to monitor the EDZ and the liners around the radioactive wastes, Andra has developed a specific strategy for the monitoring. Firstly, the reliability of measurements has to be ensured. For that, previously a few reference measurements will be installed in order to provide reference measurements and control drift over time of measurements. Secondly, sensors will be installed in redundancy. It means, for each monitoring parameter at least 2 technologies of sensors will juxtaposed in order to be able to provide measurements in spite of any problem at any type of sensors, including a long term failures or dysfunctions. The use of the second technology of sensors offers the possibility to measure, with innovative technologies in the same time of well-known ones, the same parameter. For example, strain can be measured by vibrating wire extensometer and optical fiber sensors. The first technology is well known and approved, when the second one is more innovative but allows distributed measurements.
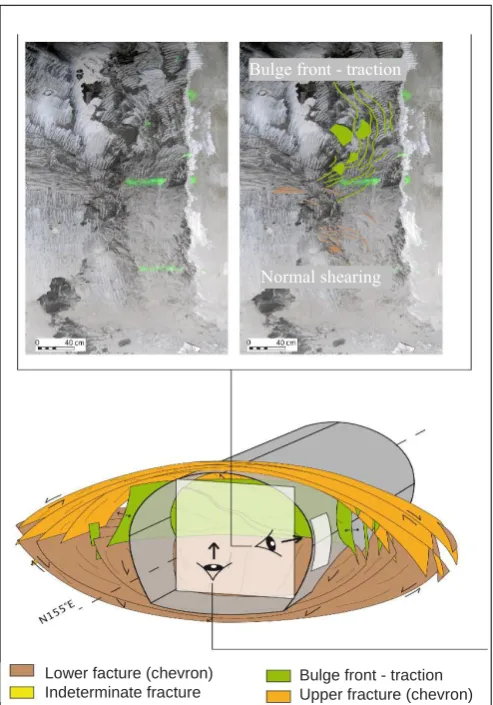
Furthermore, in parallel of in situ sensors’ measurements other information will be provided by non-destructive methods or visual inspections Fig. 3 and 3D scan [1] as well. These technics will be used during construction process in order to verify the geological information in situ according to those calculated in the model.
In order to be able to provide useful information on the supporting structure and waste packages, during the exploitation period, developments on robots equipped with several sensors are started and will be tested as soon as possible and will take advantage of actual developments on sensors. These robots will allow a mutualization of measurement devices for several disposal cells.
Fig. 3. Example of visual inspection results in a gallery.
Moreover, one-to-one scale demonstrator is a very important step in the qualification program of sensors and validation of the monitoring strategy. Instrumentation of an in situ demonstrator could change the strategy’s approach because, some problems may occur when sensors are put together. Such problems would never appear when each sensor was tested alone. As an example, the total number of cables might rapidly become too invasive and design might need to be reviewed to include more multiplexors. Similarly, influence’s perimeter around some sensors, may affect some sensors' measurements. As an example, pulse sensor, which provides permeability measurement, may affect water content sensors' measurements, like TDR or pore water pressure sensor.
IV. IN SITU DEMONSTRATOR
In the Andra’s URL at -490 m under the surface inside the clay rock, according to the major horizontal stress field, the GCR gallery, about 65 m length, was excavated between 2010 to 2011 by a tunneling machine named MAP Fig. 4.
This gallery has a large diameter drilling about 5.40 m covered by shotcrete liner, 20 cm thick, immediately after excavation. It aims to retain the elements in the rock's support systems in the medium and long term on THM behaviors and more particularly on the EDZ extension.
Six months after excavation a concrete ring, poured in situ, Lower facture (chevron)
Indeterminate fracture
Bulge front - traction Upper fracture (chevron)
Bulge front - traction
was built with three types of liner, 30 cm of thickness each, and performed 3 types of support made by stiff concrete type C60 (60 MPa at 28 days) followed by a C40, with compressible shims both Fig. 5, while the last section was made by C60 without compressible shims. Three supports in order to see the loading impact on each supporting type.
Fig. 4. The machine used to excavate the gallery (punctual attack machine).
Fig. 5. GCR gallery concept (1), beams & bolts (2) and the entire gallery after excavation (3) & with concrete liner (4).
The instruments, as a monitoring demonstrator [2], were installed in the GCR tunnel inside a circular cross-section 3.6 m long Fig. 6 and in boffigreholes excavated in the surrounding rock. This section contains 129 traditional or classical sensors and 11 optical fiber sensor lines (OFS), providing THM measurements every 30 minutes (5 or 10 minutes in the first months). The sensors were installed following a strategy aiming to provide each parameter (THM) with 2 kinds of sensor. The classical sensors installed were: • Time Domain Reflectometry (TDR) to follow the water
content in the rock and the concrete ring,
• Vibrating Wire Extensometer (VWE) to monitor the strain in the concrete ring,
• Pour Water Pressure (PWP) to measure the pore overpressure due to the excavation or the impact of exothermal waste packages in the future repository, • Total Pressure (TP) in order to follow the liners load by
the host rock,
• Extensometer Multi-points Single-rod (EMS) for displacement measurements of the rock surrounding the waste cells.
Fig. 6. Sensors’ localization in the monitoring section test (demonstrator).
As a second technology, distributed strain and temperature measurements provided by OFS cable were installed. Two different types of OFS for strains and temperatures were installed and one for only temperature, in order to assess installation protocol, robustness and metrological performances. For that, temperature was measured by Raman scattering in multimode OFS and compared to platinum probes (Pt100). Similarly, the strains were obtained by distributed Brillouin scattering within monomode OFS, and compared to VWE sensors.
V. RESULTS OBTAINED
A. Installation Procedures
The installation of sensors brings out a lot of lessons. Firstly, the installation procedures of some sensors were tested and approved. For example, the optical fiber cable installation was delicate. OFS cables were successfully installed in three boreholes for temperature measurement and have been attached to the extensometers by scotch pieces every 0.5 m approximately.
The OFS cables were installed inside the concrete liner Fig. 7 for both temperature and strain measurement with a relative success. The OFS cables in the coating make tow circles each type and attach to a wire mesh with Rislans. A key issue with this installation was the pressure induced to the cables because of clamping. Indeed, if the OFS cables are compressed, each pinch generates a decrease of the optical budget and increases the noise. It is worth noting that it is very important to avoid these decreases in order to be able to detect the waited events by the sensors. This part of the installation was successfully accomplished.
1 2
Fig. 7. Optical fiber sensors installation in the concrete liner.
The in situ experiment shows that data management, of optical fiber distributed sensing, is very delicate because of localization’s shift of the interested part of the OFS cable when cable breaks occur. Indeed, repeated breaks on OFS cable were a reel problem in several situations.
Firstly, when the break occurs in the liner inside the concrete liner, the actual in situ instrument for Brillouin scattering couldn’t provide any measurement because it needs a closed loop OFS line. The solution would be buying a new instrument, but it’s not very urgent because the second line provides data. Nevertheless; it is planned to buy a new instrument in order to compare data provided by the 2 lines.
Secondly, several breaks occur when the construction workers moved the cables during construction phases. It is important to mention that the large number of cables made the cables moving’s operation difficult and fastidious.
The OFS cables were repaired in the gallery which was a difficult operation.
Indeed, it was difficult to splice the optical fiber because of the dust in the air and the ventilation. Sometimes, an additional difficulty appears because of the piece of cable available outside the liner Fig. 8 was too short and difficult to be welded.
Fig. 8. Break on OFS cable at 0.5m from the liner (left) & a photo of the important number of cable to deal with during construction phases.
B. Data Treatment
First results show a good correlation between sensors installed in the same area. The OFS cables installed in the concrete liner around the gallery provide strains Fig. 9, in all point around the gallery, in accordance with strains provided by vibrating wire extensometer as we can see in Fig. 10 in the upper curves (cf. green arrow).
The main advantage of the OFS cable use is that measurements are available in each point of the cable. This
advantage may become a big problem if the OFS cable breaks. What is more, once repaired it induces uncertainties on measurement localization (i.e. where each point along the optical fiber is according to the localization in the gallery). In order to avoid this sort of problem, a reference cartridge (Evertherm) [3] developed by Andra and LNE (French National metrology institute and test) was installed and tested. It allowed the control of temperature measurements by Raman scattering in OFS cable. It provided also a localized point along the OFS line, which allows overlaying the location along the fiber with the location in the gallery.
Fig. 9. Strains around the gallery in the concrete liner poured in oct.2011 for the basement vault and in Dec. 2012 for the vault.
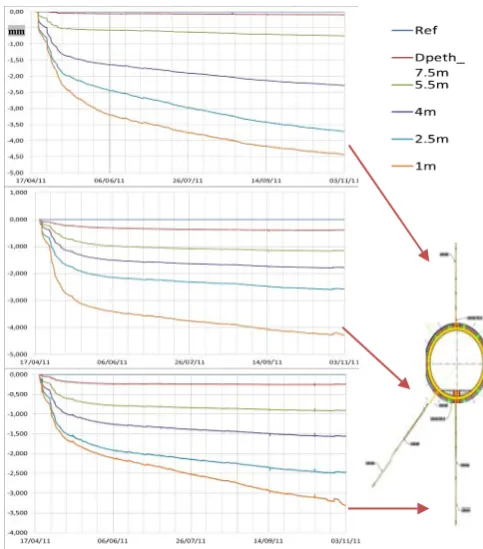
Other interesting results were provided by sensors installed in different zones around the gallery in the concrete liner and in the rock surrounding. Also, the rock evolution measured in boreholes is in great accordance with expected values. The total pressure sensor, installed at the interface between the rock and the concrete liner, indicates a very light and slow load. The values observed are in good correlation with the strains measured by the vibrating wire extensometers installed in the tangential direction in the concrete liner. It indicates that the rock convergences in the borehole increase until the concrete liner pouring. After that, only the sensors close to the gallery Fig. 10 bleu dotted curve) indicates convergences due, very certainly, to the concrete shrinkage and temperatures’ variations. The vibrating wire extensometers indicate (green arrows localization) similar evolutions due to the shrinkage and creep of the concrete liner.
The convergences presented in Fig. 10 are the relative variations of each fixed measurement’s sensor to the reference fixed point in the bottom of the borehole.
have confidence in the obtained values. It has to be considered as a qualitative evolution.
Fig. 10. Strains (up) in the concrete liner and load (purple down) of the concrete liner & rock convergences, in the basement vault.
Fig. 11. Convergence’s measurement by invar wire.
The concrete liner’s load depends on rock convergences; which may be measured by several kinds of sensor. In the first time the convergences were measured by invar wire Fig. 11 in 4 locations in the gallery GCR. The second location is close to the sensors’ demonstrator.
The measurement’s accuracy is about 0.2 mm (0.16 for the instrument named Vernier and 0.02 for each wire). In Fig. 12, the measurements between the excavation and the concreting of the liner, show the convergence of the rock measured with invar wire system. It was between 13 and 20 mm, according to the measurement’s direction, during approximately 6 months between Avril and October 2011.
The measurements were stopped because the devices were no more accessible after pouring of the concrete liner.
Fig. 12. Convergences measured by invar wire in one section.
During the same period, and few meters further than the location of the Invar wire section in the gallery, 3 boreholes were equipped with inductive extensometers installed in the upper; corner and lower part of the gallery (see Fig. 13).
Fig. 13. Convergences measured with bay extensometers in boreholes.
The measurements provided by the sensors, convergences between a reference point in the bottom of the borehole and each sensor, showed similar convergences with the Invar wire. These results provide confidence in the technology chosen (inductive extensometer).
The inductive extensometer installed has an interesting accuracy about ±0.15% of the measurement. These measurements can be also compared to other methods, like the Theodolite or 3D scan. It’s not yet possible today because of the accuracy of the instruments, available on-the-shelve, which can’t be better than ± 2 mm.
VI. CONCLUSION AND PERSPECTIVES
The survival rate of sensors, three years after installation is
Strain measurements by vibrating wire extensometer
Total pressure Displacement Concreting phases
MPa
µm/m
m/m
about 95%, of this monitoring system test showed the robustness of the selected technologies, event for most innovative and recent ones. The feedback obtained on implementation of sensors will be improved in 2014 during a new demonstrator installation. In order to increase sensor reliability and decrease failure during the construction phase, the OFS cables' will be installed, for each kind of cable in one piece. Each section will consist of several pieces of cable and will be connected directly, in specific connection’s boxes, to a hybrid optical fiber cable.
This real-scale experiment shows that optical fiber distributed sensing are well suited for underground tunnel monitoring. It also appears that the optical fiber cables chosen were sufficiently robust to tolerate construction conditions. When dealing with distributed data, a major difficulty is accurate event localization. This was solved by (i) creating artificial events as thermal excitation during the construction step to provide an accurate map or (ii) inserting reference points such as the thermal reference cartridge (Evertherm) along the sensing lines. In the future tests a new reference cartridge (several versions with more and less options) will be installed on several lines.
Sensors tested provided interesting data. It allowed improving models [4] and confirming the potential suitability between measurement’s need and qualified sensors. As an example, we can say that the inductive extensometer in borehole allowed EDZ evolution characterization and was able to provide the same level of information provided by other system, well known and approved, like Invar wire.
Data will be acquired for several years in order to obtain information about aging, accuracy, possible drift over time and robustness of sensors installed. In addition, measurements will be compared with different nondestructive methods in order to obtain the required level of reliable performances.
These data, in addition to data which will be provided in 2015 from a second demonstrator, will be analyzed in order to initiate data fusion in order to make the first steps towards monitoring data management and expert system. Furthermore, the actual models will be improved by
comparing calculated data with measurements obtained. ACKNOWLEDGEMENT
The authors wish to acknowledge companies that implemented instrumentation: Cementys, Fugro and Solexperts for their contributions to the project. Our thanks go to the Team in Bure for their support with Geoscientific Data Acquisition and Management Systems (SAGD) and for the access to the underground laboratory.
REFERENCES
[1] Y. Emonin, B. Noyere, F. Leveau, and C. R. Waz, “First results of the fracturing geological model induced by the excavation of galleries in the Andra's underground research laboratory,” presented at the Alert Workshop, Aussois, France, October 4-6, 2010.
[2] R. Farhoud, J. Bertrand, S. Buschaert, S. D. Lesoille, G. Hermand, J. P. Dubois, and M. D. Combarieu, “Design and development of a large-scale in situ monitoring test in the French URL at the centre meuse / haute-marne,” presented at the MoDeRn International Conference and Workshop, Luxembourg, March 19-21, 2013. [3] J. Bertrand, M. Ronan, O. Beaumont, and J. P. Dubois “Field
calibration device for Raman backscatter based Fiber optic distributed temperature system (Dts) technology,” in Proc. the 2012 22nd International Conference On Optical Fiber Sensors, 8421BA, October 4, 2012.
[4] R. Farhoud, G. Hermand, J. B. Kazmierczak, L. Malherbe, and C. Balland “A highly instrumented underground research gallery as a monitoring concept for radioactive waste cells - Data measurement qualification,” presented at the 7th EWSHM, Nantes, France, July 8-11,
2014.
R. Farhoud was born in Damascus, Syria, in 1972.
He is with engineer in energy and environment at ESSTIN (National Superior school in Technics and Sciences of Engineer at Nancy) in France in 2010.
He was graduated in electronic and industrial informatics at AFPA (Professional association for adult education) at Nancy in France in 1996.
He works for Andra, Bure France, since March, 2011 as a scientific engineer within Monitoring and Data Processing Department.
He worked at INERIS (French National Institute for Industrial Environment and Risks), Nancy France, as an instrumentalist between 1999 and 2011.