e-ISSN: 2278-7461, p-ISSN: 2319-6491 Volume 6, Issue 3 [March 2017] PP: 11-21
Metro Route Site Selection in Gaza City Using GIS
and Spatial Multi Criteria Evaluation
Maher A. El-Hallaq
1, Khalid D. El-Yazory
21Associate Prof. Of Surveying, Civil Engineering Dept., Islamic University of Gaza, Palestine 2 Department Of Civil Engineering, Islamic University of Gaza, Palestine
Abstract:
This study involves the evaluation of a case study in Gaza City to select the Metro site route. Fiftymajor intersections in Gaza City are chosen as candidate sites for Metro-rail stations, with 500m buffer of each intersection. The criteria that used to choose the best stations of Metro lines are population density, vital places, available parking, area of intersection, traffic important of intersection, and land use. The control boundary criteria that used to choose the routes are soil type and ground water wells level. By using spatial multi criteria decision analysis and GIS, three routes are resulted. Two Metro lines have been chosen based on soil type, and level of ground water wells boundaries. The length of Line One equals 4.283 km and passes through six stations while length of Line Two equals 6.907 km and passes through eight stations. The Metro mode can be extended to reach new places that will be important and densely populated in the future. It is recommended to extend the Metro network to include other areas in Gaza Strip by connecting the Metro network of the City with northern and southern governorates to solve traffic congestions in the future.
Keywords: Gaza City, Metro Network, GIS, Multi-criteria Analysis, Public Transport
I.
INTRODUCTION
II.
THE
STUDY
AREA
Gaza City is located in the north of Gaza Strip at the southern side of the Palestinian coast on the Mediterranean. It is considered the largest Palestinian City in terms of population, and the second in terms of area compared to Jerusalem. The City's population reached 754,321 people in 2016, which is considered the largest gathering of Palestinians in Palestine [10]. The City area is about 56 km2, which making it one of the most densely populated cities in the world. Knowing that Gaza Strip population exceeds 2 million people in 2016 that are distributed over an area of 365 km2 [11]. Gaza City consists of 17 quarters, as shown in Fig. 1.
Figure 1: Gaza City location and its quarters
III.
DATA
COLLECTION
Data assembled in this study should include the following; Gaza population, vital places, road network, traffic data, land use, ground water levels in the City, soil type as well as planning standards related to this kind of research.
3.1 Gaza Population
Table 1 shows the population number in 2015 and the expected in 2037 for all quarters of Gaza City. Al-Shatte'a quarter is the largest quarter in terms of population, where the population is 118513 people in 2015. On the other hand, Al-Zitoon quarter is the largest quarter in terms of area, which reaches about 11329 donum
.
Table 1: Population growth for Gaza City quarters [10]
Gaza Quarter Name
2015 Year 2037 Year
Population Inhabitant
Area Donum
Density Inh./Donum
Population Inhabitant
Density Inh./Donum
Al-A'wda 10864 764 15 23156 31
Al-Sheekh Rodwan 47405 1025 47 101045 99
Al-Nasser 43455 2044 22 92624 46
Al-Shatte'a 118513 975 122 252611 260
Al-Remal Alshamaly 28970 2379 13 61749 26
Al-Darag 65840 2430 28 140340 58
Al-Tofah 54648 2898 19 116482 41
Al-Jdaidh 47076 2754 18 100343 37
Al-Torcoman 63207 2899 22 134726 47
Al-Zitoon 86909 11329 8 185248 17
Al-Ssabra 36212 1516 24 77187 51
Al-Balda Algadema 36212 701 52 77187 111
Al-Remal Al-janoby 39833 2754 15 84906 31
Tal-Al-hawa 11588 794 15 24700 32
3.2 Vital Places in Gaza City
Gaza City, as a capital City of Gaza Strip, is a source of attraction for all people from various districts of Gaza Strip. It involves many vital places, which help to attract students, businessmen and patients as the main source of vital places. It also contains many of vital centers such as universities, hospitals, companies, public and private institutions, sport centers, ministries, and other vital facilities, as shown in Fig. 2.
Figure 2: Gaza City vital places [10] 3.3 Gaza Road Network
Fig. 3 shows all road network in Gaza City, which are divided into primary, secondary, service, residential, track, and footway roads. All data of important roads in Gaza City including running and limit speeds, surface type, width, length and others are documented.
Figure 3: Gaza City roads [10] 3.4 Traffic Data
Two types of traffic data are obtained; the first one is the geographic location of available parking places near the important intersections in Gaza City and the second one is the importance level rank of each intersection according to traffic factors.
3.4.1 Parking Places in Gaza City
Data about parking locations in the City are gathered based on information from officials in Gaza Municipality and organized interviews with number of drivers that use these parking places, Fig. 4.
3.4.2 Traffic Importance Rank of Each Intersection
Fifty major intersections have been identified in Gaza City, based on traffic data count of vehicles at the City intersections. Traffic data count is obtained from the Ministry of Transport records and other counts conducted by researchers and professors at the Islamic University of Gaza. This information relating to the degree of importance of each intersection is ranked as: number 10 is the most importance (high traffic count) and number 1 is the least importance (low traffic count).
3.5 Gaza Land Use
Gaza City is composed of several areas, including agricultural, residential, vacant, and traffic lands, as shown in Fig. 5. The total area of agricultural lands is about 35.86 km 2, residential lands is about 10 km2, vacant land is about 7.32 km2, and traffic land area is about 6.79 km2.
Figure 5: Gaza City land use [10]
3.6 Groundwater Wells Level in Gaza City
Data have been obtained regarding the level of all groundwater wells in Gaza Strip during the period from 2000 to 2010. Levels of groundwater wells (the distance between the natural surface of the earth and the water level of the aquifer) ranges from 16.63 m in the western area of the City on the coast line of the Mediterranean Sea to 73.55 m in the eastern area of Gaza City, Fig. 6.
Figure 6: Groundwater wells level in Gaza City 3.7 Gaza Soil
Figure 7: Soil type in Gaza City [10]
3.8 Planning Standards Related to Metro Project
The Ministry of Planning prepared a guide for systems and spatial planning standards in order to determine the size, density, location, and location requirements for different kind of land use. Data that have been obtained is related to the characteristics of the City quarter, which is a part of Metro project. Services in a quarter are five times the services in the neighboring with the provision of other extra services required at the whole level of the quarter [12]. The total area required for public services in the neighboring about 32.5 donum. The total area required for housing and services in the neighboring about 97.5 donum. The total area required for the transport 25% of the total area of the neighboring. Total area of the neighboring equals 130 donum (97.5/0.75). The necessary extra space in the quarter has allocated of services at the local level and the roads in which they serve. The total area required for the local center is equal to five times the area of neighboring added to the 36 donum and the necessary roads for it. Total area equals 698 donum (130*5) + 36/0.75. Quarter density = 4300/698 = 6.1 housing unit/donum. The geographic area of the planned Metro-rail project (network system) is given by the polygon map “Buffers” and is shown in Fig. 8. This map has a total of 50 Buffers. Considering that every buffer is a quarter containing all the necessary vital facilities. The total area of the buffer equals the total area of the quarter (698 donum). Thus, a 500 m buffer radius is considered to match this area. To each of these polygons, an identifier code is assigned from S1 to S50. Buffer attributes are the geometric area in square meters containing many data such as vital places, population, land use and traffic data. There are two determinants or control borders of data relating of Gaza City as a whole; one of them relates to soil type in the City, and the second corresponds to groundwater wells level.
Figure 8: 500 m buffer of each intersection
IV.
IDENTIFYING
ASSESSMENT
CRITERIA
places , C3 = Available parking, C4 = Traffic importance of each intersection, C5 = Area of each intersection, and C6 = Land use. Each intersection buffer of each criteria is ranked using equal intervals classification method. In this classification method, each class consists of an equal data interval along the dispersion graph. To determine the class interval, the whole range of data (highest data value minus lowest data value) is divided by the number of classes that is decided to generate, as computed by equation 1.
, (1)
After that, the resulting class interval is added to the lowest value of data-set, which gives the first class interval. Adding this interval as many times as necessary in order to reveal the number of predefined classes (10 classes are considered). Rank 1 represents the lowest importance and rank 10 is used of the highest importance. As an example of ranking for C3, the number of parking of each intersection, each intersection buffer is classified based on number of available parking, where the high number represents the best buffer which has high rank, and low number represents the worst buffer which has low rank, as shown in Fig. 9. Fig. 10 shows the rank of each buffer according to its criteria using GIS tools.
Figure 9: Rank of available Parking intervals
V.
WEIGHTING
EVALUATION
CRITERIA
To choose the suitable locations of Metro-rail stations, only one specific objective from each set of the six sets of the major objectives is selected. Each of previous criteria has a weight which is confirmed by experts in road engineering and transport systems. The total of all criterion weights must sum to 100 as shown in Table 2. From spatial analyst in GIS software, the composite suitability score of all previous raster data can be calculated to obtain one suitability map which concludes all criteria data. This can be calculated by multiplying each criteria rank by its weight according to equation 2.
,
Where:
S: the composite suitability score,
Table 2: The total of all criterion weights
No. Criteria Weight (%)
C1 Population density 30
C2 Number of vital places 30
C3 Available parking at each intersection 15
C4 Traffic importance of each intersection 10
C5 Area of each intersection 10
C6 land use 5
Total 100
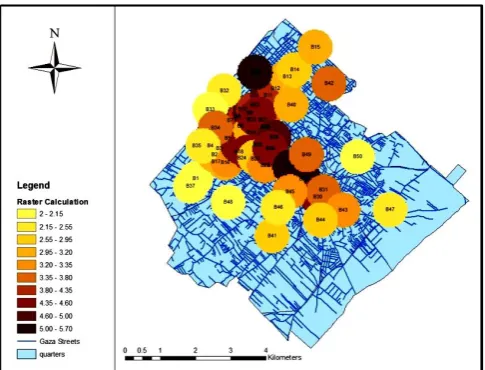
Each buffer of each intersection have a composite suitability score, where the buffer with low rank is the worst case (buffer with light color), and the buffer with high rank is the best case (buffer with dark color). Selection of the best stations of Metro lines can be based according to all composite suitability scores map of each intersection buffer as shown in Fig. 11.
VI.
SELECTION
OF
METRO
SITE
ROUTE
To draw the best Metro line routes, the best buffer that have high score should be chosen, as a Metro line station taking into account the distance between stations to match the international standards that have been reviewed in Section One. The longest tunnel distance between two stations is 2.5 km and the shortest distance is 297 m [13]. In addition, the level of groundwater wells in Gaza City and soil type that Metro routes may pass through should be considered. Reference [13] displays the minimum depth of Metro station requirement as 4.3 m which is achieved in its case for Gaza City. After connecting between the best buffers based on the criteria that have been mentioned, three Metro lines can be obtained as shown in Fig. 12.
Figure 12: The three Metro lines
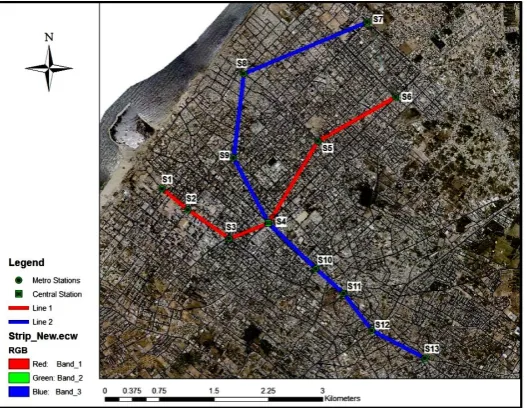
Because of the convergence of Line 2 (red color) and line 3 (green color), and because that both have the same origin and destination, one of them should be chosen. Line 2 is located to the east of Line 3, in the best sandy soil. In addition, the level of groundwater wells ranges from16.63 m in the western area of the City at the coast line of the Mediterranean Sea to 73.55 m in the eastern area. This means that the depth of water level of aquifer will increase if it heads towards the east. Metro line is established in the area above the water level of the aquifer and below the natural ground level. Thus, Line 2 is preferred than Line 3. Fig. 13 shows the two suggested routes of Metro which have been chosen. Table 3 summarizes all data of the two Metro lines such as, number of each station, distance between stations, total length of each Metro line.
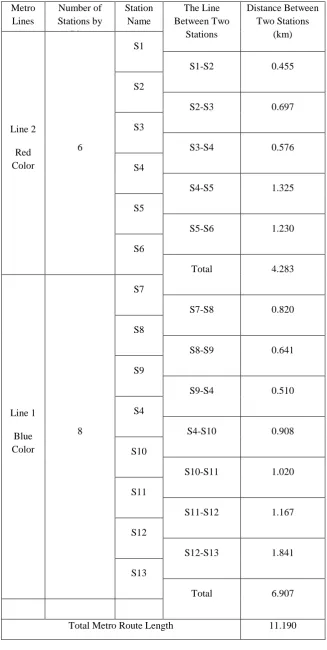
Table 3: Summery data of the two Metro lines Metro Lines Number of Stations by Line Station Name The Line Between Two Stations Distance Between Two Stations (km) Line 2 Red Color 6 S1
S1-S2 0.455
S2
S2-S3 0.697
S3
S3-S4 0.576
S4
S4-S5 1.325
S5
S5-S6 1.230
S6
Total 4.283
Line 1
Blue Color
8
S7
S7-S8 0.820
S8
S8-S9 0.641
S9
S9-S4 0.510
S4
S4-S10 0.908
S10
S10-S11 1.020
S11
S11-S12 1.167
S12
S12-S13 1.841
S13
Total 6.907
VII.
FUTURE
EXTENSION
OF
METRO
NETWORK
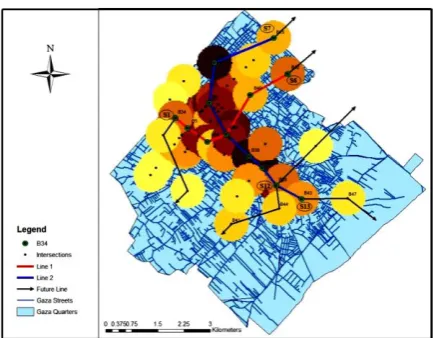
The suggested Metro routes can be extended to reach new places which will be important and densely populated in the future. When creating Metro lines, attention is paid to consider the important buffers which are located at the border of North, South and East of Gaza City as the main stations that Metro network start for expansion to include other areas in the City as well as outside the City. Fig. 14 illustrates these stations; station S6, and S7 which connects Gaza City with Northern Governorate, where Line 1 or Line 2 can reach to the northern regions, station S1 which connects Gaza City with Southern Governorate, station S13 which links Gaza City with eastern regions, and station S12 which connects Gaza City with Northern and Southern Governorates through establishment of a third Metro Line.
Figure 14: Future extension of the Metro network
VIII.
CONCLUSION
AND
RECOMMENDATIONS
Fifty intersections in Gaza City have been chosen as candidate sites for Metro-rail stations, with 500m buffer of each intersection. The criteria that used to choose the best stations of Metro line was population density, vital places, available parking, area of intersection, traffic important of intersection, and land use. The criteria boundary that used to choose the best line was soil type and ground water wells level. By using multi criteria decision analysis and GIS, three routes are resulted. Two Metro lines have been chosen based on soil type, and level of ground water wells boundaries. The length of Line One equals 4.283 km and passes through six stations while length of line two equals 6.907 km and passes through eight stations. The Metro mode can be extended to reach new places that will be important and densely populated in the future. As a result of this study, the following recommendations are depicted:
1. Effective measures in the short term to improve the public transport services as part of a comprehensive long term transport plan should be taken by Ministry of transport.
2. Formation of a committee to develop an integrated strategy to start implementing the steps to create Metro project that includes members of General Authority for Investment, Ministry of Public Works and the Ministry of Transport.
3. Developing a feasibility study for the Metro project to find out the total cost of the establishment and operation.
4. Using of international companies specialist of Metro projects that is enjoyment of a long and broad experience in infrastructure projects, through the development of preliminary studies, which include the general plan, capital costs and technical perceptions of the project.
5. Implementation of economic feasibility studies on both technical and financial support, and make recommendations about the best way to restructure the project, in addition, choosing the authority that oversees the development, operation and maintenance of the Metro network, taking into account the building, operating, and transport mechanism
6. Renovation of the road and transportation network to increase access to many areas, which leading to an increase in the value of land, land use change, and economic returns.
8. Added waiting grouped areas near Metro stations, whether horizontal or vertical parking to encourage private car users to use the Metro.
9. Development of suburban areas that are the Metro up to it, through creation of Metro service centers pulls them some activities accumulated in the central City due to its ease of access and cheap price of land. 10. Re planning pedestrian paths within surrounding areas of Metro stations with adequate widths for these
paths and linking them by elements of coordination of the site and taking into account the visual elements and aesthetic.
REFERENCES
[1] Litman, T. Evaluating public transit benefits and costs. Practice Guidebook, Victoria Transport Policy Institute, USA, 2017.
[2] The regional public transportation agency -Valley Metro. Design Criteria Manual. [Online], available at <http://www.valleymetro.org>
[Accessed 17 September, 2015].
[3] Farkas, A. Route/site selection of urban transportation facilities: an integrated GIS/MCDM approach. MEB 2009–7th International
Conference on Management, Enterprise and Benchmarking, June 5‐6, 2009, Budapest, Hungary.
[4] Hammadi, I.; Mesbah, S.; Maher, Kh. Transportation Network Design Using GIS–Based DSS: Baghdad Metro Case Study. Recent
Advances in Systems Engineering and Applied Mathematics, Selected Papers from the WSEAS Conferences in Istanbul, 2008, May 27-30, Turkey.
[5] Malczewski, J. GIS‐based multicriteria decision analysis: a survey of the literature. International Journal of Geographical Information
Science, 2006, 20(7), pp. 703-726.
[6] Ascough II, J.; Rector, H.; Hoag, D.; McMaster, G.; Vandenberg, B.; Shaffer, M.; Weltz, M.; Ahuja, L. Multicriteria spatial decision
support systems: overview, applications, and future research directions. Environmental Modeling and Software Society Conference on Integrated Assessment and Decision Support, 2002, (3), pp.175–180.
[7] Mejia-Dorantes, L.; Paes, A.; vassallo, J. Transportation infrastructure impacts on firm location: the effect of a new metro line in the
suburbs of Madrid. Journal of Transport Geography, 2012, 22, pp. 236-250.
[8] Roukouni, A.; Basbas, S.; Kokkalis, A. Impacts of a Metro Station to the Land Use and Transport System: The Thessaloniki Metro
Case. Procedia-Social and Behavioral Sciences, 2012, 48, pp. 1155-1163.
[9] El-Hallaq, M.; El-Yazory, Kh. An Investigation to Select "Metro" as a Public Transportation Mode in Gaza City. International Journal
of Research in Engineering and Science (IJRES), 2016, Volume 4, Issue 12, pp.18-28.
[10] Municipality of Gaza. Population of Gaza City Quarters for Year 2015. available at <http://www.gaza-city.org> [Accessed November,
2016].
[11] The Palestinian Ministry of interior - Civil Affairs. Gaza Population. [Online] available at <http://www.moi.gov.ps/news/109807/>
[Accessed November, 2016].
[12] The Palestinian Ministry of Planning and Foreign Affairs. Manual systems and standards planning. 2008, Gaza, Palestine. ( Arabic
reference)
[13] Society of Transport of Montreal - STM. Stations. [Online]. available at <http://www.metrodemontreal.com/faq/stations.html>
![Table 1: Population growth for Gaza City quarters [10] 2015 Year 2037 Year](https://thumb-us.123doks.com/thumbv2/123dok_us/1365316.1646022/2.595.128.472.175.373/table-population-growth-gaza-city-quarters-year-year.webp)
![Figure 2: Gaza City vital places [10]](https://thumb-us.123doks.com/thumbv2/123dok_us/1365316.1646022/3.595.204.392.148.299/figure-gaza-city-vital-places.webp)
![Figure 5: Gaza City land use [10]](https://thumb-us.123doks.com/thumbv2/123dok_us/1365316.1646022/4.595.194.401.476.675/figure-gaza-city-land-use.webp)
![Figure 7: Soil type in Gaza City [10]](https://thumb-us.123doks.com/thumbv2/123dok_us/1365316.1646022/5.595.187.407.514.687/figure-soil-type-in-gaza-city.webp)