e
-ISSN: 2278-067X,
p
-ISSN: 2278-800X, www.ijerd.com
Volume 7, Issue 9 (July 2013), PP. 01-09
Study of the Influence of Crop, Machine & Operating
Parameters on Performance of Cereal Threshers
Engr. C.O. Osueke (Ph.d, Post Ph.d)
Senior Lecturer, Landmark University, Omu-Aran, Kwara State, Nigeria.
Abstract:- Threshing as a post-harvest operation is as old as man. The evolution of mechanical threshers to secure the ever growing consumption of cereal has been hindered by several factors which have lead to low performance of several developed threshers. It has been discovered and observed by various researchers that performance of cereal threshers is highly dependent on the value of its working parameters. This work gives an insight into influence of crop, machine and operating parameters on performance of cereal threshers using a computer aided software for simulation of these parameter values. The parameters were varied at six levels and the simulations were performed by varying each parameter while the rest parameters were kept constant. It was observed that threshing efficiency increased for all increasing values of cylinder speed and bulk density, decreased for all increasing values of feed rate and concave clearance, and increased for increasing values of moisture content up to 17% and decreased after wards. Also threshing loss was found to increase for all increasing values of feed rate and concave clearance, decreased for all increasing values of cylinder speed and bulk density, and decreased for all increasing values of moisture content up to 17% and then increased after wards, similar effects on the efficiency and losses was observed in the capacity and unthreshed grain cases respectively. Thresher capacity and rate of unthreshed grain also showed significant reactions as these parameters were varied.
Keywords:- Threshing, Cereal, Study, Performance, Machine parameters, Crop parameters, Operating parameters,
I.
INTRODUCTION
The quality and availability of cereals in the global market is highly dependent on the threshing process. A wrong selection of threshing conditions which in this case are the machine and crop parameters leads to low threshing performance and grain loss. Grain/threshing loss is measured in terms of grain damage while threshing performance is measured in terms of threshing efficiency, thresher capacity and threshing loss. In Africa and more especially Nigeria, the annual consumption of cereal is fast increasing. This rate has challenged the indigenous farmers’ production volume and is gradually catching up on the global market production. The scheme as shown in figure 1 below explains it all.
Fig. 1: Scheme of cereal demand and supply system analysis model [1]
The only available option left with is to consider the augmentation of food supplies by bringing more area under cereal cultivation or by reducing post harvest losses. According to a most conservative estimate, about 10% of the cereals harvested in developing countries are lost annually [2]. This suggests that efforts should be channelled towards minimizing losses in post-harvest of cereals.
Crop factors
Variety of crop
Moisture content of crop Machine factors
Feeding chute angle Cylinder type and diameter Spike shape, size and number Concave size, shape and clearance Operational factors
Cylinder speed
Feed rate, method of feeding Machine adjustment
Researchers have paid great attention to these factors and tried to obtain optimal parameter values by varying these parameters at different levels. Maertens and Baerde Macker (2003) [11] investigated the effect of different feed rates on grain separation. Kutsbach (2003) [12] exposed the separation parameters of separation units. Wacker (2003) [13] showed that crop properties has a great influence on the separation of cereal crops. Strivastava et al., (1990) [4] noted that the grain separation is very sensitive to variation in the physical properties of grain, straw and chaff. El-Behery et al., (2000) [5] performed threshing tests on El-Shams rice thresher. It was done using a range of drum speeds, feed crop rates and length of conveyor chain tension at four different levels of capsule moisture content. Optimum performance was gotten at threshing drum speed, feed rate and length of conveyor tension of 31.43 m/s, 20kg/min and 48mm respectively at 18.45% moisture content of grain. The grain damage was quite minimal (1.78%). Chandrakanthappa et al., (2001) [6] also conducted test using a asp bar type multi-crop thresher to thresh finger millet. Optimum performance as threshing efficiency of 79.61% and mechanical damage of 2.95% were obtained at 4mm concave clearance, 1000 rpm (1200m/min) thresher drum speed and grain moisture content of 10% wet basis. Johnson (2003) [7] proposed that a thresher should be operated at the lowest cylinder speed that will shed the most grain with acceptable levels of damage to grain. Desta and Mishra [8] developed and conducted performance evaluation of a sorghum thresher. A combination feed rate at three levels (6, 8, 10kg/min), cylinder concave clearance at two levels (7 and 11mm) and cylinder speed at three levels (300r/min, 400r/min & 500r/min) were studied. Their results showed that threshing efficiency increased with an increase in cylinder speed for all feed rate and cylinder concave clearances. The threshing efficiency was found in the range of 98.3% to 99.9%. Sead et al., [9] evaluated a hold paddy thresher. Cylinder speeds and crop feed rates were varied at three levels. The results obtained from the study showed that at optimum condition of 550r/min cylinder speed, the grain damage was found to be 0.4% while the threshing efficiency was 99.2%. Radwan et al., [10] performed study on the El-Shams type tangential axial flow cereal thresher as developed. It was found that increasing rotor speed tends to increase the threshing efficiency. At air speed (4.8m/s) and moisture content (10.36%), increasing rotor speed from 500 to 700rpm increased the threshing efficiency from 70.2 to 73.7%.
Most of these researchers performed their study on a spiked tooth drum thresher study whereas Sugjan et al., (2002) [14] study on the effect of drum type, drum speed and feed rate states that the rasp bar drum type showed more reduction in the proportions of material other the grain passing through the concave. Also the frictional impact that occur on the rasp bar drum beaters which constitute threshing effect has been neglected with more focus on impact alone. Addo et al., (2004) [15] reported that the rasp bar drum type provides more surface area for frictional impact.
The aim of this work was to study the influence of these machine, crop and operational factors on the thresher performance of the rasp bar drum type in-cooperating the frictional impact effect on the drum beaters.
II.
MATERIALS
AND
METHOD
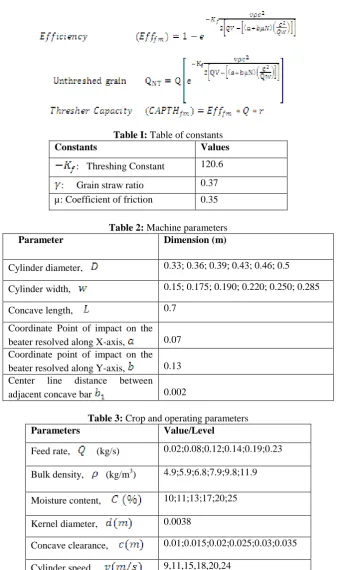
Table I: Table of constants
Constants Values
: Threshing Constant 120.6
: Grain straw ratio 0.37 µ: Coefficient of friction 0.35
Table 2: Machine parameters
Parameter Dimension (m)
Cylinder diameter, 0.33; 0.36; 0.39; 0.43; 0.46; 0.5
Cylinder width, 0.15; 0.175; 0.190; 0.220; 0.250; 0.285
Concave length, 0.7
Coordinate Point of impact on the beater resolved along X-axis, 0.07 Coordinate point of impact on the beater resolved along Y-axis, 0.13 Center line distance between
adjacent concave bar 0.002
Table 3: Crop and operating parameters
Parameters Value/Level
Feed rate, (kg/s) 0.02;0.08;0.12;0.14;0.19;0.23
Bulk density, (kg/m3) 4.9;5.9;6.8;7.9;9.8;11.9
Moisture content, 10;11;13;17;20;25
Kernel diameter, 0.0038
Concave clearance, 0.01;0.015;0.02;0.025;0.03;0.035
Cylinder speed, 9,11,15,18,20,24
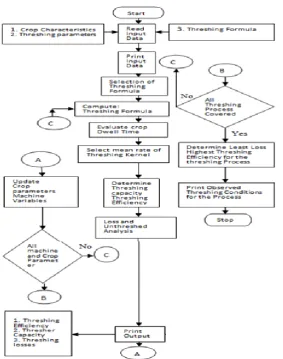
Fig. 2: Flow chart of the developed model
III.
RESULT
AND
DISCUSSION
After performing the simulation, the best outputs for the various parameters are shown in table 4-8 below.
Table 4: Output for the effect of cylinder speed variation
V GM ρ Q c μ TE(%) TNL(%) CAPTH(Kg/hr) UT(Kg/s) 9 18 11.9 0.14 0.015 0.35 40.71 59.29 75.92 0.083 11 18 11.9 0.14 0.015 0.35 47.21 52.79 88.05 0.074 15 18 11.9 0.14 0.015 0.35 58.16 41.84 108.45 0.059 18 18 11.9 0.14 0.015 0.35 64.85 35.15 120.93 0.049 20 18 11.9 0.14 0.015 0.35 68.7 31.3 128.12 0.044 24 18 11.9 0.14 0.015 0.35 75.19 24.81 140.22 0.035
Table 5: Output for the effect of feed rate variation
Q ρ GM v c μ TE(%) TNL(%) CAPTH(Kg/hr) UT(Kg/s)
0.12 6.8 25 24 0 0.4 93.32 6.68 149.155 0.008
0.13 6.8 25 24 0 0.4 90.88 9.12 157.37 0.012
0.15 6.8 25 24 0 0.4 85.73 14.27 171.3 0.021
0.17 6.8 25 24 0 0.4 80.62 19.38 182.55 0.033
0.19 6.8 25 24 0 0.4 75.77 24.23 191.77 0.046
Table 6: Output for the effect of concave clearance variation
C v ρ Q GM μ TE(%) TNL(%) CAPTH(Kg/hr) UT
0.01 24 12 0.08 25 0.35 99.99 0.01 306.36 4E-10
0.015 24 12 0.08 25 0.35 93.18 6.82 290.23 8E-05
0.02 24 12 0.08 25 0.35 85.26 14.74 270.11 0.0015
0.025 24 12 0.08 25 0.35 73.86 26.14 258.34 0.016
0.03 24 12 0.08 25 0.35 60.21 39.79 226.28 0.06
0.035 24 12 0.08 25 0.35 42.44 57.56 190.1 0.132
Table 7: Output for the effect of bulk density variation
Ρ v Q GM c μ TE(%) TNL(%) CAPTH(Kg/hr) UT(Kg/s) 4.9 24 0.23 20 0.015 0.35 72.35 27.65 221.64 0.064
5.9 24 0.23 20 0.015 0.35 78.73 21.27 241.19 0.049
6.8 24 0.23 20 0.015 0.35 83.2 16.8 254.89 0.039
7.9 24 0.23 20 0.015 0.35 87.41 12.59 282.93 0.029
9.8 24 0.23 20 0.015 0.35 92.35 7.65 282.93 0.018
11.9 24 0.23 20 0.015 0.35 95.59 4.41 292.86 0.01
Table 8: Output for the effect of grain moisture content variation
GM ρ v Q c μ TE(%) TNL(%) CAPTH(Kg/hr) UT(Kg/s)
10 4.9 9 0.08 0.015 0.35 79.96 20.04 85.21 0.016
11 4.9 9 0.08 0.015 0.35 83.24 16.76 88.7 0.013
13 4.9 9 0.08 0.015 0.35 88.27 11.73 94.06 0.0094
17 4.9 9 0.08 0.015 0.35 94.26 5.74 100.44 0.0046
20 4.9 9 0.08 0.015 0.35 76.3 23.7 91.27 0.0082
25 4.9 9 0.08 0.015 0.35 42.76 57.24 70.44 0.012
Also a plot of their effect on the performance as regards threshing efficiency, threshing loss and thresher capacity are shown in figure 3-12 below.
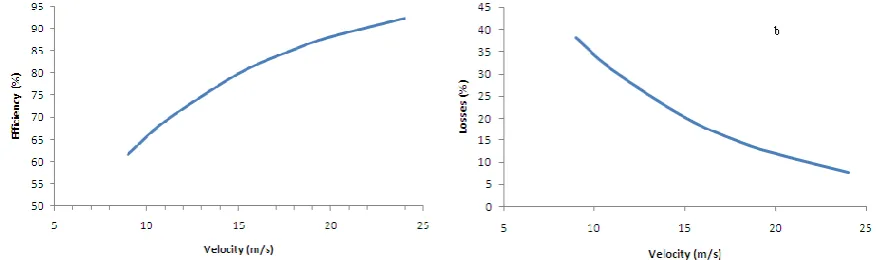
Fig. 3: Effect of cylinder speed on threshing efficiency and (b) losses
It was discovered that:
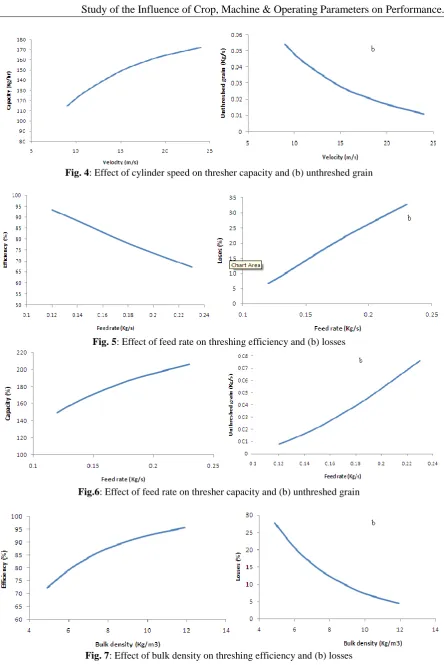
Fig. 4: Effect of cylinder speed on thresher capacity and (b) unthreshed grain
Fig. 5: Effect of feed rate on threshing efficiency and (b) losses
Fig.6: Effect of feed rate on thresher capacity and (b) unthreshed grain
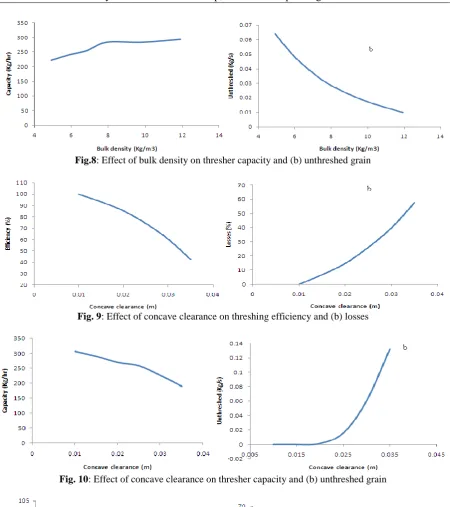
Fig.8: Effect of bulk density on thresher capacity and (b) unthreshed grain
Fig. 9: Effect of concave clearance on threshing efficiency and (b) losses
Fig. 10: Effect of concave clearance on thresher capacity and (b) unthreshed grain
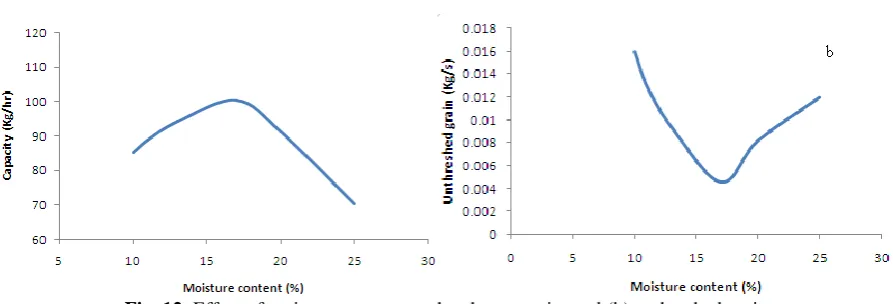
Fig. 12: Effect of moisture content on thresher capacity and (b) unthreshed grain
Fig. 3. The amount of grain threshed per unit time (Capacity) increased with velocity, and flow rate of the unthreshed grain was found to be vice versa. Fig. 4
When feed rate increases, threshing efficiency decreases. The reasons being that for a high feed rate, the threshing rate is less and the kernels, would take longer time to travel through the mat. Furthermore the concept of energy balance employed by Bittner et al, (1968) [17] is expressed by
Eimpact = Eabsorbed by cushion + Eabsorbed by specimen + Erebound
Using the above equation to explain fig 5, it can be deduced that at low feed rate, the energy available at the threshing drum are absorbed by the grains for the removal of the kernel heads from the stalks, then as feed rate increases, more grains cluster within the threshing drum which reduces the individual energy absorbed by the grains, while increasing the cushioning effect thereby reducing efficiency. At a feed rate of 0.01Kg/s the energy absorbed by cushioning, Energy absorbed by the grains and energy of rebound of grains are at a state of equilibrium. This leads to a biphasic graph depicting a phase of high reduction in threshing energy and the other a phase of high cushioning. An increase in the feed rate resulted in an increase in threshing losses (Fig. 5b.). This might be due to the fact that the level of losses is related to cushioning effect by the crop during threshing. At higher feed rate crop stream between cylinder and concave becomes denser. Also upon critical observation it was discovered that a mirror effect of fig. 5 is produced, since Eff = 1 – losses and Losses = 1 – Eff. So it implies that as efficiency reduces, losses increases which explains its biphasic nature depicting a high reduction in threshing energy while increasing cushioning effect. The capacity of the system was found to increase while the feed rate increases. This is because an increased flow of panicle into the system automatically demands an increased yield of grain. The flow of unthreshed grain was found to increase with increase in feed rate which could be explained by the losses phenomena. This means that a grain will thresh more perfectly if it has more grain to grain allowance within the threshing cylinder. The statistical analyses are shown below.
Increasing the bulk density increases the threshing efficiency (Fig. 7). This might be due to the crop stream between the cylinder and the concave becoming denser, thus providing less cushioning for the grains, since volume flow rate is expressed as feed rate divided by material density. The losses decreased as bulk density increased thus revealing a true image of the efficiency picture (fig. 7b). The thresher capacity increased as bulk density increased (fig. 8). Also the flow of unthreshed grain was found to decrease as the bulk density increased(fig 8b).
Decreasing the concave clearance resulted in increased threshing efficiency and thresher capacity (Fig. 9&10), while an increase in concave clearance led to an increase in threshing losses and flow of unthreshed grain (Fig 9b&10b). Decreasing concave clearance may have increased the chance of a grain being struck by the bar or spike and increased the chance of multiple impacts to the grain before it passed from the threshing zone. Since the best threshing operation is obtained at a moisture content of 17%. It was found that increasing the moisture content resulted in increased threshing efficiency to 17% level and then subsequent reduction (Fig. 11) The losses were found to decrease until the 17% level thereafter started increasing (Fig. 11b). A similar effect on the efficiency and losses was observed in the capacity and unthreshed grain cases respectively (Fig. 12&12b).
IV.
CONCLUSIONS
As the cylinder speed increases, the threshing efficiency increased, the threshing loss reduced, the thresher capacity increased while the unthreshed grain rate reduced. minimum grain loss of 4.41% was observed at a cylinder speed of 24m/s
Increase in feed rate had a negative effect on the thresher model. Feed rate of 0.23kg/s showed to be most suitable with performance characteristic of 95.59%, 4.41% losses, 292.86kg/hr capacity and unthreshed grain rate of 0.01kg/s.
A concave clearance of 0.01m was found most ideal for the threshing system given a yield of 99.99% threshing loss, 306.36kg/hr thresher capacity.
The most acceptable bulk density of cereal for threshing operation as suggested by this study is 11.9%. This had an impressing result on the thresher performance.
For efficient threshing operation, a moisture content of 20%(wb) is advised. This value of moisture content showed a realizable threshing performance in agreement with Osueke (2011) [16] experimental model.
ACKNOWLEDGMENT
The author appreciates Prof. Omenyi for his full support in conducting this research. Gratitude also goes to Prof. Adeniyi Jones for standing by my success and special thanks to Engr. Nwabueze Iwuchukwu for his immense contribution towards this research.
REFERENCES
[1]. Betru, S. & Kawashima, H. (2010). African cereal demand and supply analysis: Past trends and future prospect. African journal of Agricultural Research, volume 5 (20), pp. 2757-2769
[2]. Chaudhry, M.A. 1982. Food grain losses at farm level in Pakistan. Vol. 1. Department of Agricultural Marketing. Faculty of Agricultural Economics and Rural Sociology, University of Agriculture, Faisalabad.
[3]. Documents. Retrieved from ministry of Agriculture, Government of India. Website:http://www.agricorp.nic.in/dacdivision/machinery/chap5a.pdf
[4]. Srivastava, A.K., Mahoney, W.T., West, N.L., 1990. The effect of crop properties on combine performence. Trans. of ASAE. 33, 63-72.
[5]. El-Behery A. A.; I. S. E. Yousef; S. A. F. El-Kady (2000) " Studies on flax threshing using a local paddy thresher" Egyptian J. of Agric. Res., Vol. 78 No. 1 pp. 489-497.
[6]. Chandrakanthappa, Kammar, Batagurki, S. B. and Kammar. C. (2001). Evaluation of different threshing methods for primary processing of finger millet. Mysore J of Agric. Sci. 35(2): 128-132. [7]. Johnson, R. (2003) " Setting threshers for harvesting best quality seed and field corn" Director,
cooperative Extension service, Iowa state univ. of science and Technology, Ames. Iowa, file: Engin.2-2. “PDCA12-70 data sheet,” Opto Speed SA, Mezzovico, Switzerland.
[8]. Desta K, Mishra T N. Development and performance evaluation of a Sorghum thresher. Agricultural Mechanization in Asia, Africa and Latin America (AMA), 1990; 21(3): 33-37
[9]. Saeed M A, Khan A S, Rizvi H A, Tanveer T. Testing and evaluation of hold-on paddy thresher. Agricultural Mechanization in Asia, Africa and Latin America (AMA), 1995; 26(2): 47-51.
[10]. Radwan, G.G., Salim. R.G., & Al-Ashry, A.S., (2009). Development and test attachments to the tangential flow thresher to suit caraway crop threshing. Misr J. Ag. Eng., 26(3): 1068-1080.
[11]. Maertens, K., De Baerdemaeker, J., 2003. Flow rate based prediction of threshing process in combine harvester. Applied Eng. in Agriculture. 19 (4), 383-388.
[12]. Kutzbach, H.D., 2003. Approaches for mathematical modeling of grain separation. Electronic-only proceeding of the international conference on crop harvesting and processing. Kentucky, USA.
[13]. Wacker, P., 2003. Influence of crop properties on the threshabiliy of cereal crops. Electronic-only proceeding of the international conference on crop harvesting and processing. Kentucky, USA.
[14]. Sudajan, S., Salokhe, V.M., Triratanasirichai, K., 2002. Effect of type drum, drum speed and feed rate on sun flower threshing. Biosystem Eng. 83 (4), 413-421.
[15]. Addo, A., A. Bart-Plange, R.A. Asuboah and K. Dzisi, 2004. Effect of different threshing cylinders on soybean quality. J. Sci. Technol., 24: 121-125.
[16]. Osueke, C.O. (2011). Simulation and Optimization modeling of performance of a cereal thresher. Int. J. Eng. Natural Sci., 11: 143-152.Retrieved from http://www.ijens.org/Vol%2011%20I%2003/117803-9494%20IJET-IJENS.pdf
![Fig. 1 : Scheme of cereal demand and supply system analysis model [1]](https://thumb-us.123doks.com/thumbv2/123dok_us/1377820.1648225/1.595.174.425.519.687/fig-scheme-cereal-demand-supply-analysis-model.webp)