Dynamics Friction Distribution at Disc-Pad Contact
and its Effect on Brake Pad Vibration
Muhammad Zahir Hassan
1, Kumaresan Magaswaran
2, Fudhail Abdul Munir
3, Musthafah Mohd Tahir
3 1Faculty of Engineering Technology, Universiti Teknikal Malaysia Melaka (UTeM), Malaysia2Asia Pacific University of Technology and Innovation (APU), Malaysia.
3Centre for Advanced Research on Energy (CARe), Universiti Teknikal Malaysia Melaka (UTeM), Malaysia
E-Mail: zahir@utem.edu.my
Abstract-An automotive disc brake system is a friction brake of which friction-induced vibration is inevitable. This paper experimentally investigates the friction distributions on the brake disc and pad as in contact during braking period. These distributions are related to the brake pads vibrational deformation to observe its friction induced relationship. A validated mathematical model is then used to extract the friction distributions and the brake pad deformation data simultaneously. The obtained brake pad deformation and the friction distributions are plotted as a function of time to observe the changes in its characteristics during braking as the braking duration increases. The results show that the friction distributions are in dynamic and non-linear relationship with the pad and the disc contacts. Consequently, such inter-dependency strongly affects the vibrational deformation of the brake pad during braking. Index Term-- Automotive Braking noise Deformation Disc brake Pad Friction-induced vibration
INTRODUCTION
The present automotive braking system is highly dependent on the ability to generate enough friction force between the disc brake and pad to retard the motion of the vehicle. The disc and pad have to come into contact to generate friction. When friction is created at the disc and pad contact, the friction-induced vibration phenomena also occurs as a result of the contact. Thus, the understanding of the dynamics at the contact is very important to eliminate or reduce the friction induced vibration. Friction by definition is known as the force acting perpendicular and proportional to the ratio of friction coefficient and the normal force due to brake pressure in the direction opposing the brake disc rotation. Thus, the friction force is dependent on primary two elements which are the brake pressure and the friction coefficient. The understanding of the behaviour of brake pressure and friction coefficient is crucial to comprehend the mechanics at the brake pad and disc contact. Firstly, the friction coefficient influences the brake system instability greatly. Instability is what causes excessive vibration and causes noise during braking. When the brake is engaged, the brake system vibrates in a broad frequency but not all of those vibration results in noise. Only unstable frequency modes produce noise. The unstable frequency modes can be identified by performing a complex eigenvalue analysis. Through this analysis, a positive real part of the value suggests instability and the size of the real part of the value show the tendency of
instability. Instability is more prominent when the friction coefficient increases [1]. Meanwhile, mode coupling also has a higher tendency to occur when the coefficient of friction increases. This shows the effect of the coefficient of friction on the vibrational characteristic of the brake system. This finding was made with the assumption of a constant coefficient of friction, but that is not the case in actual braking. The coefficient of friction fluctuates greatly during braking [2]. The constant friction coefficient which is common in calculations is the average of this fluctuating friction coefficient. The friction coefficients also change as the duration of braking proceeds [3]. This change was associated with temperature increase during braking. The dynamic characteristic of the friction coefficient suggests that the friction force that is generated at the brake pad and disc contact is also highly variable throughout the braking process.
influence the contact of the pad and disc, thus influencing the friction dynamics at the contacts.
The available literature shows that both the friction coefficient and the pressure at the brake pad and disc contact is a dynamic situation. To understand the mechanics of the brake pad and disc contact, both the pressure and friction coefficient have to be taken into consideration and friction force is the bridge that relates both of these factors. The uneven distribution of the contact pressure and the fluctuating coefficient of friction suggests that the friction force acting at the contact is also dynamic in nature. The frictional characteristic needs to be identified to understand the friction induced vibration that occurs in the brake system.
This paper shows the friction force distribution underneath the disc and pad contact interface. This friction force distribution pattern is associated with the vibrational motion of the brake pad to show the presence of friction-induced vibration. The rotational speed of the disc is varied to reveal the effect of speed on the friction-induced vibration of the friction pairs.
METHODOLOGY
The Friction Pair Modelling: Disc Brake
The mathematical model used to study the friction distribution is shown in equation (1). The equation is derived by considering all the forces acting on the brake pads during braking. The brake pad experiences a normal force, dynamic normal force, shear force, damping force and friction force. The brake pad is modelled as an Euler-Bernoulli beam reacting to these forces meanwhile the disc is modelled as a sinusoidal traveling wave shown in equation (2). Detailed derivation and explanation of the equations are discussed in [12,13].
𝜌𝐴
𝑐𝑠𝜕 2𝑤𝑏
𝜕𝑡2
+ 𝐸𝐼
𝜕4𝑤
𝑏 𝜕𝑥4
=
𝑝𝐴
𝑝[𝛿(𝑥 − 𝑥
𝑎) + 𝛿(𝑥 − 𝑥
𝑏)] + 𝑘
𝑝(𝑤
𝑑−𝑤
𝑏)
−𝐾
𝐺 𝜕2(𝑤𝑑−𝑤𝑏) 𝜕𝑥2+ 𝑐
𝑑𝜕(𝑤𝑑−𝑤𝑏)
𝜕𝑡
+ 𝑐
𝑑𝑠𝜕3(𝑤𝑑−𝑤
𝑏)
𝜕𝑡𝜕𝑥2
− 𝜇 ∫ 𝐹
𝑢𝐿 𝑇𝑑𝑢
(1)where,
𝑥𝑎 and 𝑥𝑏= points where piston force is applied 𝑝 = brake pressure
𝐴𝑝= piston area, 𝛿 = delta Dirac function 𝑘𝑝 = pad stiffness coeficient 𝑤𝑏= brake pad motion 𝐾𝐺 = shear modulus 𝑐𝑑= damping constant
𝑐𝑑𝑠= shear damping constant 𝐿 = length of brake pad 𝑢= arbitrary point 𝜌= pad density
𝐴𝑐𝑠= pad cross-section area
𝐸 = pad young modulus 𝐼 = pad moment of inertia
𝑤𝑑 = 𝐴 sin(𝑘𝑥 − 𝑤2𝑡) cos 𝑤1 𝑡 (2)
where,
𝑤𝑑 = motion of the disc 𝑤1 = rotational frequency
𝑡 = time component of the motion. A = disc vibration amplitude 𝑤2= disc vibration frequency
𝑘 = number of vibrational waves in disc 𝑥 = spatial component representing the length of the brake pad.
Data Collection
The brake pad is divided into 15 parts from 𝑥1 to 𝑥15 as shown in Figure 1. This division is arbitrary, higher division would yield result with higher resolution but at the same time increase computational requirements. The value taken by 𝑥1 to 𝑥15 represents the length of the brake pads from 0 m to 0.068 m. The brake pressure used in this simulation is adapted from [14]. Table 1 shows the parameters used for brake squeal test and the coefficient of friction obtained from the test. The data from Table 1 is used to plot Figure 2.
Fig. 1. Brake pad’s x-coordinates
Figure 2 shows the non-linear relationship between the coefficient of friction and the applied brake pressure. From the data of brake line pressure and coefficient of friction, the friction force could then be calculated. The coefficient of friction, 𝜇 by definition is the ratio of normal force, 𝐹𝑛 and friction force, 𝐹𝑓. This is mathematically expressed in equation (3).
𝐹𝑓 = 𝜇𝐹𝑛 (3)
Where else the brake line pressure,𝑝 is the ratio of the acting normal force on the imposed area of the brake piston, 𝐴𝑝. This is shown in equation (4).
𝐹𝑛= 𝑝𝐴𝑝 (4)
By combining equation 1 and equation 2, the resulting equation 3 is used to calculate the friction force using the data from Table 1. Figure 3 is plotted from the calculations made using equation (5).
Brake pad
𝑥
𝑥10
𝑥4 𝑥5 𝑥7 𝑥12𝑥13
𝑥1 𝑥2 𝑥3 𝑥6 𝑥8 𝑥9 𝑥11 𝑥14𝑥15
Disc rotation direction
𝐹𝑓 = 𝜇𝑝𝐴𝑝 (5)
Even though the relationship between the coefficient of friction and brake line pressure is non-linear as can be seen in Figure 2 but the calculated friction force shows a linear relationship with the brake line pressure. These data are used as a benchmark to run the simulation and to verify the simulation results. To run the simulation, the brake line pressure and the coefficient of friction is fixed at 0.2 MPa and 0.35 respectively. Thus, the friction force from the simulations should be approximate to 2 × 10⁻⁴ MN. The speed of the rotating disc is set at three different values which are 83.77 rad/s, 104.72 rad/s and 125.66 rad/s which corresponds to 800 revolutions per minute (rpm), 1000 rpm and 1200 rpm respectively. By using the mentioned parameters, the mathematical model will be used to deduce the reaction at the brake pad at the pad-disc contact in terms of friction force and deformation as a function of time due to the forces acting at points 𝑥1 to 𝑥15.
Table I
Operating conditions of squeal test [13] Piston Area (m2)
A = 2.29 x 10⁻³
Piston Effective Radius r (m) = 0.111 Test
Name
Torque (Nm)
Pressure (MPa)
Speed (rad/s)
Friction coefficient
T01 77.78 0.3341 3.22 0.458
T02 74.41 0.3230 3.23 0.453
T03 37.51 0.2087 6.29 0.354
T04 41.10 0.2222 6.30 0.364
T05 225.73 0.8504 6.29 0.522 T06 210.93 0.8329 6.32 0.498
T09 52.71 0.2471 15.47 0.420
T12 24.28 0.1620 15.49 0.294
T19 37.51 0.1554 25.57 0.475
T25 87.43 0.4016 3.234 0.428
T27 182.26 0.6581 3.23 0.545
T29 18.32 0.1221 100.30 0.295
T35 35.15 0.2304 61.84 0.300
T36 36.38 0.2279 61.47 0.314
T39 34.55 0.1748 41.02 0.389
T40 41.26 0.1976 41.04 0.411
T43 28.73 0.1720 3.22 0.329
T44 83.90 0.3401 3.21 0.485
T45 231.6 0.8062 3.22 0.565
T46 30.01 0.1778 15.51 0.332
T47 95.46 0.3780 3.278 0.497
Fig. 2. Relationship between coefficient of friction and brake line pressure
Fig. 3. Relationship of brake line pressure and friction force
RESULTS AND DISCUSSION
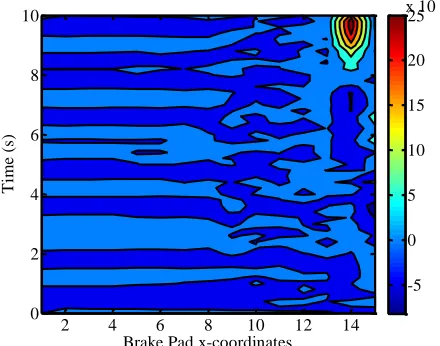
The results are presented as a contour plot viewed at the pad contact interface. The x-axis represents the points at the pad and disc contact as illustrated in Figure 1 and the y-axis are the time component. This applies for Figure 4 to Figure 9. The coloured bar on the right represents the height of deformation of the brake pad off the x-y plane for Figure 4 to Figure 6. For the Figure 7 to Figure 9, the coloured bar on the right represents the friction force. Thus, the results show the changes of brake pad deformation with time and the change in friction distribution with time at the disc-pad contact for the rotational speeds of 800 rpm, 1000 rpm and 1200 rpm.
The plane of the disc and pad contact is the datum of zero, therefore, negative deformation means the brake pad deforms towards the disc, zero deformation means the return of the brake pad to its initial position or shape and a positive deformation points the deflection of the brake pad away from the disc. The deformation of the brake pad shown in Figure 4 to Figure 6 reveals that the deformation is dynamic throughout the disc-pad contact occurrence.
The overall deformation of the brake pad is the oscillation between negative deformation and zero deformation at the trailing end which resembles a bending deformation. The deformation at the leading end is random and uncertain at earlier points in time and develops into a torsional deformation in later points in time. The rotational speed of the disc effect the deformations in both trailing ends and leading ends. At the trailing end, as the rotational speed increases, the frequency of the oscillation between negative deformation and zero deformation also increases. This can be seen in Figure 4 to Figure 6 where the stripes that represent the deformation become thinner and more frequent. At the leading end, the higher rotational speed causes the formation of the torsional deformation to occur earlier in time compared to the lower rotational speed. Between the bending deformation region at the trailing end and the torsional deformation at the leading end, a region where the deformation is totally random exists. The deformation at this region doesn’t show a clear pattern and has a turbulent nature. This mid region is where the bending
0 0.1 0.2 0.3 0.4 0.5 0.6
0 0.2 0.4 0.6 0.8 1
C
o
ef
fi
ci
ent
o
f
fr
ic
ti
o
n
Brake line pressure(MPa)
0.00E+00 2.00E-04 4.00E-04 6.00E-04 8.00E-04 1.00E-03 1.20E-03
0 0.2 0.4 0.6 0.8 1
Fr
ic
ti
o
n
fo
rc
e(
M
N
)
deformation of the brake pad transitions to the torsional deformation. Therefore, the deformational characteristics of a brake pad during braking can be summarized as the transition of bending deformation at the trailing end toward the torsional deformation at the leading end. The leading end also is the region where the highest deformation occurs and can be seen in Figure 4 to Figure 6.
The reason for such behaviour could be associated with the shift in the center of pressure at the contact during braking. These shifting of the center of pressure towards the leading edge of the brake pad have been demonstrated through experiment and also FEA simulations [2,13,15,16]. The shifting of the centre of pressure occurs during braking as the brake pad gets dragged by the rotating disc causing the symmetrical line of the brake pad and brake piston to be offset. Thus, higher pressures are applied towards the leading edge. This causes the uneven deformation of the brake pads. The leading edge which experiences a higher normal force due to higher pressure obtains more excitation force, thus, highest deformation could be seen at the leading end. Due to this shifting of the center of pressure, the trailing end acts like a free boundary where else the leading end is pinned down by the applied pressure.
The brake system continuously disperse energy during braking, the free trailing end vibrates and deforms regularly dispersing the received energy but the pinned leading end has to overcome the resistance imposed by the pressure. Therefore, the brake pad tends to vibrate where at the pressure weakest is followed by the vibration at the region of higher pressure. This causes irregular vibration and torsional bending oscillation. The effort of the brake pad to overcome the resistance of the applied pressure leads to a higher degree of deformation; this can be seen in the results as the leading end shows the highest deformation.
Fig. 4. Brake pad deformation for 800 rpm disc rotational speed
Fig. 5. Brake pad deformation for 1000 rpm disc rotational speed
Fig. 6. Brake pad deformation for 1200 rpm disc rotational speed
The values of the friction force obtained from the simulations are as mentioned in the previous section is in the vicinity of 2 × 10⁻⁴ MN. This validates the friction distribution data. The friction distribution data is shown in Figure 5 to Figure 7 relates to the brake pad deformation data shown in Figure 4 to Figure 6 in term of disc rotational speed. The friction distribution follows closely the deformational pattern of the brake pad. The trailing edge shows similar stripe pattern and where else at the leading edge circular pattern can be seen as shown in the brake pad deformation data.
This shows the influence of friction distribution on the brake pad deformation as the brake pad motion is friction-induced vibration. Highest friction force can be seen at the leading edge where the highest deformation was seen earlier. This is in line with intuition; higher friction force is generated where the centre of pressure is located because the pressure is what produces the normal force that pushes the brake pad towards the disc during braking. The friction distribution at the leading end forms a circular pattern where the centre of pressure is located. This is also where the brake pad exhibits torsional deformation. Brake Pad x-coordinates
T
ime
(s
)
2 4 6 8 10 12 14
0 2 4 6 8 10
-5 0 5 10 15 20 25 x 10-3
Brake Pad x-coordinate
T
ime
(s
)
2 4 6 8 10 12 14
0 2 4 6 8 10
-0.02 -0.01 0 0.01
Brake Pad x-coordinate
T
ime
(s
)
2 4 6 8 10 12 14
0 2 4 6 8 10
This means the friction force dynamically related with brake pad vibrational deformation.
Throughout the friction distribution at all rotational speeds, regions of negative friction and positive friction can be observed. At the trailing end of the brake pad, the friction oscillates between positive and negative values as can be seen in Figure 5 to Figure 7. At higher disc rotational speeds, this oscillation becomes more frequent in which can be seen in Figure 7 that shows more stripes than Figure 5 and Figure 6. These stripes indicate the oscillation of the friction force. At the leading end of the brake pad, it can be seen that the formation of a circular distribution of the friction force occurs gradually in time.
The effect of speed of this formation is that the friction force varies more distinctively at higher speeds. This can be seen in Figure 5 to Figure7 as the increase of speed forms contour lines close to each other indicating that the friction force becomes highly variable at higher speeds. Regardless of the speed, these formations of circular friction distributions oscillate between positive and negative values. This is evident at all speeds and can be seen throughout Figure 5 to Figure 7. The frictional behaviour of the brake pad during braking differs at the trailing end and the leading end. At the leading end, the characteristic of the friction force is the gradual formation of circular distributions pattern and the oscillation between positive and negative just as it occurs at the trailing end. At higher disc rotational speeds, this oscillation becomes more frequent in which can be seen in Figure 7 that shows more stripes than Figure 5 and Figure 6. These stripes indicate the oscillation of the friction force. At the leading end of the brake pad, it can be seen that the formation of a circular distribution of the friction force occurs gradually in time.
The effect of speed of this formation is that the friction force varies more distinctively at higher speeds. This can be seen in Figure 5 to Figure7 as the increase of speed forms contour lines close to each other indicating that the friction force becomes highly variable at higher speeds. Regardless of the speed, these formations of circular friction distributions oscillate between positive and negative values. This is evident at all speeds and can be seen throughout Figure 5 to Figure 7. The frictional behaviour of the brake pad during braking differs at the trailing end and the leading end. At the leading end, the characteristic of the friction force is the gradual formation of circular distributions pattern and the oscillation between positive and negative just as it occurs at the trailing end.
Fig. 7. Friction distribution for 800 rpm disc rotational speed
Fig. 8. Friction distribution for 1000 rpm disc rotational speed
The oscillation of the friction force between positive and negative could be explained by the stick and slip phenomena. Figure 10 shows the mechanism of the stick and slip phenomena which occur in the brake system during braking. When the brake pad and disc comes in contact during braking, the disc rotation, 𝑤2 and the friction force, 𝐹𝑓 is in the opposite direction of each other. Then the friction force deforms the brake pad in the direction of the friction force. During this deformation the rotation of the disc and the friction force are still in opposite direction. This deformation increases with time up to a point where the brake pad will return to its initial shape. At the moment the brake pad returns to its initial shape, the friction forces direction inverts its direction. This is when the friction force becomes negative. Therefore, the negative friction shows the direction of the friction force. This cycle repeats itself throughout the braking period. This phenomenon causes the brake pad to exhibits bending mode vibration at the trailing end as if the trailing end bounces on the disc during braking.
Brake Pad x-coordinate
T
ime
(s
)
2 4 6 8 10 12 14
0 2 4 6 8 10
-1.5 -1 -0.5 0 0.5 1 1.5 x 10⁻⁴
Brake Pad x-coordinate
T
ime
(s
)
2 4 6 8 10 12 14
0 2 4 6 8 10
Fig. 9. Friction distribution for 1200 rpm disc rotational speed
Fig. 10. Stick and slip mechanism of brake pad
CONCLUSION
The paper presents a prediction of friction-induced vibration using a validated mathematical model. The prediction made by the model shows that the friction distribution at the trailing end and leading end causes the vibrational deformation of the brake pad during braking to be bending mode vibration at the trailing end and a torsional mode at the leading end. Thus, it highlights the present of friction-induced vibration at the friction pairs. The effect of the disc rotational speed is the rate of oscillation between the stick moment and slip moment at the trailing end and the rate of formation of circular friction distribution which affects the vibration mode of the brake pad. A higher disc rotation speed gives a higher oscillation rate due to stick and slip moment and a faster rate of formation at the circular friction distribution.
ACKNOWLEDGMENTS
The authors would like to express their gratitude and special acknowledgements to Universiti Teknikal Malaysia Melaka and Ministry of Higher Education Malaysia for the support and continuous research funding.
REFERENCE
[1] X. Meng and G. Zhou. 2009. Analytical investigation of the influence of friction coefficient on brake noise, Proceeding IEEE Vehicle Power and Propulsion Conference, 1803-1807.
[2] A.I. Dmitriev,I., W. Österle and H. Kloβ. 2008. Numerical simulation of typical contact situations of brake friction materials, Tribology International, 41(1), 1-8.
[3] A.A. Yevtushenko and P. Grzes. 2012. Axisymmetric FEA of temperature in a pad/disc brake system at temperature-dependent coefficients of friction and wear,International Communications in Heat and Mass Transfer, 39(8), 1045-1053.
[4] J. Tamari, K. Doi and T. Tamasho, T. 2000. Prediction of contact pressure of disc brake pad,JSAE Review,21(1), 136-138.
[5] M. Tirovic and A.J. Day. 2005. Disc brake interface pressure distributions, Proceedings of the Institution of Mechanical Engineers, Part D: Journal of Automobile Engineering,205, 137-146.
[6] A.R. Abu Bakar, H. Ouyang and Q. Cao. 2003. Interface pressure distributions through structural modifications, SAE Technical Paper: 2003-01-3332.
[7] A. Söderberg and S. Andersson. 2009. Simulation of wear and contact pressure distribution at the pad-to-rotor interface in a disc brake using general purpose finite element analysis software, Wear,267(12), 2243-2251.
[8] M.Z. Hassan, P.C. Brooks and D.C. Barton. 2013. The evaluation of disc brake squeal propensity through a fully coupled transient thermomechanical model, Proceedings of the Institution of Mechanical Engineers, Part D: Journal of Automobile Engineering, 227(3), 361-375. [9] W. Österle, I. Dörfel, C. Prietzel, H. Rooch, A.L. Cristol-Bulthé, G. Degallaix and Y. Desplanques. 2009. A comprehensive microscopic study of third body formation at the interface between a brake pad and brake disc during the final stage of a pin-on-disc test, Wear,267(5-8), 781-788.
[10] M. Müller and G.P. Ostermeyer. 2007. A cellular automaton model to describe the three-dimensional friction and wear mechanism of brake systems, 263(7), 1175-1188.
[11] M.Z. Hassan, P.C. Brooks, D.C. 2008. Thermo-mechanical contact analysis of car disc brake squeal, Proceeding of 26th Annual SAE Brake
Colloquium and Exhibition., 12-15 October 2008, San Antonio Texas, USA. SAE Technical Paper: 2008-01-2566.
[12] K. Magaswaran, A.S. Phuman Singh and M.Z. Hassan. 2013. An analytical model to identify brake system vibration within the low-frequency domain, SAE Paper 2013-01-2033.
[13] M.Z. Hassan, K. Magaswaran, F. Delbressine and M. Rauterberg. 2016. Numerical prediction of brake friction pair vibration using dynamics green’s function, ARPN Journal of Engineering and Applied Science, 11(7), 10374-10386.
[14] S. James. 2003. An experimental study of disc brake squeal, PhD Thesis, Department of Engineering, University of Liverpool.
[15] J.D. Fieldhouse, N. Ashraf and C. Talbot. 2008. The measurement and analysis of the disc/pad interface dynamic centre of pressure and its influence on brake noise, SAE International Journal of Passenger Cars-Mechanical Systems, 1(1), 736-745.
[16] F.A. Munir, M.I.M. Azmi, M.R.M. Zin, N.A.C. Sidik. 2011. Application of Lattice Boltzmann method for lid driven cavity flow, International Review of Mechanical Engineering, Vol. 5 (5), 856-861.
Brake Pad x-coordinate
T
ime
(s
)
2 4 6 8 10 12 14
0 2 4 6 8 10
-4 -2 0 2 4 6 8 10 12 x 10-4
Brake pad
𝐹𝑓
𝑤2
𝐹𝑓
𝑤2
𝐹𝑓

![Table I Operating conditions of squeal test [13]](https://thumb-us.123doks.com/thumbv2/123dok_us/1353638.1644074/3.612.49.294.275.687/table-i-operating-conditions-squeal-test.webp)