STATSFEED: An Extensible Statistics
Collection Framework for Virtualized
Environment
1
Meghana S, 2 Monika M
1
PG Student, Department of CS&E, Channabasaveshwara Institute Of Technology, TUMKUR India
2 Assistant Professor Department of CS&E, Channabasaveshwara Institute Of Technology, TUMKUR, India
Abstract - The main aim of this project is focused on collecting the system logs (CPU usage, memory usage, resource utilization, etc.) which is designed to be used on scalable virtualized environment. For collecting the logs from the hosts and the virtual machines, a performance manager program is used which is written in java using VMware infrastructure API and these hosts are placed on the ESXi hypervisor which is used as server, it is of the type bare metal/type1 hypervisor. This is connected to the vCenter and it gathers the logs from the hosts and the virtual machines. The logs from every VM and host are written into discrete text records appended with the name of those machines. The system is intended to accumulate the insights uncertainly, until it is disturbed on manually. The statistical factors that are gathered which identifies the workloads on the machines are stored in the scalable database called MsSQL( Microsoft SQL Server) which contains both historical as well as transactional data, and then these real time statistics is consolidated and displayed in the form of graphs visually by using the visualization tool like solarwinds etc.
Keywords –Virtualization, VmwareEsxi, Vcenter, Vclient, DPM.
1. Introduction
Virtualization is a proven software technology that combines and divides computing resource of a computer into multiple execution environments and it allows multiple operating systems to run within virtual machines on a single computer. Virtualization technology combines one or more concepts such as hardware and software partitioning, time-sharing, emulation, partial or complete machine simulation and quality of service.
VMware virtualization is a full infrastructure virtualization, resource optimization, management, application availability in an integrated offering. VMware infrastructure virtualizes and aggregates the
physical hardware resources across multiple systems and it provides pools of virtual resources to the data centre.
Virtual machine is software that runs as an operating system and applications. Every virtual machines runs by using single computer resources. The virtual machine is consisting of set of specification and configuration files. Every virtual machine contains virtual devises that provides functionality as physical hardware and it has additional benefits called portability, management and security.
Fig.1: Introduction
The key features of virtual machines are of following.
1. Yet even if all the VMs use the fundamental resources of single machine, they work totally unrelated to each other as similar to part physical hosts. Example if there are five virtual machines on a single host and if two crashes then other three virtual machines are accessible.
applications. It makes virtual machines simple to haven and manage.
3. Virtual machines are totally independent from their physical resources. Virtual machines are capable to complete different operating systems on the similar creature physical server.
One of the major challenge faced in the use of virtual machines, is the collection of logs from the virtual machines. Perform load balancing of virtual machines between hosts and handle power management by using Distributed Resources Scheduler and Distributed Power Management concepts.
2. Proposed System
In virtualization environment the main challenge is to analyse the logs of each host and virtual machine. For better understanding and analysis of the log data, the statistics are represented in the form of graphs. Load balancing can be done and power utilization can be done by analysing the all graph representation.
Performance, resource utilization, memory utilization of all hosts and VM’s are represented by using tool called Solarwinds virtualization manager is used. By using solarwinds tool detail analysis can be done on each aspects of VM’s and hosts and graphical representation can be obtained for better view and analysis. Detailed statistics will generated for every VM’s and host logs i.e. login time, resource utilized, performance, memory utilization etc...
The key target of the project is to gather the on-going performance measurements of the virtual machines. The information is likewise stored in an accessible database in order to support the continuous gathering of performance measurements. This contains both the recorded information and traditional information, which are combined and showed for analytical purposes. The insights are introduced as chart which helps in better analysis and understanding.
Collecting all logs from the Virtual Machines, Store all the logs collected by using MsSQL, Visualize all the data collected from the VMs, Collect the real time performance statistics of the virtual machines, Observing and analysing the performance of the VMs and VHosts. Individual graphs are generated for every virtual machine for better analysis. Using this graph analysis the VM administrator can done the balancing of load and resources.
3. Methodology
To gather continuous logs of VM and VHosts, a performance supervisor program is written in java using
VMware infrastructure API. This VMware API is connected to the vCenter and it collects the logs from the hosts and the virtual machines in the vCenter. The logs from each Virtual Machine and Host are written into discrete text files appended with the name of those machines. The program is considered to gather the statistics indefinitely, until it is interrupted manually. The statistical parameters that are gathered are CPU usage, Network Statistics, Memory Statistics, System Statistics etc., which identifies the workloads on the machines. All this statistics are collected to manage the CPU and Memory utilization and also reduce the Power consumption of all VMs and hosts.
Gathering of performance measurement of the hosts and VM’s, storing of the data should be in accessible MsSQL database. The data from the MsSQL database must be obtainable in the form of graphic representation by using some virtualization open source tool. The virtualization tool must be capable to present the data on a real time source by appraising itself at consistent time intervals.
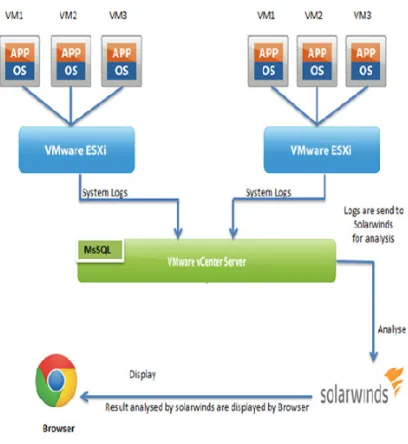
4. System Architecture
Entire system is broken down into smaller subsystems, providing inter related services. The architectural design deals with identifying the sub systems and creating a framework for controlling these sub systems and developing the essential structural framework, and it also identifies the system components and communication or interaction between these components. The outcome of architectural design process is the development of software architecture. The system architecture Virtual Machine Statistics Collection for Virtual Environment shown in figure 4.1 gives the components, sub components and the interaction between them used in the project.
This Project focuses on implementing the real time information collection and analysis framework. This is skilled of taking metrics from vHosts and the Virtual Machines and has the facility to visualize them in an effective method.
Fig. 4.1 Architecture of An Extensible Statistics
The main components are described below:-
1. vCenter 2. Solarwinds
3.
MsSQL4.1 vCenter Server
VMware vCenter Server offers consolidated management of vSphere virtual infrastructure. IT managers can confirm security and availability, streamline day-to-day responsibilities, and decrease the difficulty in managing virtual infrastructure.
Key functions of vCenter server- Deceivability describes that vCenter permits clients to arrange "ESX servers" and "VMs" and it screens execution all through the whole base. Virtual base items can be safely overseen. Adaptability is the deceivability found in vCenter server is versatile crosswise over many "ESX servers" and a huge number of "VMs". Clients can deal with different vCenter servers inside the same "vSphere customer". Final key function is visibility; vCenter server cautions can trigger activities. vCenter server gauges permits clients to mechanize many activities.
4.2 Solarwinds
Virtualization SolarWinds Manager deals a simple to-use, adaptable virtualization administration arrangement whose assets can likewise be coordinated with different SolarWinds items on the Orion stage. Virtualization SolarWinds Manager gives deceivability into virtual machines then their bolster framework. It goes about as a solitary sheet of glass through which virtual base chairmen can see the interior design and condition of the administrations that contain the virtualized workloads
running on virtual foundation, alongside the supporting processing environment to catch an all-encompassing representation of the advancement anddevelopment of VMs inside the framework. Moreover, constant and authentic data is totalled inside a propelled perception interface to introduce an organized representation of beforehand unstructured uncorrelated information.
Virtualization SolarWinds Manager gives deceivability into virtual machines then their bolster framework. It goes about as a solitary sheet of glass through which virtual base chairmen can see the interior design and condition of the administrations that contain the virtualized workloads running on virtual foundation, alongside the supporting processing environment to catch an all-encompassing representation of the advancement and development of VMs inside the framework.
The following graphic provides a basic outline of the Virtualization Manager architecture.
Fig.3: Basic outline of the Virtualization Manager architecture.
It provides combined VMware and Microsoft Hyper-V capability planning, performance observing, VM sprawl control, VDI performance checking, configuration supervision, alert remediation, and chargeback mechanisation—all in one reasonable product that’s stress-free to download, arrange, and use. Start monitoring every VMs in about an time period.
4.3 MsSQL Server
distribution centres to little, exceptionally specific departmental and application databases. The adaptability at the database layer makes an interpretation of specifically into application adaptability, giving end clients more helpful application highlights and at last enhancing efficiency.
Virtualizing Microsoft SQL Server with VMware vSphere permits the best of universes, all the while improving figure assets through server solidification and keeping up application adaptability through part detachment.
Microsoft SQL Server workloads can be relocated to new arrangements of equipment in their present states without costly and blunder inclined application remediation, and without changing working framework or application forms or fix levels. For superior databases, VMware and accomplices have shown the capacities of vSphere to run the most difficult Microsoft SQL Server workloads.
Virtualizing Microsoft SQL Server with VMware vSphere permits the best of universes, all the while advancing register assets through server solidification and keeping up application adaptability through part separation. Microsoft SQL Server workloads can be moved to new arrangements of equipment in their present conditions without costly and blunder inclined application remediation, and without altering working framework or application forms or fix levels. For elite databases, VMware and accomplices have shown the capacities of vSphere to run the most difficult Microsoft SQL Server workloads.
5. Conclusion
In today’s IT filed it is difficult to manage virtual machines and hosts. Enterprises have hundreds and thousands of virtual machines. Performance analysis of all hosts and virtual machines is very difficult. To analysis the performance, resource utilization, memory utilization of all hosts and VM’s tool called Solarwinds virtualization manager is used. By using solarwinds tool detail analysis can be done on each aspects of VM’s and hosts and graphical representation can be obtained for better view and analysis.
Detailed statistics will generated for every VM’s and host logs i.e. login time, resource utilized, performance, memory utilization etc.. The final conclusion of these theses is better analysis will done of every VM’s and hosts. The detail statistics, report and graph generated will be export to IT managers. This will help them to improve the efficiency and performance of host and VM’s by using these documents.
6. Future Works
The Disadvantage that we have faced in present system virtualization is overcome by the new technology called Dockers Container.
1. Many applications can be run on the host operating system by using docker engine.
2. Dockers will collect the logs for every 15 seconds by using Datadog agent, Datadog agent run Cgroup to gather all statistical parameters.
3. There is an inbuilt dashboard support for graphical representation of statistics.
References
[1] Durairaj. M, Kannan.P “A Study On Virtualization Techniques And Challenges In Cloud Computing” in international journal of scientific & technology research volume 3, issue 11, November 2014. [2] NedeljkoVasi, DejanNovakovi, Svetozar,
DejanKosti, and Ricardo Bianchini “Transparently Identifying and Managing Performance Interference in Virtualized Environments” in USENIXFederated Conferences Week June24-28, 2013
[3] Maria Andleeb Siddiqui, Hammad Kamal “A Proposed Approach for Deploying Network Attached Storage by Configuring Virtual Switch In ESXi” in International Journal of Scientific & Engineering Research, Volume 5, Issue 6, June-2014 [4] Eden Sequeira1 ; Karishma S. Kumar2 “A Survey on Secure Virtualization for Cloud Computing” in International Journal of Software & Hardware Research in Engineering ISSN-2347-4890 Volume 3 Issue 7 July, 2015
[5] Rajesh Bose, Debabrata Sarddar “A Mobile Cloud Computing Architecture with Easy Resource Sharing” in International Journal of Current Engineering and Technology 2014.
[6] Jeffrey S. Chase, Darrell C. Anderson, Prachi N. Thakar, Amin M. Vahdat Department of Computer Science Duke University “Managing Energy and Server Resources in Hosting Centers”
[7] Xiaorui Wang “ server farms face 2 critical difficulties” in 2013
[8] SayaleeNarkhede1 ,Tripti Baraskar2 “Sayalee Narkhede1 , Tripti Baraskar2 “International Journal of UbiComp (IJU), Vol.4, No.3, July 2013
[9] S. Alspaugh, Beidi Chen , Jessica Lin , ArchanaGanapathi Splunk Inc. Marti A. Hearst Randy Katz “Analyzing Log Analysis: An Empirical Study of User Log Mining”
[10] S. Alspaugh, ArchanaGanapathi, Marti A. Hearst, Randy Katz “Better Logging to Improve Interactive Data Analysis Tools” in University of California, Berkeley [email protected]