VOLUME 9 | ISSUE 1 | 2014 | 59
Effect of plyometric training on sand versus
grass on muscle soreness and selected
sport-specific performance variables in hockey players
SINGH AMRINDER1
, GAUR SAKSHI, SANDHU JASPAL SINGH
Department of Sports Medicine and Physiotherapy, Guru Nanak Dev University, Amritsar
ABSTRACT
Amrinder, S., Sakshi, G., & Singh, S.J. (2014). Effect of plyometric training on sand versus grass on muscle soreness and selected sport-specific performance variables in hockey players. J. Hum. Sport Exerc., 9(1), pp.59-67.The purpose of this study was to compare the effects of a 4-week plyometric training on two different surfaces, sand and grass on muscle soreness and selected sport-specific performance variables in national level hockey players. Subjects were randomly divided into two groups- grass training group (N=20) and sand training group (N=20). After the baseline measurements of strength, endurance, balance, and agility, plyometric training was given for 4-weeks,three sessions per week. Muscle soreness was assessed at the end of each training session on a 7-point likert scale.Post-readings of strength, endurance, balance and agility were taken after the 4-week training programme. Data when compared after plyometric training revealed no significant changes between two groups (p>0.05), however players in the sand group experienced less muscle soreness (p<0.05) than grass group. There was significant improvement (p<0.05) seen in the tested variables in both groups after the training but no significant interaction was found between the two surfaces after the training. These findings suggest that short-term plyometric training on sand/non-rigid surface induces similar improvements in strength, endurance, balance and agility as on firm surface but induces significantly less muscle soreness. Hence, plyometric training on sand is viable option for coaches to enhance performance in athletes,while reducing risk of muscle soreness and damage. Key
words: PLYOMETRICS, MUSCLE SORENESS, STRENGTH, ENDURANCE, BALANCE, AGILITY.
1Corresponding author. Grand Trunk Rd, Off NH 1, Amritsar, Punjab, 143005, India.
E-mail: [email protected] Submitted for publication March 2013 Accepted for publication December 2013
JOURNAL OF HUMAN SPORT & EXERCISE ISSN 1988-5202 © Faculty of Education. University of Alicante
60 | 2014 | ISSUE 1 | VOLUME 9 © 2013 University of Alicante
INTRODUCTION
The game of field hockey is a high intensity, non-continuous game in which the physiological demands are considerable, placing it in the category of ‘heavy exercise’ (Ghosh et al., 1991; Reillt & Borrie, 1992). The unique requirements of field hockey including dribbling the ball and moving quickly in a semi-crouched posture superimpose the workload demanded by the game(Reilly & Seaton, 1990). Competitive field hockey matches place heavy aerobic demands on players and require them to expend energy at relatively high levels (Reilly & Borrie, 1992) (Boyle et al., 1994). While intermittent in nature, players are required to perform continuously for 70 minutes with just one 5-10 minute interval (Boyle et al., 1994). Although the majority of the game is spent in low-level activity such as walking and light jogging, repeated back-to-back sprints make speed and tolerance to lactic acid an important characteristic in players (Spencer et al., 2004).
Plyometric are training techniques used by athletes in all types of sports to increase strength and explosiveness (Chu, 1998) and have been used successfully over the years to elicit training responses from athletes. The training typically consists of stretch-shortening cycle exercises characterised by multi-joint actions, rapid eccentric phases and explosive concentric muscular contractions potentiated by stretch reflex (Bobbert, 1990). This type of training has shown to improve performance in explosive sports that rely on moving speed and power such as hockey, basketball, track and field, football, and volleyball (Miller et al., 2002).
Plyometric training is commonly performed on firm surfaces (eg. grass and wood), but a more recent study has shown that drop jumps on sand induce less muscle damage when compared to a firm surface (Miyama & Nosaka, 2004). However, jumping on sand causes lower reuse of elastic energy and energy loss due to feet slipping during the concentric action (Miyama & Nosaka, 2004; Giatsis et al., 2004). This might induce different training effects compared to training on a firm surface. The lower impact on the musculoskeletal system induced by plyometric training on sand might be useful during rehabilitation programmes.
In an attempt to evaluate the effects of surface type on plyometric training, studies have compared the effects of aquatic and land plyometric training on strength, agility and muscle soreness (Robinson et al., 2004; Martel et al., 2005; Stemm & Jacobson, 2007; Shiran et al., 2008). Robinson et al. (2004) and Stemm et al. (2007) found no differences in the outcome variables assessed between land and aquatic plyometrics. Other studies indicated less soreness in the aquatic conditions (Impellizzeri et al., 2008; Robinson et al., 2004).
Hence the present study was conducted to address the selected performance variables through plyometric training on two different training surfaces, sand and grass with the view to help hockey player achieve good performance during the game and to rehabilitate injured players for return to sport participation.
MATERIAL AND METHODS
A parallel two-group, randomised, longitudinal (pre-test-post-test) design was used. After baseline measurements, subjects were randomly allocated to two intervention groups: plyometric training on sand (sand group) and plyometric training on grass (grass group).
Participants:
VOLUME 9 | ISSUE 1 | 2014 | 61 measurements, players were randomly allocated into two equal groups (20 players in each group)- one of them performed plyometric training on sand and the other group performed plyometric training on grass surface. As the training surface was the independent variable, no control group was used. A verbal explanation of the study was given to each subject; the subject then provided written informed consent in accordance with the Institutional Ethics Committee, Faculty of Sports Medicine and Physiotherapy, Guru Nanak Dev University, Amritsar.
Data Acquisition:
Pre-readings were taken 1 week before the beginning of plyometric training period. Each subject underwent measurements of their peak torque, fatigue index, balance and agility. After the baseline measurements, 4-week high-intensity plyometric training was conducted. The post readings were carried out 4 4-weeks after the end of the training period to highlight the training induced changes. The pre and post readings of the following parameters were recorded.
Isokinetic Strength and endurance:
Measurement of isokinetic variables i.e. Peak Torque and Fatigue Index for knee flexion and extension at two different speeds 60 deg/sec and 180 deg/sec were noted using Kinitech Multijoint Isokinetic Dynamometer. The player repeated concentric flexion and extension for 5 repetitions counted as one set at 60 deg/sec followed by 180 deg/sec. Three repetitions were done and player’s readings were noted calculating the mean value of three sets in every speed.
Static Balance:
Static balance was checked in Kinematic Measurement System laboratory with Fitness Technology (FT) wobble board. A 20 second wobble board balance test was performed, and the balance ratio was measured. Three attempts were given and the average on off ratio time was noted from the mean of the three attempts.
Agility Testing:
The Illinois Agility test (Getchell, 1979) was used to test the ability to turn in different directions and at different angles. This test was performed on a non-slip surface. The aim of the test was to complete a weaving running course in the shortest possible time. Cones marked the course, ten meters long and five meters wide. The subject started face down, with the head to the start line, and hands by the shoulders. At the whistle, the subject ran the course, without knocking down any cones. Time was recorded using a stop-watch. Three trials were conducted and the best reading was recorded.
Plyometric Training Programme:
62 | 2014 | ISSUE 1 | VOLUME 9 © 2013 University of Alicante Table 1 shows the 4-week plyometric training protocol. The training was followed by cool down session, which included static stretching and light jogging for 5-10 minutes.
Table 1. Plyometric 4-week training protocol
Number of sets (number of repetitions)
Exercise Week 1 Week 2 Week 3 Week 4
Vertical jumping 15 (10) 20 (10) 25 (10) 25 (10)
Bounding 3 (10) 4 (10) 5 (10) 5 (10)
Broad jumping 5 (8) 5 (10) 7 (10) 8 (10)
Drop jumping 3 (5) 5 (9) 6 (15) 6 (15)
Muscle soreness:
Muscle soreness was assessed at the end of each training session on an Italian version of 7-point Likert scale of muscle soreness (Vicker et al., 2001). It consisted of 7 points ranging from 0-6, where 0 means complete absence of soreness and 6 indicates severe pain, restricting the ability to move.
Likert scale of muscle soreness from Vickers 0 A complete absence of soreness
1 A light pain felt only when touched/a vague ache
2 A moderate pain felt only when touched/a slight persistent pain 3 A light pain when walking up or down stairs
4 A light pain when walking on a flat surface/painful
5 A moderate pain, stiffness, or weakness when walking/very painful 6 A severe pain that limits my ability to move
Statistical analysis:
The data was statistically analyzed using the Statistical Package for Social Sciences (SPSS)/19.0. A P value <0.05 was considered statistically significant. Paired t-tests were used to identify any significant intra group differences for the dependent variables. A one-way analysis of variance (ANOVA) was used to determine the significance of differences between groups. When a significant difference among the training groups was detected, a pair-wise comparison of the programs was done using a Tukey’s post hoc. The alpha level was set at 0.05 in order for the difference to be considered significant. Data were graphed and analyzed to evaluate the effects of the intervention.
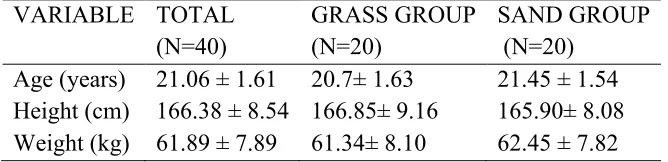
Table 2. Shows demographic data of sand and grass group (mean ± standard deviation)
VARIABLE TOTAL (N=40)
GRASS GROUP (N=20)
SAND GROUP (N=20)
Age (years) 21.06 ± 1.61 20.7± 1.63 21.45 ± 1.54
Height (cm) 166.38 ± 8.54 166.85± 9.16 165.90± 8.08
VOLUME 9 | ISSUE 1 | 2014 | 63
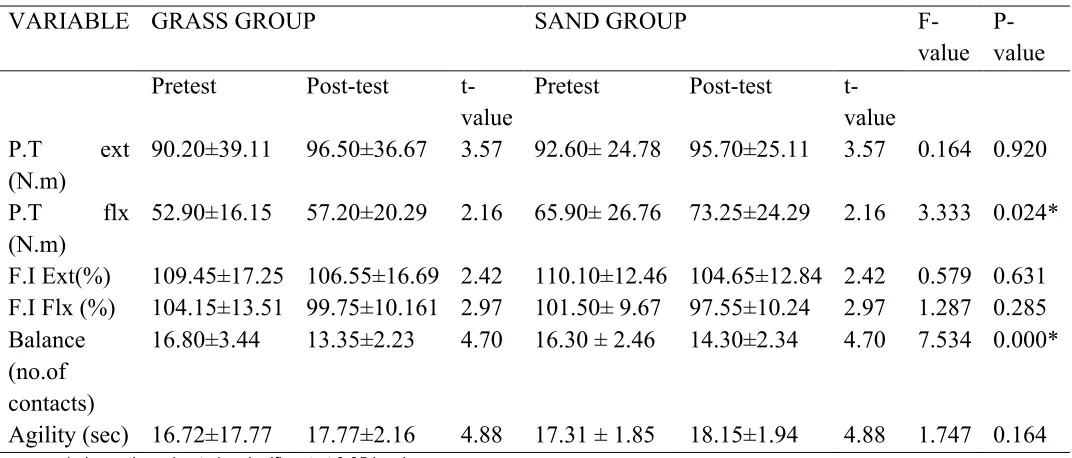
Table 3. Shows the descriptive data of both grass and sand groups before and after 4-week plyometric
intervention
* shows the value to be significant at 0.05 level
P.T ext = peak torque extension; P.T flx = peak torque flexion; F.I ext = fatigue index extension; F.I flx = fatigue index flexion
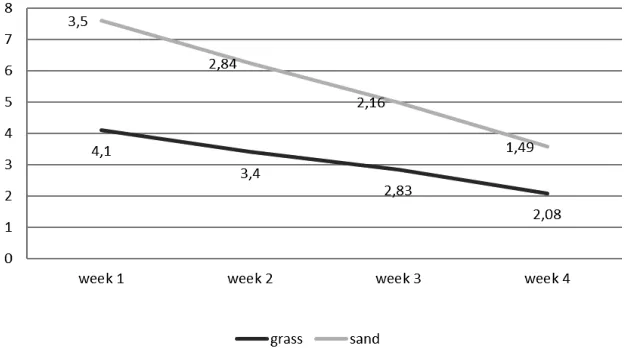
Table 4. Mean weekly comparison of muscle soreness during the training period for grass and sand groups
MUSCLE SORENESS GRASS GROUP (N=20)
SAND GROUP (N=20)
Week 1 4.1 ± 0.619 3.5 ± 0.397
Week 2 3.4 ± 0.475 2.8 ± 0.563
Week 3 2.8 ± 0.519 2.2 ± 0.474
Week 4 2.1 ± 0.591 1.5 ± 0.425
VARIABLE GRASS GROUP SAND GROUP F-
value P- value
Pretest Post-test
t-value
Pretest Post-test
t-value
P.T ext
(N.m)
90.20±39.11 96.50±36.67 3.57 92.60± 24.78 95.70±25.11 3.57 0.164 0.920
P.T flx
(N.m)
52.90±16.15 57.20±20.29 2.16 65.90± 26.76 73.25±24.29 2.16 3.333 0.024*
F.I Ext(%) 109.45±17.25 106.55±16.69 2.42 110.10±12.46 104.65±12.84 2.42 0.579 0.631
F.I Flx (%) 104.15±13.51 99.75±10.161 2.97 101.50± 9.67 97.55±10.24 2.97 1.287 0.285
Balance (no.of contacts)
16.80±3.44 13.35±2.23 4.70 16.30 ± 2.46 14.30±2.34 4.70 7.534 0.000*
64 | 2014 | ISSUE 1 | VOLUME 9 © 2013 University of Alicante
Figure 1. 4-week comparison of muscle soreness between grass and sand group
RESULTS
When the two groups were analysed, no significant interactions were found between the two groups with regard to the tested performance variables. Even though results indicate no significant intergroup differences (p>0.05), on comparing mean differences between both groups, sand group demonstrated more increments in strength (3.33%) and endurance (0.79%) while, grass group showed more improvement in balance (20.54%) and agility (6.28%). With regard to within-group changes, both grass and sand groups improved significantly (p<0.05), where significant changes were recorded before and after plyometric intervention.
Muscle soreness, which was measured throughout the training period of 4-weeks showed progressive decrease in both groups but sand group showed significant (p<0.05) reduction in muscle soreness.
DISCUSSION
This study is an attempt to investigate the effect of plyometric training on two different training surfaces- sand and grass on muscle soreness and selected sport-specific performance variables in national level hockey players.
The current study employed a 4-week plyometric program with 3 sessions per week. The main findings in the study indicate that a short-term plyometric training on sand (non-rigid) surface resulted in similar changes in strength, endurance, balance and agility as in grass group but induced less muscle soreness and damage than the grass group.
VOLUME 9 | ISSUE 1 | 2014 | 65 The present study showed that during 4-week training period, the sand group experienced less muscle soreness, as measured by the likert scale, and therefore support the hypothesis that a short-term plyometric training on sand induced less muscle soreness and damage.
The mean value of muscle soreness for sand group (2.5) was lower than grass group (3.1). This result is in lieu with the findings of (Miyama & Nosaka, 2004) who showed that plyometric training on sand induced less muscle soreness than jumping on a firm surface, and also chains the findings of (Impellizzeri et al., 2008) who demonstrated a similar comparative study in soccer players, comparing the jumping and sprinting ability. There was progressive reduction in muscle soreness in both groups during the training period, despite the fact that the exercise intensity was increased each week. This reduction can be attributed to the repeated bout effect, as demonstrated by reduced symptoms following consequent bouts of training.
Plyometrics have been verified by research to improve strength (Robinson et al., 2004; Martel et al., 2005; Miller et al., 2002), balance (Esfangreh, 2011; Asadi & Arazi, 2012) and agility (Inpellizzeri et al., 2008;m Asadi & Arazi, 2012; Micheal et al., 2006). In the current study, plyometric training on both surfaces yielded similar enhancement in the tested variables, irrespective of the training surface. Within group comparison, using paired t-test revealed significant improvements in both groups in all the tested parameters. Whereas, there were no statistically significant differences between the two groups. Both groups improved their strength, which was measured by isokinetic strength testing, comparing peak torque with knee in flexion and extension, a trend for greater improvement was seen in sand group, where the ratio peak torque (flexion/extension) was more (3.33%). Fatigue index, which is a measure of endurance, decreased in both groups after plyometric training, indicating a better endurance. However, plyometric training did not revealed any significant differences in endurance in both sand and grass groups. The result is also consistent with the study conducted by Ademola O. Abass which focused on the relationship among strength, endurance and power performance characteristics of untrained university undergraduates following three different modes of plyometric and showed that there were no significant relationships among the groups in strength and endurance performance characteristics. Results of our study indicate a lowered fatigue index (flexion/extension) in sand group (0.79%).
To our knowledge, limited studies have addressed the effects of sand-plyometrics on strength performance. Robinson et al. (2004) examined the effects of 8-week of aquatic and land plyometric training on peak torque production by isokinetic strength testing and found that both groups improved peak torque production. This finding is in accordance with our study. (Martel et al., 2005) compared the combination of aquatic plyometrics and volleyball training with traditional volleyball training and concluded that aquatic plyometric group significantly improved torque production during maximum knee extension exercises. In a similar study, Shiran et al. (2008)reported that 5-week of aquatic plyometric and land plyometric improved leg muscle strength in male wrestlers.
66 | 2014 | ISSUE 1 | VOLUME 9 © 2013 University of Alicante Agility, tested by Illinois agility testing, had shown to improve in grass group (6.28%). The results improved for the agility test because of better motor recruitment or neural adaptation. This result was consistent with the result of a study of 6-weeks of plyometric training on agility by (Miller et al., 2002) and (Asadi & Arazi, 2012),on effects of high-intensity plyometric training on male basketball players.
CONCLUSIONS
The results of this study suggest that sand plyometric training results in similar gains in sports specific parameters and therefore, can offer an effective training modality for performance enhancement in power-based sports, such as hockey. As it induces less muscle soreness and damage and can incorporated in a hockey training program when a reduction of stress on the musculoskeletal system is desired.
ACKNOWLEDGMENTS
The authors are thankful to Ethics Committee of Guru Nanak Dev University, for granting permission to conduct the study.
Conflict of interests: No conflict of interests amongst authors.
REFERENCES
1. Asadi, A., & Arazi, H. (2012) Effects of high-intensity plyometric training on dynamic balance, agility, vertical jump and sprint performance in young male basketball players. Journal of Sport and Health Research, 4(1), pp.35-44.
2. Bobbert, M.F. (1990). Drop jumping as a training method for jumping ability. Sports Med, 9(7), pp.22. 3. Boyle, P.M., Mahoney, C.A., & Wallace, W.F. (1994). The competitive demands of elite male field
hockey. Journal of Sports Medicine Physical Fitness, 34(3), pp.235-41.
4. Chu, D.A. (1998). Jumping into Plyometrics (2nd ed.). Champaign, IL:Human Kinetics.
5. Esfangreh, A.S. (2011). Effect of six week plyometric exercise on dynamic postural control of male athletic students. Annals of Biological Research, 2(6), pp. 88-90.
6. Ghosh, A.K., Goswam, I.A., & Ahuja, A. (1991). Physical and Physiological profile of Indian National Women Hockey Players. NIS Scientific J., 14(4), pp.1-9.
7. Giatsis, G., Kollias, I., Panoutsakopoulos, V., & Papaiakovou, G. (2004). Biomechanical differences in elite beach-volleyball players in vertical squat jump on rigid and sand surface. Sports Biomech, 3(1),
pp.145-58.
8. Impellizzeri, F.M., Rampinini, E., Castanga, C., Martino, F., Fiorini, S., & Wisloff, U. (2008). Effect of Plyometric training on sand versus grass on muscle soreness and jumping and sprinting ability in soccer players. Br J Sports Med., 42, pp.42-46.
9. Luebbers, P.E., Potteiger, J.A., Hulver, M.W., Thyfault J.P., Carper, M.J., & Lockwood, R.H. (2003). Effects of plyometric training and recovery on vertical jump performance and anaerobic power. J Strength Cond Res., 17(4), pp.704-9.
VOLUME 9 | ISSUE 1 | 2014 | 67 11. Martel, G.F., Harmer, M.L., Logan, J.M., & Parker, C.B. (2005). Aquatic plyometric training increases
vertical jump in female volleyball players. Med Sci Sports Exerc., 37(10), pp.1814-19.
12. Michael, G.M., Jeremy, J.H., Mark, D.R., Christopher, C.C., & Timothy J.M. (2006). The effects of a 6-week plyometric training program on agility. Journal of Sports Science and Medicine, 5, pp.459-465. 13. Mikesky, A., Mikesky, K., & Getchell B. (1979). Physical Fitness: A Way of Life. New York: John Wiley
and Sons.
14. Miller, M.G., Berry, D.C., Bullard, S., & Gilders, R. (2002). Comparisons of land based and aquatic based plyometric programs during an 8-week training period. Journal of Sports Rehabilitation, 11(4),
pp.269-283.
15. Miyama, M. & Nosaka, K. (2004). Influence of surface on muscle damage and soreness induced by consecutive drop jumps. J Strength Cond Res, 18(2), pp.206-11.
16. Myer, G.D., Ford, K.R., Palumbo, J.P., & Hewett, T.E. (2005). Neuromuscular training improves performance and lower extremity biomechanics in female athletes. Journal of Strength and Conditioning Research,19(1), pp.51-60
17. Reilly, T., & Borrie, A. (1992). Physiology applied to field hockey. Sports Medicine, 14(1), pp.10-26. 18. Reilly, T., & Seaton, A. (1990). Physiological strain unique to field hockey. Journal of Sports Medicine
andPhysical Fitness, 30(2), pp.142-146.
19. Robinson, L.E., Devor, S.T., Merrick, M.A., & Buckworth, J. (2004). The effects of land vs. aquatic plyometrics on power, torque, velocity, and muscle soreness in women. J Strength CondRes., 18(1),
pp.84-91.
20. Shiran, M.Y., Kordi, M.R., Ziaee, V., Ravasi, A.A., & Mansournia, M.A. (2008). The effect of aquatic and land plyometric training on physical performance and muscular enzymes in male wrestlers.
Research Journal of Biological Sciences, 3(5), pp.457-461.
21. Spencer, M., Lawrence, S., Rechichi, C., Bishop, D., Dawson, B., & Goodman, C. (2004). Time-motion analysis of elite field hockey, with special reference to repeated-sprint activity. Journal of Sports Science, 22(9), pp.843-50.
22. Stemm, J.D., & Jacobson, B.H. (2007). Comparison of land- and aquatic-based plyometric training on vertical jump performance. J Strength Cond Res., 21(2), pp.568-571.
23. Twist, P.W., & Benicky, D. (2000). Conditioning lateral movements for multi-sport athletes: Practical strength and quickness drills. Strength and Conditioning, 18(5), pp.10-19.
24. Vickers, A.J. (2001). Time course of muscle soreness following different types of exercise. BMC Musculoskelet Disord, 2, pp.5.