IJIRT 148927
INTERNATIONAL JOURNAL OF INNOVATIVE RESEARCH IN TECHNOLOGY61
Numerical Analysis on Thermodynamic Performance of
Simple Turbojet Engine
Moaz Hussain
Student, Department of Aeronautical Engineering, Excel Engineering College
Abstract-The growth in competitiveness and complexity in an engine manufacturing industry has called for computer based advanced tool to estimate the operating parameters of an engine. A physics based tool was used to estimate the variations of thermodynamic parameters over different conditions. These parameters were analyzed using an engine performance program written in FORTRAN programming language. A computer program designated to simulate the simple turbojet engine thermodynamically for performance analysis has been programmed and tested. The result from the program shows that by changing the operating
environment, compression rate and component
efficiencies, the pressure and temperature at various nodes changes which made the propulsive efficiency to get changed. This program also provides values of specific fuel consumption for a particular operating condition as it depends on pressure ratio, intake velocity, mass flow rate of air and fuel. This report includes a discussion on operation of the FORTRAN program at several cases, with input and output to show the performance of the turbojet engine.
Index terms- Turbojet Engine, FORTRAN, Propulsive Efficiency. Specific Thrust
I.INTRODUCTION
The development of the performance analysis code starts with the understanding of the basic concepts of jet engine theory. Empirical relations were used to calculate various parameters such as temperature and pressure at different stages, losses, velocities at inlet and outlet, thrust and specific fuel consumption. The procedure followed is an iterative process of turbojet engine performance, the values obtained for each iteration was analyzed and the graphical representation is carried out. In the performance code, the values of isentropic ram and jet efficiency, mechanical efficiency, turbine and compressor efficiencies are kept constant for each iteration and
iterated over a set of values which was decided from the historical data i.e. range of compressor pressure ratio, turbine inlet temperature, operating speed also the component values.
Other input values include: the mass flow rate, stagnation and static properties of fluid at inlet and outlet, gas constant, specific heat, turbine inlet temperature are also provided. Together with the above input parameters the code is designed to account for providing temperature and pressure at different stages, thrust and specific fuel consumption are provided as output. The output also includes the propulsive efficiency of engine, nozzle area and fluid density at exit.
Performance analysis studies deals with the thermodynamic changes of the working fluid (air and products of combustion in most cases) as it flows through the engine. It is divided into two types of analysis namely: parametric cycle analysis (also known as design-point or on-design) and engine performance analysis (also known as off-design). Parametric cycle analysis determines the performance of engines at different flight conditions and values of design choice (e.g., compressor pressure ratio) and design limit (e.g., combustor exit temperature) parameters. Engine performance analysis determines the performance of an engine at all flight conditions.
II. METHODOLOGY
IJIRT 148927
INTERNATIONAL JOURNAL OF INNOVATIVE RESEARCH IN TECHNOLOGY62
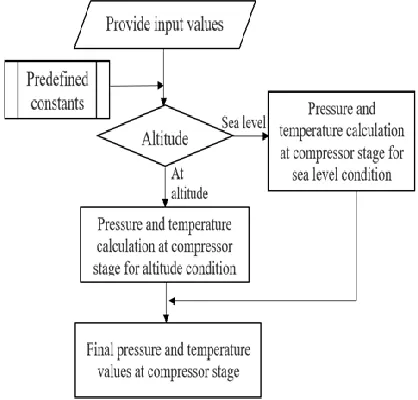
Fig. 1 to 3 describes the steps involved in the development of jet engines performance codes based on real fluid properties in the form of a flow chart. These codes were implemented by the use of FORTRAN 95 programming language.
Fig. 1. Steps involved in compressor stage calculation
Fig. 1 describes the initial stage of the program. Here the input values are taken as stated in Table 1 and compressor calculation are carried out on the basis of operating condition of the aircraft i.e. sea level or at some altitude. This pressure and temperature calculated at this stage is used for further calculation of combustion and turbine stage.
Table 1 Inputs required
Fig. 2 describes the calculation of parameters at combustion and turbine stage. The logical operation is carried out which calculate on the basis of either polytropic or isentropic efficiency. The result of this section is used for calculation of other parameters in the next section.
Fig. 2. Steps involved in combustion and turbine stage calculation
Fig. 3 describes the calculation of nozzle parameters. From the obtained values of turbine performance, nozzle pressure ratio and critical pressure ratio are obtained. It is used to establish the logical operation for nozzle chocking condition which further calculate thrust outlet pressure, velocity, density and exit area are calculated. At last the thrust, specific fuel consumption and propulsive efficiency are obtained. Finally the program provides all outputs in a series as stated in Table 2.
Table 2 Outputs provided
III. RESULT
The written program (appendix) was used for analysis by varying few parameter in each case and the result is presented in Fig. 4 to 8. Few parameters like combustion pressure loss (ΔPb= 0.3 bar), intake efficiency (ηi=0.95), compressor efficiency (ηc=0.89), combustion efficiency (ηb=0.89), turbine efficiency
Notation Specification Unit
Pa Ambient pressure Bar
Ta Ambient temperature Kelvin T03 Turbine inlet temperature Kelvin ΔPb Combustion pressure loss Bar
Ca Intake velocity m/s
r Pressure ratio -
Z Altitude m
ṁ, ṁf Mass flow of air and fuel Kg/s
Notation Specification Unit
P01,(02,03,
04,5)
Pressure at intake, compressor, combustion, turbine and exit Bar T01,(02,03,
04,5)
Pressure at intake, compressor,
combustion, turbine and exit Kelvin
A5 Area at exit m2
C5 exit velocity at exit m/s
ρ5 density at exit Kg/m3
Th, Thsp Thrust and specific thrust N
F Actual fuel air ratio -
IJIRT 148927
INTERNATIONAL JOURNAL OF INNOVATIVE RESEARCH IN TECHNOLOGY63
(ηt=0.89), nozzle efficiency (ηj=0.98) and mechanical efficiency (ηm=0.99) are kept constant for each iterative cases.
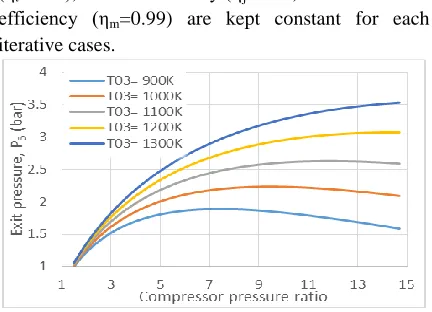
Fig. 4. Exit pressure as a function of Compressor pressure ratio at various Turbine inlet temperature In Fig. 4, variation exit pressure, „P5‟ (bar) was plotted against variation of compressor pressure ratio at different turbine inlet temperature, „T03‟ (K). Other parameters like ambient pressure (Pa=1 bar), ambient temperature (Ta=288 K), intake velocity (Ca=288 m/s) and mass flow of air (ṁa=20 Kg/s) are kept constant in each case. This graph represents that at lower compressor pressure ratio the exit pressure dose not vary but as the compressor pressure ratio is increased exit pressure starts diverging.
In Fig. 5, variation of thrust (N) was plotted against various compressor pressure ratios at different mass flow rate of air. Other parameters like ambient pressure (Pa=1 bar), ambient temperature (Ta=288 K), intake velocity (Ca=288 m/s) and turbine inlet temperature (T03=1200 K) are kept constant in each case. This graph represents that the thrust produced by engine increases as the mass flow rate of air is increased at the same compressor ratio. This difference in thrust value increases with increase in compressor pressure ratio.
In Fig. 6, the variation of thrust (N) is plotted against
Fig. 5. Thrust as a function of Compressor pressure ratio at various Mass flow rate of air
by engine increases as the mass flow rate of air is increased at the same compressor ratio. This
Fig. 6. Propulsive efficiency as a function of Intake air velocity at various compressor pressure ratio
difference in thrust value increases with increase in compressor pressure ratio.
In Fig. 6, the variation of thrust (N) is plotted against various values of turbine inlet temperature (K) at different mass flow rate of air. Other parameters like ambient pressure (Pa=1 bar), ambient temperature (Ta=288 K), intake velocity (Ca=288 m/s) and compressor pressure ratio= 8 are kept constant in each case. This graph represents that the thrust produced by engine increases as the mass flow rate of air is increased at the same turbine inlet temperature. This difference in thrust value increases with increase in compressor pressure ratio but an irregular variation of thrust is encountered at the mass flow rate of 15 Kg/s.
IJIRT 148927
INTERNATIONAL JOURNAL OF INNOVATIVE RESEARCH IN TECHNOLOGY64
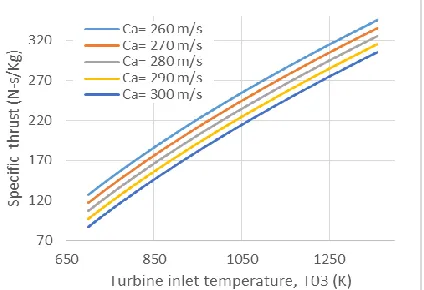
temperature (Ta=288 K), and mass flow of air (ṁa=20 Kg/s) and compressor pressure ratio= 8 are kept constant in each case. This graph represents that the thrust produced by engine increases as the mass flow rate of air is increased at the same turbine inlet temperature. The graph shows that specific thrust at various turbine inlet temperature increases at a constant rate where the difference in specific thrust value remains equal at different intake velocities.
Fig. 8. Specific thrust as a function of Turbine inlet temperature at various Intake air Velocity In Fig. 8, the variation propulsive efficiency (ηp) is plotted against various values intake velocities (Ca m/s) of at different compressor pressure ratio. Other parameters like ambient pressure (Pa=1 bar), ambient temperature (Ta=288 K), and mass flow of air (ṁa=20 Kg/s) and turbine inlet temperature (T03=900 K) are kept constant in each case. This graph represents that the thrust produced by engine increases as the mass flow rate of air is increased at the same turbine inlet temperature. The graph provides that at lower intake velocity the propulsive efficiency is almost equal but as the intake velocity is increased propulsive efficiency starts diverging at a slow rate.
IV. CONCLUSION
The focus of this work is simplifying the performance analysis of a turbojet engine using computer based tool, which was completed within a thorough research; its analysis data results were expressed graphically. The engine's performances calculated from the FORTRAN 95 codes match the engine data from catalogues.
Based on the performed work, the results can be concluded as following:
The exit pressure increases gradually with increase of compressor pressure ratio in initial stage but the increment rate decreases and goes negative as the compressor pressure ratio is made high.
The exit pressure increases with increase of turbine inlet temperature but at lower values of compressor pressure ratio is independent of turbine inlet temperature.
The thrust produced by the engine is directly proportional to compressor pressure ratio and turbine inlet temperature which increases with an increase of mass flow rate of air.
The net thrust produced for a compression ratio of 1.5 to 14.5 and mass flow rate of air ranges from 10 to 20 Kg/s is in the range of 2.7 to 12.1 kN which satisfies Thermodynamic Performance Analysis of Turbojet Engine and the expected design requirement of the engine.
Specific thrust of engine increases with an increase in intake velocity and turbine inlet temperature.
The propulsive efficiency increases with increase in Mach number (intake velocity of engine), also with an increase of compression ratio.
REFERENCES
[1] Jack D. Mattingly, Elements of Gas Turbine Propulsion. McGraw Hill Education India Private Limited, New Delhi, 2005, pp. 392-398.
[2] Janet A Nicholson, Introduction to
Programming Using FORTRAN 95,
https://www.fortrantutorial.com/ 2010.
[3] Metcalf, M., Reid, J. & Cohen, M. Fortran 95/2003 Explained. Oxford University Press, Oxford 2004.
[4] Press, W.H. & Teukolsky, S.A. Numerical Recipes in FORTRAN: The Art of Scientific Computing, 2nd edition 1994, Cambridge University Press, Cambridge.
[5] Y. Jaluria, Design and Optimization of Thermal Systems, 2nd ed. CRC Press, New York, 2008. [6] J.M. Moran, and G. Tsatsaronis, The CRC
IJIRT 148927
INTERNATIONAL JOURNAL OF INNOVATIVE RESEARCH IN TECHNOLOGY65
[7] Chappell, M.S. Cockshutt, E.P. & Sharp, C.R, “Gas Turbine Cycle Calculations: Design Point Performance of Turbojet and Turbofan Engines”. National Research Council of Canada, Aeronautical Report, 1964 LR-407, Canada.
[8] Mofid Gorji, Admin Kazemi, Davood Domiri Ganji, “Thermodynamic Study of Turbofan Engine in Off-Design Conditions”, Journal of Basic and Applied Scientific Research, 2(11)11239-11253, 2012.