40
Using Pharmacophore and Docking Models to Gain
Insight into Structural Binding and Virtual
Screening: An Application Study with c-Src Kinase
Kranthi Raj K, Rekha R, Lokesh.P, Muttineni Ravikumar, D.Ramachandran
Abstract—c-Src kinase is a non receptor tyrosine kinase that
acts as a signal transduction inhibitor, useful to treat various diseases, including cancer, osteoporosis, and metastatic bone disease. To discover novel high affinity ligands, Pharmacophore models were generated based upon a series of 29 structurally diverse chemicals exhibiting IC50 values from
2.7nM to 50 000nM for this protein. The model was validated by using 263 compounds as test set, which has a correlation coefficient of 0.750 between estimated activity and experimentally measured activity. For analyzing intermolecular interactions between protein and ligand, all the molecules were docked. Docking analysis suggests the role of hydrogen bonding in enzyme selectivity. In virtual screening experiments, we retrieved 60 compounds, which are having best mapping with the pharmacophore model, from an in-house database containing 500000 compounds. When these compounds were docked, 28 compounds are having good interaction with c-Src kinase, especially with the hinge region amino acids.
Index Terms—Pharmacophore, Docking, c-Src, Virtual
Screening
I. INTRODUCTION
Protein tyrosine kinases play an important role in cell growth and differentiation. These enzymes catalyze the transfer of a phosphate group from ATP to a tyrosine residue on an appropriate substrate thereby bringing about cell signaling events.1 c-Src kinase is a non receptor tyrosine kinase that acts as a signal transduction inhibitor that is a critical component of multiple signaling pathways that control cell growth, proliferation, invasion and apoptosis. While c-Src kinase is highly regulated and active only at low levels in normal cells, studies have shown that c-Src kinase is upregulated in many human tumor types.2 In the past 20 years since Src was characterized as a kinase, there has been a plethora of studies on Src’s significant involvement in diverse biological pathways. These reports continue to generate considerable efforts to identify low molecular weight inhibitors of Src activity that could be
abioCampus, GVK Biosciences, S-1, Phase-1, Technocrats Industrial
Estate, Balanagar, Hyderabad 500 037, Andhra Pradesh, India
bBioinformatics Division, Environmental Microbiology Lab, Department
of Botany, Osmania University, Hyderabad 500007, Andhra Pradesh, India
c Ravambio, Begumpet, Hyderabad 500016, Andhra Pradesh, India. dNational Institute of Pharmacutical Education and Research, Hyderabad ,
500 607, Andhra Pradesh, India.
eAcharya Nagarjuna University, P.G center, Nuzvid, 521201, Andhra
Pradesh, India.
*Corresponding author e-mail:[email protected], Mobile:
9676955664
used to treat various diseases, including cancer, osteoporosis, and metastatic bone disease.3-4 The emerging data suggest that c-Src kinase inhibition may enhance the anti-tumor efficacy of hormonal and cytotoxic agents in preclinical models.5 c-Src kinase activity is also implicated in metastatic bone disease, a characteristic of late stage progression of many solid tumors types (for example Breast, Prostate) and of Leukemia’s.6-7 Till now no inhibitor has reached the market either for osteoporosis or for cancer by targeting tumor growth ,cell adhesion or motility.8 However several classes of molecules have been studied preclinically for their ability to inhibit c-Src and abl-kinases
8-10
of which the three most important advanced compounds that are undergoing clinical evaluation are the Anilinoquinazoline AZDO530[N -(5-chloro-1,3- benzodioxol-4-yl)-7-[2-(4-ethylpiperazin-1-yl)ethoxy]-5-(tetrahydro-2H-pyran-4-yloxy)quinazolin-4-amine,10-11 the thiazolecarboxamide BMS-354825, and the quinolinecarbonitrile, SKI-606,8 Bosutinib, a Src inhibitor currently in oncology clinical trails.12-14 BMS-354825, Dasatinib, a Src inhibitor with an aminothiazole core, was recently approved by the FDA for the treatment of Gleevec-resistant CML.15
II. METHODS AND MATERIALS
In the present study, we have generated pharmacophore model using Catalyst software, for diverse set of molecules of c-Src inhibitors with an aim to obtain rational hypothetical picture of the primary chemical features responsible for activity and this pharmacophore model was used to retrieve novel and potential inhibitors against c-Src kinase, from various databases. These hits were further conformed by the docking studies.
Pharmacophore Generation: For the pharmacophore
modeling studies, a set of 292 c-Src inhibitory activity data (IC50) spanning over 4 orders of magnitude (from 2.7 to
50,000nM) were selected from the literature.16-25 The
1
41 (Scheme 1). To validate our pharmacophore model, a large set of 263 structural and activity diverse compounds were used as the test set (see supporting information). All the molecules were built using builder module of Cerius226 and minimized using the steepest descent algorithm with a convergence gradient value of 0.001 kcal/mol. Further geometry optimization was carried out for each compound with the MOPAC 6 package using the semi empirical AM1 Hamiltonian. To generate 3D pharmacophore, each compound should have conformations to cover three dimensional space. For this, conformational models of all molecules were generated using the ‘best quality’ conformational search option within the Catalyst’s ConFirm module. It generates the conformations using the ‘Poling’ algorithm.27 A maximum of 250 conformations were generated for each compound to ensure maximum coverage in the conformational space within an default energy threshold of 20.0 kcal/mol above the global energy minimum.
Ten best Pharmacophore (called hypotheses in the program) models were generated using HypoGen module. An initial analysis revealed that four chemical feature types such as Hydrogen-bond Acceptor (A), Hydrophobic (Z), Positive Ionizable (X) and Ring Aromatic (R) features could effectively map all critical chemical features of all molecules in the training and test sets. These features were selected and used to build a series of hypotheses using default uncertainty value 3 (defined by Catalyst as the measured value being within three times higher or three times lower of the true value). Indeed, Catalyst generates a chemical-feature-based model on the basis of the most
active compounds. These compounds are determined by performing a simple calculation based on the activity and uncertainty. As a matter of fact, the activity of the most active compound is multiplied by the uncertainty to establish a comparison number, ‘A’. The activity of the next most active compound is divided by the uncertainty, and this result in ‘B’, which is then compared to A. If B is smaller than A, the compound is included in the most active set; if not, the procedure stops.28 In hypothesis generation, the structure and activity correlations in the training set were rigorously examined. HypoGen identifies features that were common to the active compounds but excludes from the inactive compounds within conformationally allowable regions of space. It further estimates the activity of each training set compound using regression parameters. The parameters are computed by the regression analysis using the relationship of geometric fit value versus the negative logarithm of activity. The greater the geometric fit, the greater the activity prediction of the compound. The fit function does not only check if the feature is mapped or not, it also contains a distance term, which measures the distance that separates the feature on the molecule from the centroid of the hypothesis feature. Both terms are used to calculate the geometric fit value.
The generated pharmacophore model should be statistically significant, should predict activity of the molecules accurately, and should identify active compound from a database. Therefore, the derived pharmacophore map was validated using (i) Cost analysis, (ii) Test set prediction. (See supporting information).
Scheme 1. Chemical structures of the 29 training set molecules applied to HypoGen pharmacophore generation.
N N N H O O C l O N N O O N N H O
O C N
C l C l N O N O N C l C l H C N N O H N N H C N O C l C l O O N N N N N H C l O N N O O N N H C N N N C l C l O O N N N H O C l O N O O N N H
O C N
C l C l O N N N N H
O C N
C l C l
O N N N N H O
O C N
B r C l
N N H O
O C N
N O N N H O
O C N
C l B r
N N N H O O F O N N O O O N N H C N C l C l O N N N N N N H O N N S N N N C N N H C l C l
N N N N H S O O N H2
N H N N N N N
H N H2 N S N N C N O C l C l
S N N C N N H C l C l N N N N H O N C l O N N N C l C l O N H N N N H
C l C l
C N O N N N N H O N N N N N C l C l O N H O N N N N H S N H O O N N H S O O N N N C l C l N
H N H
O N H N N N H C N C l C l O S N N N N C l C l O N H2 1 2 3 4
5 6 7 8
9
1 0 1 1 1 2 1 3
1 4
1 5 1 7
1 8 1 9
2 0 2 1
2 2
2 3 2 4
2 5
2 6
2 7
2 8 2 9
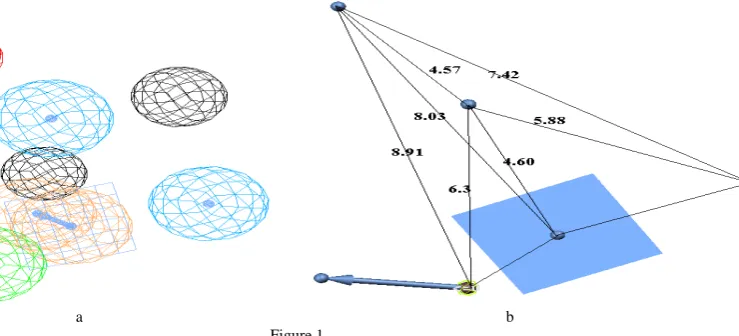
42 Pharmacophore were computed and the best 10 hypotheses were exported. Results of pharmacophore hypotheses are presented in table 1. The first hypothesis (Hypo1) was the best pharmacophore hypothesis, which is characterized by the highest cost difference (68.08), lowest root-mean-square error (0.81), and the best correlation coefficient (0.94). The fixed cost, pharmacophore cost, and null cost are 114.86, 125.47, and 193.55 respectively. Hypo1 is presented with distance in figure 1(a). The pharmacophore model has one hydrogen bond acceptor (A), one ring aromatic (R), two hydrophobic (Z) and one positive ionizable (X). It contains three excluded volumes,(Figure 1(a)) representing the areas where subtle steric (ligand-target) hindrance can occurs for the substituents present at that position and makes the molecule
inactive. Hence these excluded volumes are helpful in refining the pharmacophore to predict the inactive molecules properly. Figure 2 shows the Hypo1 aligned with the highest active compound 1 (Figure (2a)) and lowest active compound 29 (Figure (2b)) of the training set. The pharmacophore model has besides this cost analysis; another validation method to characterize the quality of Hypo1 is represented by its capacity for correct activity prediction. Table 2 lists the actual and estimated inhibitory activities of the 29 molecules from the training set based on the pharmacophore model hypothesis, Hypo1. As we can see from table 2, most of the compounds were predicted correctly. The features of the Hypo1 are fitting well to all the chemical features of highly active training set compound
Table 1. Results of Pharmacophore hypothesis generated using training set against Src- kinase inhibitors:
Hypo no Total cost Cost
-difference Error cost RMS Correlation®
Features
1 125.479 68.07 107.07 0.81 0.949 A,Z,Z,X,R
2 126.36 67.19 108.95 0.88 0.938 A,Z,Z,X,R
3 127.17 66.38 109.72 0.916 0.934 A,A,Z,Z,X
4 131.08 62.47 113.73 1.056 0.911 A,Z,Z,X,R
5 131.81 61.74 113.8 1.058 0.911 A,A,Z,Z,X,
6 133.23 60.32 115.36 1.108 0.902 A,Z,Z,X,R
7 135.35 58.2 118.03 1.188 0.886 A,Z,Z,X,R
8 138.168 55.38 120.84 1.267 0.87 A,Z,Z,X,R
9 140.331 53.22 122.45 1.31 0.86 A,Z,Z,X,R
10 140.351 53.2 123 1.325 0.857 A,Z,Z,X,R
aFixed cost :114.863, Configuration cost 16.1931, Null cost 193.559, All cost values are in bits. A=hydrogen bond acceptor, Z=hydrophobic aliphatic,
X=positive Ionisable, R=Ring aromatic.
2 and having a fit value of 9.99 and the chemical features of least active molecule in the training set is not properly fitting to the pharmacophore features, especially ‘A’ and ‘X’ are not mapped. Further assessed the validity and the predictive character of Hypo1 using the large data of 263 test set molecules having both structural and activity variance. For this validation,activity of the test set compounds was estimated using Hypo1 and a correlation of 0.75 between the actual and estimated was achieved (figure
3). In the test set analysis, most of the IC50 values were
predicted well (see supporting information). Finally, cross validation using the CatScramble program available in Catalyst was applied to assess the statistical confidence of Hypo1. The goal of this type of validation is to check whether there is a strong correlation between the structures and activity. CatScramble mixes up activity values of all training set compounds and creates 19 random spreadsheets. In this validation test, we select the 95% confidence level. The CatScramble results are presented in figure 4.
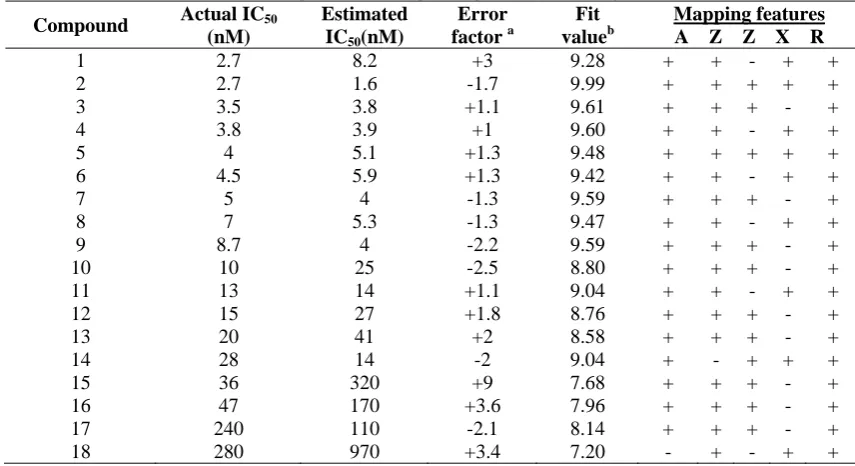
Table 2. Output of the score hypothesis process on the training set:
Compound Actual IC50
(nM)
Estimated
IC50(nM)
Error
factor a
Fit
valueb
Mapping features A Z Z X R
1 2.7 8.2 +3 9.28 + + - + +
2 2.7 1.6 -1.7 9.99 + + + + +
3 3.5 3.8 +1.1 9.61 + + + - +
4 3.8 3.9 +1 9.60 + + - + +
5 4 5.1 +1.3 9.48 + + + + +
6 4.5 5.9 +1.3 9.42 + + - + +
7 5 4 -1.3 9.59 + + + - +
8 7 5.3 -1.3 9.47 + + - + +
9 8.7 4 -2.2 9.59 + + + - +
10 10 25 -2.5 8.80 + + + - +
11 13 14 +1.1 9.04 + + - + +
12 15 27 +1.8 8.76 + + + - +
13 20 41 +2 8.58 + + + - +
14 28 14 -2 9.04 + - + + +
15 36 320 +9 7.68 + + + - +
16 47 170 +3.6 7.96 + + + - +
17 240 110 -2.1 8.14 + + + - +
43
19 450 530 +1.2 7.47 + - + + +
20 580 410 -1.4 7.58 + + + - +
21 780 310 -2.5 7.70 + + + - +
22 960 760 -1.3 7.31 - + + - +
23 1200 1500 +1.2 7.03 + + - - +
24 1500 1500 +1 7.01 - + - + +
25 1800 5000 +2.8 6.49 - + + - +
26 2900 1000 -2.8 7.17 - + + - +
27 4100 610 -6.8 7.41 + + - + +
28 10000 3000 -3.3 6.71 + + - - +
29 50000 14000 -3.6 6.04 - + + - +
aThe error factor is computed as the ratio of the measured activity to the activity estimated by the hypothesis or the inverse if estimated is greater than
measured.
b Fit value indicates how well the features in the pharmacophore overlap the chemical features in the molecule.
For further validation, pharmacophore (Hypo 1) was compared with docking studies (see supporting information). Glide docking program was used to generate
docking poses for all the dataset molecules using 2H8H (PDB entry with resolution of 2.26 Å).
a b Figure 1.
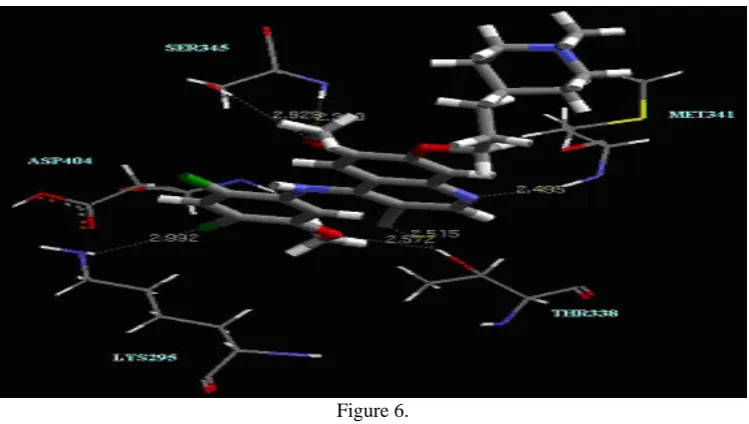
The docking scores were computed for all the molecules (see supplementary information) Figure 6 shows the interaction of best docked conformation of highly active compound (2) inside the active site of c-Src kinase. Several
hydrogen bonds are formed between hit compound and kinase. Interestingly, the compound 2 is forming three hydrogen bond interactions with the amino acid present in the hinge region of the protein.
44 One hydrogen bond is with electron rich quinoline nitrogen of the ligand and main chain NH of Met341. Other two hydrogen bonds are formed as bifurcated hydrogen bond between nitrogen of CN and oxygen of OCH3 of
ligand with side chain OH of Thr338. The ligand is also forming a bifurcated hydrogen bond with oxygen of OCH3
present at 6th position of quinoline ring of ligand and main chain N and side chain OH of Ser345.
The reliability of the docking method, for predicting the bioactive conformation was validated by re-docking the crystal ligand (H8H) into the binding sites of c-Src Kinase
and the docked conformation corresponding to the best glide score was selected as the most probable binding conformation. The Glide predicted conformation of H8H was shown in figure 5 with the superposition of X-ray crystallographic one in active sites of c-Src Kinase. The root mean square deviation (RMSD) between these two conformations is equal to 0.81 Å, suggesting that a high docking reliability of Glide in reproducing the experimentally observed binding mode for c-Src Kinase inhibitors. The optimized 292 compounds were docked into the active site of c-Src kinase.
IS
Figure 3. Figure 4.
We employed the first hypothesis (Hypo1) as 3D-search query against in-house database containing 500 000 compounds, using the ‘best flexible search’ approach implemented within Catalyst. The pharmacophore captured 1259 hits from this database. To further increase the probability that a hit is a lead, the molecule that has fit score > 8.00 are considered for further analysis. From this screen 985 were eliminated and only 274 were remained. These molecules included a broad range of templates that were structurally diverse from the starting molecule. Lipinski ‘rule of five’ to the problem of recognizing ‘drug-like’ molecules has been employed. In this tool, it appears possible to identify compounds, which have desirable or ‘drug-like’ properties. Results indicated that 60 compound satisfies the demands of Lipinski ‘rule of five’. All these compounds were submitted to a docking and scoring
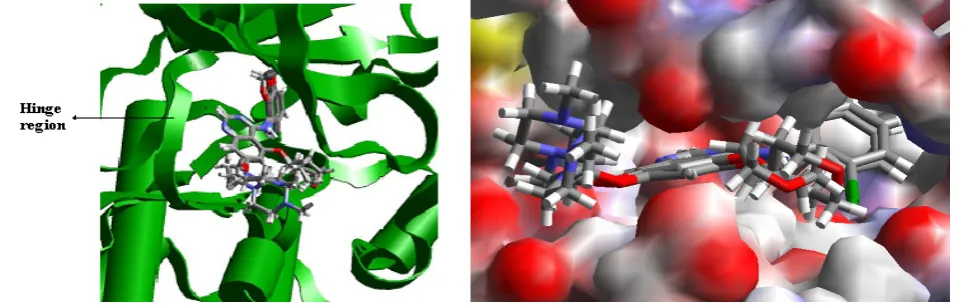
process using the same experimental conditions, which had achieved the best results for known c-Src inhibitors. Docking was performed in order to rank the compounds on the basis of their ability to form favorable interactions within the active site of protein. A high level of selectivity for specific kinase targets, the inhibitors should have interactions with backbone amino acids present in the hinge region of protein. Out of 60 compounds 28 compounds are showing strong hydrogen bond interactions with the hinge region amino acids of c-Src kinase. Figure 7 shows the docking and pharmacophore models having compounds having high docking and fit scores. Interestingly, these molecules are showing more than one hydrogen bond interaction with the hinge region amino acids, Thr338, Glu339, Tyr340, and Met341.
45
Table 3. Examples of in-house compounds with Hypo 1 Estimated Activity, fit value and Glide score
Compound No. Structure Pharmacophore
Estimated Activity
Glide docking score
1
N H N H
C l S
O C l
C l
C l
N O
O O
O
0.007 -10.52
2
N O
O
Cl O Cl
Cl S
O O
N H
NH
N
0.030 -10.51
3
O O
O O
O
N
O
0.038 -9.97
4
N N
N O H
O
O
0.039 -9.95
Figure 6.
Figure 1: (a) The best hypothesis model Hypo 1 produced by the HypoGen module in Catalyst 4.10 software. Pharmacophore features are color-coded with green, blue, brown and red contours representing the Hydrogen-bond acceptor feature (A), Hydrophobic feature (Z), Ring aromatic features (R) and Positive Ionizable(X), respectively. Black contours are for excluded volumes (b) Distance between pharmacophore features are reported in angstroms.
Figure 2. Pharmacophore mapping of the most active compound on the best hypothesis model Hypo 1. (a) Compound 2 from the training set. Pharmacophore mapping of the least active compound on the best hypothesis model Hypo 1. (b) Compound 29 from the training set
Figure 3. Correlation graph between experimental and Hypo 1-estimated activities of test set. Figure 4.The difference in costs between the HypoGen runs and the scrambled runs.
Figure 5. Superimposition of docked compound calculated by Glide and X-ray crystallographic conformations in active sites of c-Src kinase. Figure 6. Docked conformation of the most active compound 1 in the active sites of c-Src kinase Broken lines represent hydrogen bonds. Figure 7. Docking and Pharmacophore mapping of in-house compounds having highest fit value and Glide score. (See supplementary information)
In conclusion, a highly predictive pharmacophore model was generated based on 29 training set compounds, which consists of one hydrogen bond acceptor (A), two
46 predicted the activity of a large and diverse dataset of 263 test set compounds with correlation of 0.750. It indicates that the model is reliable and can be used as a three-dimensional query in database searches to identify compounds with diverse structures that can potentially inhibit c-Src. To analyze the detailed docking intermolecular interactions between protein and the ligand, we have docked all the 292 molecules into the active site of c-Src kinase. The highly active compounds show many interactions with the protein, especially with hinge region amino acids. Pharmacophore and docking methods were used as virtual screening tool to retrieve the compounds from in-house database containing 500 000 compounds. 28 compounds were obtained as a result of virtual screening and these molecules are having good mapping with pharmacophore model and having strong hydrogen bond interaction with hinge region amino acids of c-Src kinase
ACKNOWLEDGEMENTS
We thank Dr. J.A.R.P. Sarma, Senior Vice President, GVK Biosciences Pvt. Ltd., for his cooperation and for providing software facilities.
REFERENCES
[1] Boschelli, D. H.; Boschelli, F. Drugs Future. 2000, 25, 717. [2] Russello, S. V.; Shore S. K. Front Biosci. 2004, 9, 139. [3] Frame, M. C. Biochim. Biophys. Acta. 2002, 1602, 114. [4] Irby, R. B.; Yeatman, T. J. Oncogene 2000, 19, 5636. [5] Shah, Y. M.; Rowan, B. G. Mol. Endocrinol. 2005, 19, 732. [6] Ashcroft, A. J.; Davies, F. E.; Morgan, G. J. Lancet Oncol. 2003, 4,
284.
[7] Marcelli, C.; Chappard, D.; Rossi, J. F.; Jaubert, J.; Alexandre, C.; Dessauw, P.; Baldet, P.; Bataille, R. Cancer 1988, 62, 1163. [8] La Rosee, P.; Corbin, A. S.; Stoffregen, E. P.; Deininger, M. W.;
Druker, B. J. Cancer Res. 2002, 62, 7149.
[9] Huron, D. R.; Gorre, M. E.; Kraker, A. J.; Sawyers, C. L.; Rosen N.; Moasser, M. M. Clin. Cancer Res. 2003, 9, 1267.
[10] Ple, P. A.; Green, T. P.; Hennequin, L. F.; Curwen, J.; Fennell, M.; Allen, J.; Lambert-van der Brempt, C.; Costello, G. J. Med. Chem. 2004, 47, 871.
[11] Hennequin, L. F.; Allen, J.; Costello, G. C.; Curwen, J.; Fennell, M.; Green, T. P.; Jacobs, V.; Lambert-van der Brempt, C.; Morgentin, R.; Olivier, A.; Ple, P. A.; Whittaker, R. Proc. Am. Assoc. Cancer Res. 2003, Abstract B193.
[12] Boschelli, D. H.; Ye, F.; Wang, Y. D.; Dutia, M.; Johnson, S. L.; Wu, B.; Miller, K.; Powell, D. W.; Yaczko, D.; Young, M.; Tischler, M.; Arndt, K.; Discafani, C.; Etienne, C.; Gibbons, J.; Grod, J.; Lucas, J.; Weber, J. M.; Boschelli, F. J. Med. Chem. 2001, 44, 3965.
[13] Golas, J. M.; Arndt, K.; Etienne, C.; Lucas, J.; Nardin, D.; Gibbons, J.; Frost, P.; Ye, F.; Boschelli, D. H.; Boschelli, F. Cancer Res. 2003,
63, 375.
[14] Golas, J. M.; Lucas, J.; Etienne, C.; Golas, J.; Discafani, C.; Sridharan, L.; Boghaert, E.; Arndt, K.; Ye, F.; Boschelli, D. H.; Li, F.; Titsch, C.; Huselton, C.; Chaudhary, I.; Boschelli, F. Cancer Res. 2005, 65, 5358.
[15] Shah, N. P.; Tran, C.; Lee, F. Y.; Chen, P.; Norris, D.; Sawyers, C. L. Science , 2004, 305, 399.
[16] Laurent F.; Hennequin, Jack Allen, Jason Breed, Jon Curwen, Michael Fennell, Tim P;. Green,Christine Lambert-van der Bremp Re´my Morgentin, Richard A. Norman, Annie Olivier, Ludovic Otterbein,Patrick A.; Ple´, Nicolas Warin, and Gerard Costello. J. Med. Chem. 2006, 49, 6465.
[17] Glenn Noronha, Kathy Barrett, Antonio Boccia, Tessa Brodhag, Jianguo Cao, Chun P.; Chow, Elena Dneprovskaia, John Doukas, Richard Fine, Xianchang Gong, Colleen Gritzen, Hong Gu, Ehab Hanna, John D. Hood, Steven Hu, Xinshan Kang, Jann Key, Boris Klebansky, Ahmed Kousba, Ge Li, Dan Lohse, Chi Ching Mak, Andrew McPherson, Moorthy S. S.; Palanki, Ved P;. Pathak, Joel Renick, Feng Shi, Richard Soll, Ute Splittgerber, Silva Stoughton, Suhan Tang, Shiyin Yee, Binqi Zeng, Ningning Zhao and Hong Zhua. Bio. Med. Chem. Lett. 2007, 17, 602.
[18] Diane H. Boschelli, Ana Carolina Barrios Sosa,_Jennifer M.; Golas and Frank Boschelli. Bio. Med. Chem. Lett, 2007, 17, 1358.
[19] Diane H.; Boschelli, Yanong D;. Wang, Steve Johnson, Biqi Wu, Fei Ye, Ana Carolina Barrios Sosa, Jennifer M.; Golas, and Frank Boschelli. J. Med. Chem. 2004, 47, 1599..
[20] Dan Berger, Minu Dutia, Dennis Powell, Allan Wissner, Frenel DeMorin, Yuri Raifeld, Jennifer Weber and Frank Boschelli. Bio. Med. Chem. Lett,2002, 12, 2989.
[21] Diane H.; Boschelli, Biqi Wu, Ana Carolina Barrios Sos, Haris Durutlic, Fei Ye, Yuri Raifeld, Jennifer M.; Golas, and Frank Boschelli. J. Med. Chem. 2004, 47, 6666.
[22] Diane H.; Boschelli, Yanong D;. Wang, Fei Ye, Biqi Wu, Nan Zhang, Minu Dutia, Dennis W.; Powell, Allan Wissner, Kim Arndt, Jennifer M.; Weber, and Frank Boschelli. J. Med. Chem. 2001, 44,
822.
[23] Mel C,; Schroeder, James M,; Hamby, Cleo J. C.; Connolly, Patrick J.; Grohar, R.; Thomas Winters, Mark R;. Barvian, Charles W.; Moore, Stacey L.; Boushelle, Sheila M.; Crean, Alan J.; Kraker, Denise L.; Driscoll, Patrick W.; Vincent, William L.; Elliott, Gina H.; Lu, Brian L.; Batley, Tawny K.; Dahring, Terry C.; Major, Robert L.; Panek, Annette M.; Doherty, and H. D.; Hollis Showalter. J. Med. Chem. 2001, 44, 1915.
[24] Andrew M; Thompson,; Gordon W; Rewcastle,; Stacey L; Boushelle; Brian G.; Hartl; Alan J; Kraker; Gina H; Lu,; Brian L; Batley, Robert L; Panek, H. D; Hollis Showalter; and William A; Denny. J. Med. Chem. 2000, 43, 3134.
[25] Diane H.; Boschelli, Biqi Wu, Ana Carolina Barrios Sosa, Joan J.; Chen, Jennifer M.; Golas and Frank Boschelli. Bio. Med. Chem. Lett. 2005, 15, 4681.
[26] Cerius 2, molecular modeling program package; Accelrys: San Diego, CA.
[27] Smellie,A.;Teig,S.L.;Towbin,P.J.Comput.Chem.1995 , 16 ,171. [28] Santo,R.D.;Fermeglia,M.;Ferrone,M.;Paneni,M.S.;Costi,R.;Artico,M.
;Roux,A.;Gabriele,M.;Tardif,K. D.;Siddiqui,A.;Pricl,S. J.Med.Chem.
2005, 48, 6304.
[29] InterBioScreen homepage. http://www.ibscreen.com. [30] ChemStar homepage. http://www.chemstar.ru.
[31] Molecular Diversity Preservation International homepage. http://www.mdpi.org.
[32] Key Organics Ltd homepage. http://www.keyorganics.ltd.uk.
[33] ASINEXs Intelligent Chemistry homepage. http://www.asinex.com/welcome.htm