IJIRT 142521
INTERNATIONAL JOURNAL OF INNOVATIVE RESEARCH IN TECHNOLOGY179
xnEvaluation of Physicochemical and Antioxidant
Property of Dehydrated Hibiscus (
Hibiscus rosa-sinensis)
Flower Petals and Its Stability in Product Preparation
RMNA Wijewardana
1, S.B. Nawarathne
2, I.Wikramasinghe
21
Institute of postharvest Technology,Jayanthi Mawatha, Anuradhapura, Sri Lanka
2
Department of Food science and Technology,University of Sri Jayewardenepura, Sri Lanka
Abstract— The study was conducted to analyze the physico-chemical and antioxidant property of fresh and dehydrated Hibiscus powder petals and its stability in product preparation. The proximate analysis of fresh hibiscus flower petals showed the moisture 89.34%, fat 2.76%, protein 4.12%, total ash 7.23%, fiber 10.75% and anthocyanin content 877.04 mg/100g. Different drying methods were evaluated such as sun drying, solar drying, drying after freezing (Freeze for one hour followed by drying mechanical drying at 55°C), vacuum drying (50°C) and drying using lab scale air oven (55°C) on physiochemical and retention of antioxidants in powder of dehydrated hibiscus flower petals. Higher concentration of protein (4.05) and anthocyanin (107.5 mg/100g) were recorded in vacuum dried sample and it significantly different (α= 0.05) from other treatments. The data on change in physico chemical characteristics of different treatments (jelly powder mix) upon storage of 60 days; the lower moisture content (4.031%) and fat content (0.31%) was recorded by T4 at the end of storage. It was given a significant loss of anthocyanin content during storage and the highest composition was given by T3 (10.47 mg/100g). The colour intensity (L* value) indicated that the product was brighter in appearance and the maximum was recorded by T1 followed by T2 and the higher a* value was recorded by T4 followed by T2. A slight reduction of DPPH radical scavenging activity was observed among dry powder mix vs. the prepared product and it depends upon the composition of hibiscus powder incorporated.
Index Terms— dehydration, Antioxidant activity, proximate compositions, hibiscus powder, storage, jelly
I. INTRODUCTION
Hibiscus is a tropical shrub with red petals is considered to have a number of medical uses in Chinese herbology. It may have potential in cosmetic skin care, an extract shown to function as an anti
solar agent by absorbing UV radiation (Nevada et al.,
2011). Recently there has been an increased interest in research on food components such as anthocyanins and other phenolic compounds because of their possible linkage to health benefits including reduction in heart disease and censer, based on their antioxidant activity (Seeram et al., 2003) . Colour additives are used in food and beverages for various reasons. Its help to maintain correct natural variation in the actual colour of the product and also should be stable during storage. Also, it makes products more visually appearing and they emphasize or identify flavours normally associated with various applications. The use of natural derived colours in food applications has increased considerably over the recent past due to consumer demand for natural products and consumer avoidance of artificial food additives. The market for natural food colourings continue to get brighter as more attention is paid to research linking artificial food dyes with hyperactivity and other behavioural problems in children are increasingly looking for natural coloured food products. Anthocyanins are the group of natural plant pigments, which have been used to colour foods since historical times. Anthocyanins are sensitive to pH changes and give a red colour at acidic conditions (Mortensen, 2006).Therefore, this research was proposed and carried out with the objective of use of natural colorant as an alternative for artificial colorants the use in instant type commercial food applications and evaluates its antioxidant potential.
II. MATERIALS AND METHODS 2.1. Sample preparation:
IJIRT 142521
INTERNATIONAL JOURNAL OF INNOVATIVE RESEARCH IN TECHNOLOGY180
collected. The flower petals were carefully removed (without anther, stamen or sepals) and were steam blanched for 1 minute before drying. Powder was prepared by drying using different dehydration techniques like the sun drying, solar drying, drying after freezing (Freeze for one hour followed by drying using lab scale air oven at 55ºC), vacuum drying at 50 ºC and drying using lab scale air oven at 55ºC followed by grinding and sifted to get fine partials (150 µm).
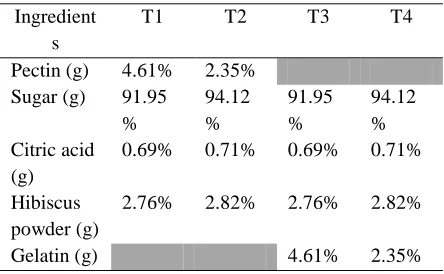
Table 1: Formulation of instant jelly mix Ingredient
s
T1 T2 T3 T4
Pectin (g) 4.61% 2.35% Sugar (g) 91.95
%
94.12 %
91.95 %
94.12 % Citric acid
(g)
0.69% 0.71% 0.69% 0.71%
Hibiscus powder (g)
2.76% 2.82% 2.76% 2.82%
Gelatin (g) 4.61% 2.35%
The experiment was conducted in a laboratory condition and four different treatments were formulated by changing the concentration of pectin and gelatin as thickening agents ( Table.1).
The major ingredients for the preparation of jelly mix were sugar and other ingredients such as gelatin, pectin and citric acid in food grade were purchased from the market. All the ingredients were mixed according to the proportions given in table 1. Powder mix of T1 and T2 were mixed with water in 1:4 ratios and heated until TSS become 60°brix and prepared jelly was kept for stabilization. T3 and T4 were mixed in above ratio with hot water (75° C) and kept in a refrigerator for 45 min. for stabilization.
2.2. Determination of physico-chemical quality attributes in instant jelly mix
Moisture content, Ash, total fat, protein content and crude fat were determined according to AOAC (1990)
Total anthocyanin content:
The anthocyanin pigments dried flower petal powder was extracted with a solvent mixture of acidic ethyl alcohol (Ranganna, 1986) and the intensity of colour
was measured through 535nm wavelength in a spectrophotometer against the blank. The amounts of anthocyanin present in the sample were expressed as mg/100g.
Determination of the antioxidant activity
Solvent extraction process
Extraction was performed by modified method (Vasco et al., 2008); 1 g of the powdered sample was dissolved in 100 ml of methanol and kept at room temperature for 48 hours. The extracts were filtered through a Whatman filter paper and concentrated using a rotary evaporator at 40 °C. Antioxidant screening
The DPPH assay (1, 1-diphenyl-2-picryl hydrazyl)/ free radical scavenging assay was followed (Turkmen
et al., 2005). The solvent extracts of the sample were taken in the following concentration range i. e., 200, 400, 600, 800, 1000 μL in each test tube and the volume was made up to 1 mL with the solvent and 3 mL of 0.1 mM DPPH is added to all the tubes. The mixture was shaken well and incubated at room temperature for 30 minutes and absorbance was measured at 517 nm using a UV- spectrophotometer. All the experiments were performed in triplicate and the mean taken. Scavenging activity was calculated from control sample OD using the following equation Radical Scavenging Activity % = {(Ac –At) / Ac} x 100 Where, Ac-Absorbance of control;
At- Absorbance of test solution /sample
Colour analysis
Different treatments were subjected to colour analysis using a colorimeter (Konica Minolta TR 400). Minolta colour scale was used to measure the lightness, which was indicated by L* value [L* = 0 (black) to L*= 100 (white)]. Regarding the colour analysis, a* and b* values that shift from negative to positive values are an indication of the shift from bluish-red and from blue to yellow respectively.
2.3. Determination of physico-chemical quality attributes in jelly product
IJIRT 142521
INTERNATIONAL JOURNAL OF INNOVATIVE RESEARCH IN TECHNOLOGY181
Colour, Total soluble solids (TSS), pH and Titratable acidity;
Colour changes of prepared product was observed by an increase in the a/b ratio with increase in yellowness (b) and decrease in greenness (a) orange external colour was evaluated with colour difference meter (Konica Minolta TR 400). TSS has been determined by direct reading on a refractometer {ATAGO, Model: HR-5 (9-90%), Japan}. Reading was reported as 0Brix. Titratable acidity was determined by the following volumetric method. The sample was neutralized by a NaOH solution (0.1 mol L-1) added by some drops of phenolphthalein as indicator solution. Indeed, under neutral conditions, the NaOH solution turned to the pink. A known sample weight sample was taken into 250 ml volumetric flask and the volume was made up after filtration, in addition, 10 ml of filtration were titrated with 0.1 N NaOH by using phenolphthalein as an indicator to the end point of faint pink color (Horwitz, 1980). pH of was determined using a digital pH meter (9157 BN, Witchford, England) .
2.4. Statistical analysis
Data obtained were in triplicate (n=3) and the results were assessed by completely randomized design using ANOVA by SAS statistical package. Mean separation was done by using Least Significant Difference (LSD) at α= 0.05. The nonparametric data were analyzed using Friedman test with Minitab statistical package.
III. RESULTS AND DISCUSSION
Composition of dehydrated hibiscus powder
Table 2: proximate composition of fresh Hibiscus flower petals
Fruit parameter %
Composition (db)
Hibiscus Moisture (%) 89.34±0.06 Fat (%) 2.76±0.03 Protein (%) 4.12±0.01
Total ash (%) Fiber (%) Anthocyanin Mg/100g
7.23±0.01 10.75±0.01 877.04 ±0.03
The standard deviation for three replicate (n=3) determinations.
The fresh composition of hibiscus flower petal and the composition of dehydrated powder of flower petal such as moisture, fat, protein, total ash, fiber and anthocyanin content were given in Table 2 and Table 3 respectively in their percentage composition. The results confirmation with the findings of Yashasini et al., 2011 the composition given as protein 3.9%, fat 3.9% and fiber 15.7% in dry weight basis.
IJIRT 142521
INTERNATIONAL JOURNAL OF INNOVATIVE RESEARCH IN TECHNOLOGY182
Table 3: Quality of dehydrated flower petal powder by different drying techniques parameter Solar drying Oven drying Freeze prior
to drying
Sun drying Vacuum drying Hibiscus Moisture (%) 7.21±0.02 7.59±0.02 7.50±0.01 7.42±0.02 7.50±0.01
Fat (%) - - - - -
Protein (%) 3.49±0.02 3.80±0.17 3.78±0.19 3.55±0.05 4.05±0.05 Total ash (%) 4.11±0.01 4.41±0.02 4.11±0.01 4.31±0.01 4.11±0.01 Fiber 6.51±0.02 6.79±0.01 6.31±0.01 6.51±0.02 6.11±0.01 Anthocyanin
Mg/100g
94.26±0.07 86±0.40 93.32±0.02 84.28±0.07 107.5±0.45
The standard deviation for three replicate (n=3) determinations.
The study revealed that the radical scavenging activity (DPPH) of vacuum dried hibiscus powder recorded the highest ranged from 13.86% - 25.26% at the concentration 200- 1000 µg/ml of extracts and lowest was recorded by sun- dried samples that were given the scavenging activity 6.22% - 8.64% (Figure 1).
Figure 1: DPPH radical scavenging activity of dehydrated hibiscus flower petal powder
T1: Vacuum drying; T2: Sun drying; T3: Solar drying; T4: Freeze for one hour prior to drying in lab scale air oven; T5: Drying using lab scale air oven
The data on change in physico chemical characteristics of different treatments (powder mix) upon storage of 60 days is presented in Table 4. The initial moisture content varied from 3.41% - 3.53% with a maximum in T3 and T4 and the slight increase in storage 4.03% - 4.64%. The fat and the total ash
content were exhibited decreasing trend throughout the storage. It was given a significant loss of anthocyanin content during storage and the highest composition was given by T2 at the end of storage (10.47 mg/100g). Hendry and Houghton (1996) reported that a variety of acid dessert mix and drink powders can be successfully colored with spray dried anthocyanin extracts.
IJIRT 142521
INTERNATIONAL JOURNAL OF INNOVATIVE RESEARCH IN TECHNOLOGY183
Storage intervals in days
Treatments parameter 15 30 45 60 T1 Moisture (%) 3.44h 3.63f 3.87d 4.21b
Fat (%) 0.21h 0.21h 0.19i 0.19i Total ash (%) 0.19f 0.18f 0.18g 0.17h Anthocyanin mg/100g 2.7i 2.7i 2.6j 1.39m T2 Moisture (%) 3.41h 3.52g 3.74e 4.05c
Fat (%) 0.24f 0.23g 0.21h 0.21h Total ash (%) 0.35d 0.34de 0.34d 0.3d Anthocyanin mg/100g 2.7i 2.5k 2.4l 1.32n T3 Moisture (%) 3.53g 3.54g 3.83d 4.64a Fat (%) 0.31cd 0.30d 0.28e 0.29e Total ash (%) 0.36c 0.36c 0.34d 0.33e Anthocyanin mg/100g 12.22a 12.07b 11.41c 10.47d T4 Moisture (%) 3.53i 3.53g 3.62f 4.03c
Fat (%) 0.36a 0.34b 0.32c 0.31cd Total ash (%) 0.48a 0.47a 0.46b 0.45b Anthocyanin mg/100g 5.5e 5.3f 4.3g 3.3h
The standard deviation for three replicate (n=3) determinations. Means with the same letters on the same raw are not significantly different at α= 0.05
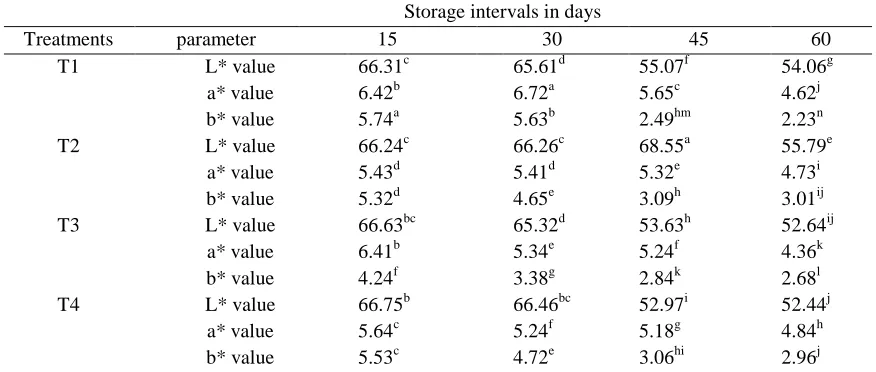
The higher L* value indicated that the product was brighter in appearance and the maximum was recorded by T3 followed by T4 at the end of storage. Higher a* value was recorded by T4 followed by T3 (Table 5) and that was indicated its reddish shade with moderate intensity. The colour of anthocyanin gradually change from red through blue red, purple, blue and green to yellow as the pH increased from
pH 1 through 4, 6,8,12 to 13 respectively. From a particular point of view, anthocyanines are only used in acidic products where the pH is 4 or below. Not only does colour shades change with pH but colour intensity also pH dependant being great at pH 1 and decreasing rapidly as pH raised (Hendry and Houghton, 1996).
Table 5: Colour changes of instant jelly mix during storage
Storage intervals in days
Treatments parameter 15 30 45 60 T1 L* value 66.31c 65.61d 55.07f 54.06g a* value 6.42b 6.72a 5.65c 4.62j b* value 5.74a 5.63b 2.49hm 2.23n T2 L* value 66.24c 66.26c 68.55a 55.79e
a* value 5.43d 5.41d 5.32e 4.73i b* value 5.32d 4.65e 3.09h 3.01ij T3 L* value 66.63bc 65.32d 53.63h 52.64ij
a* value 6.41b 5.34e 5.24f 4.36k b* value 4.24f 3.38g 2.84k 2.68l T4 L* value 66.75b 66.46bc 52.97i 52.44j
a* value 5.64c 5.24f 5.18g 4.84h b* value 5.53c 4.72e 3.06hi 2.96j
IJIRT 142521
INTERNATIONAL JOURNAL OF INNOVATIVE RESEARCH IN TECHNOLOGY184
Table 6: Chemical composition of jelly product (prepared from 100g of powder mix)
Parameter % composition TSS (°B) 65.4±0.03 Titratable acidity (%) 0.1±0.02 Colour
L* 47.8±0.04
a* 3.7±0.05
b* 1.4±0.03
Anthocyanin Mg/100g 3.1±0.01
pH 3.5±0.04
The standard deviation for three replicate (n=3) determinations. Means with the same letters on the same raw are not significantly different at α= 0.05
The TSS content of the prepared product was 68.4 (°B). According to the SLS, 265: 1985 reported that the sugar content shall be not less than 65% by mass. Anthocyanin content in powder mix (T4) was 5.5mg/100g and it was reduced up to 3.1mg/100g after product preparation and that was not a great effect for the colour intensity of the product because it showed medium intensity by giving 47.8 in L* value and the a* value represented 3.7 that is in the range of red shade (Table 6).
a) DPPH radical scavenging activity of jelly mix
b) DPPH radical scavenging activity of jelly product
Figure 2: DPPH radical scavenging activity of jelly mix and its prepared product
Four different treatments were evaluated for DPPH scavenging activity (Fig.2) and the results revealed that no any significant difference between T1and T3 as well between T2 and T4. It may be due to the addition of a same quantity of hibiscus powder, 2.76% in T1 and T3 where as 2.82% in T2 and T4. There was a significant difference (α= 0.05) among the treatments having a different composition such as 2.76% and 2.82%. The treatments having 2.82% composition of hibiscus dry powder recorded higher radical scavenging activity than other two treatments with 2.76%.
IV. CONCLUSIONS
IJIRT 142521
INTERNATIONAL JOURNAL OF INNOVATIVE RESEARCH IN TECHNOLOGY185
and the maximum was recorded by T3 followed by T4 at the end of storage. Higher a* value was recorded by T4 followed by T3. The antioxidant activity was depending on the processing conditions applied and it was observed the slight reduction of DPPH radical scavenging activity between dry powder mix and the prepared product.
REFERENCES
1. AOAC. 1990. Official methods of analysis, 15th edn. Association of Official; Analytical Chemists, Washington DC.
2. Cai, Y., Luo, Q., Sun, M. and Corke., H. 2004. Antioxident activity and phenolic compounds of 112 traditional Chinese medicinal plants associated with anticancer. Life Science, 74, 2157-2184.
3. Hendy, G.A.F., Houghton, J.D. 1996. Food colourant. 2nd edn.Blackie Academic and Professional, Chapman and Hall, Wester Cleddens Road, Bishopbriggs, Glasgow. 4. Hortwitz, W. 1980 Official methods of
analysis. 13th edn. Association of Analytical Chemists, Washington DC
5. Mortensen A. 2006. Carotenoids and other pigments as natural colourants, Pure and applied chemistry, 78(8), 1477-1491 6. Nevada S.A., Lokapure,S.G. and Kalyane,
N.V. 2011. Study on anti-solar activity of ethanolic extract of flower of Hibiscus rosa-sinensis. Research jpurnal of Pharmacy and Technology, 4(3), 472-473.
7. Ranganna, S. 1986. Hand book of Analysis and Quality Control of Fruit and Vegetable products. Tata McGraw Hill Publishing Co.Ltd. New Delhi.pp.931-932.
8. Seeram, N.P., Schutziki, R., Chandra, A. and Shanim,O.2003. Characterization,quantification and Bioactivities in Cormus Species. Journal of Agricultural Food Chemestry,50, 2919-2523.
9. SLS 265: 1985 Specification for jam, jellies, marmalades and preserves (first revision) .Sri Lanka Standards Institute.
10. Turkmen, N., Sari, F. and Velioglu, Y.S. 2005.The effect of cooking methods on total phenolic and antioxidant activity of selected green vegetables. Food Chem, 93, 713-718. 11. Vasco,C., Ruales, J. and Kamal-Eldin.
2008.Total phenolic compounds and antioxidant capacities of major fruits from Ecuador, Food Chem,11, 816-823.
12. Yang, D. J., Chang, Y.C., Chen, Y.C., Liu, S.C., Hsu, C.H. and Lin., J.T. 2012. Antioxident effect and active compounds of Litchi (Litchib chinensis Sonn.) flower. Food and Chemical Toxicology, 50, 3056-3061.