Modeling, Testing and Experimental Validation
of Laser Machining Micro Quality Response by
Artificial Neural Network
Sivarao,
Peter Brevern, N.S.M. El-Tayeb and V.C.Vengkatesh
Abstract— One way to reduce uncertainty in problem
solving and decision making is by seeking the advice of an expert in related field. On the other hand, when we use computers to reduce uncertainty, the computer itself can become an expert in a specific field through a variety of methods. One such method is machine learning, which involves computer algorithm to capture hidden knowledge from data. In this research, a problem solving scenario for a metal cutting industry which faces some problems in determining the end product quality of Manganese Molybdenum (Mn-Mo) pressure vessel plate is investigated. Therefore, several real life machining scenarios with some expert knowledge input and machine technology features were incorporated. Three significant design parameters were used, namely; cutting speed, gas pressure and power. Artificial Neural network (ANN) has an ability to derive meaning from complicated data, and can be used to extract patterns and detect trends that are too complex to be noticed by either humans or other computational techniques. Therefore, prediction of laser machining cut quality, namely surface roughness was carried out using machine learning techniques based on Quick Back Propagation Algorithm using ANN. Experimentally observed responses were used to train, map and optimize the network algorithms before the best architecture was selected. Ten different architectures and models were tested and finally the best 3-8-1 model was finalized based on R s quare values. The model was then fed with new sets of machining parameters to experimentally validate the model ’s ability in predicting the cut quality. The findings were found to be very promising and yielded excellent accuracy for both model and experimental validation reaching almost 88% and 92% respectively.
Index Term— Artificial Neural network, predictive modeling, laser processing, surface roughness, back propagation.
I. INTRODUCTION
Laser cutting is used in precision industries as it has the ability to cut co mp le x profiles featuring e xt ra o rdinary shapes, corners, slots, and holes with high degree of
Ir. Sivarao is a Professional Engineer (P.Eng.) in the field of Mechanical Engineering who currently serves as a lecturer and researcher in the Faculty of Manufacturing engineering, Universiti T eknikal Malaysia Melaka (UTeM). He is the corresponding author. (phone: 6063316505,
Fax: 6063316411 & email: [email protected] or [email protected]).
Dr. Peter Brevern, PhD. – An expatriate from Germany who is currently the Dean, Faculty of Engineering and T echnology (FET ),
Multimedia University, Malaysia (email: [email protected]) Dr. N.S.M. El-T ayeb, PhD. – An expatriate from Iran, currently attached to Faculty of Engineering and T echnology (FET ), Multimedia
University, Malaysia (email: [email protected])
V.C.Vengkatesh is a machining Professor at Faculty of Engineering and T echnology, Multimedia University, Malaysia (email:
will not only drag the mo lten meta l a way, but will a lso provide e xothermic reaction in the cutting section enhancing the availability of energy to increase the cutting speed [5]. Recent research activities in precision mach ining have shown that artific ia l neural network (ANN) has powerfu l pattern classificat ion and recognition capabilit ies as it is also known as universal functional appro ximator. A NN can be well suited for proble ms whose solutions require knowledge that is difficu lt to specify. They learn fro m e xa mp les (train ing data) and capture subtle functional re lationships among the data even if the underlying relationships are unknown or hard to describe. It has been proven that properly designed network can appro ximate any continuous function to any desired accuracy [6]. ANN was used to classify tool wear states in periphera l milling where five input features were applied to the back-propagating neural network to predict a wea r state of light, mediu m o r heavy wear [7]. A t rained mu lti-layer perceptron to predict spot-weld quality of a lu minum alloys due to unseen inputs were carried out by [8]. Neura l network capability is investigated in developing a re liable method to predict flank wear in turning process with the input numeric of tool geo metry, depth of cut, cutting speed, federate, workpiece properties, cutting fluid [9]. The cutting force model for self-propelled rotary tool (SPRT) cutting force p rediction using artific ia l neural networks (A NN) with cutting velocity, feed rate, depth of cut and tool inc lination angle as inputs has been carried out by [10] to co mpose thrust force, radial force and ma in cutting force. The presentation of how to develop a robust approach for prediction of residual stress profile in hard turning for diffe rent comb inations of materia l properties, cutting tool geometries and cutting conditions has been carried out [11]. An optoelectronic sensor system has been used in conjunction with a mu ltilayered neura l network to predict the flank wea r o f the cutting tool without interrupting the machin ing process [12]. Co mparison between several architectures of the multi-layer feed-forwa rd neural network with a back propagation training algorith m in tool condition monitoring of twist drill wea r is carried out [13].
II. EXPERIM ENTALSET-UPANDPROCEDURE
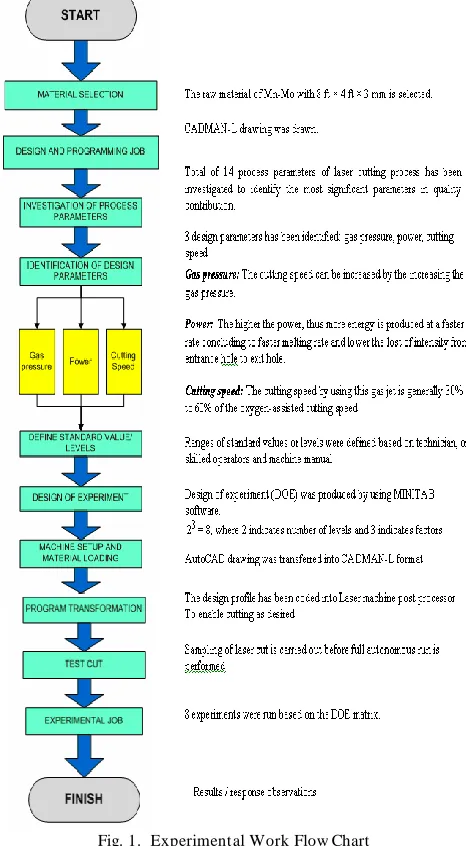
An experiment has been conducted by using a laser cutting mach ine. The investigated research work was conducted on 3 mm Mn-Mo pressure vessel plate with He lius 2513 Hybrid Co 2 Laser machine. Fro m literature and user manual, it was found that there are mo re than 14 process parameters on this kind of mach ine. Any how, only 3 parameters were selected; gas pressure, power and cutting speed as these parameters we re found to be the most influencing in determin ing the cut quality. A nozzle dia meter of 0.5mm with 0.25mm focused beam dia meter is used to cut 3mm Manganese-Molybdenum pressure vessel plate. The e xperimental work bloc k diagra m is shown in Fig. 1 below.
Fig. 1. Experimental Work Flow Chart
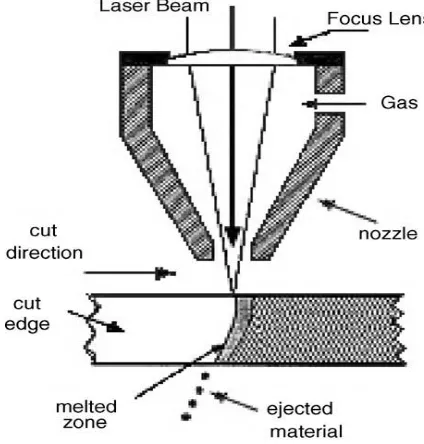
The entire e xperiment has been designed based on Design Of Experiment to study the ma in and interaction effect of used parameters. Therefore , the randomized e xpe rimental runs were performed. Tab le I shows the DOE matrix with low and high leve l vales for the design para meters. The schematic of laser machining with applied no zzle , lance, cutting direction, etc. is shown in Fig. 2.
TABLE I
DOE Matrix : Randomized experimental runs
Randomiz e d O rde r
Gas Pressure (bar)
C utting Speed (mm/min)
Powe r (W)
5 5 1330 2000
8 7 1730 2000
2 7 1330 1600
7 5 1730 2000
6 7 1330 2000
3 5 1730 1600
1 5 1330 1600
Fig. 2. Laser cutting schematic
III. MACHINING CONDIT IONS
The details of the workpiece materia ls, design parameters, laser machine and equip ments utilized in th is research activity are below listed in brief.
A. Work Material:
• DIN 17155 HII standard
• 3.0mm Manganese-Molybdenum • Grade: B
• Tensile Strength: 550-690 MPa
B. Controllable parameters:
C. Laser machine:
• Model: Helius Hybrid 2514 CO2 Laser Cutting machine
• Controller: FANUC Series 160 i-L • Maximum capacity: 4 kW
• Laser source that use to create laser beam is CO2 gas. The real ingredient is mixture of N2 (55%), He (40%) & CO2 (5%) with purity 99.995%.
• Pressure = Max 3 bar
D. Surf tester:
• Mitutoyo Surftest SJ301 • Sampling length range (0.8 ~ 8)
IV. ARTIFICIALNEURALNETWORK(ANN) In this research, the ANN mode l design follows a stepwise method, progressively adding and comparing possible inputs to output to develop the model. A neura l network mode l was selected for this work over other techniques because of its ability to model non-linear system, robustness to noisy data,
and generic modeling capability. The eight ANN models were developed, trained, and tested with the Intelligent Neural System to an optimized and satisfactory level of correlation and R-square values before selecting the network for final prediction. Inputs to the neural networks were the numeric o f significant pa ra meters wh ich a ffects the quality of the machined surface. Since the predict ion of the cut quality is the primary aim, the ANN models were init ially optimized based on training and testing over all the observed data sets. This methodology was adopted in large scale to ensure the results are met to the satisfactory level of the sponsored industry.
The comp lete e xperimental data sets have been used to train the network, where the learning process was stopped after 500 iterations. The number of neurons and layers were calculated automat ically based on the network t rain ing error based on QBPA algorithm with 3-8-1 arch itecture. The first step of the calculation is to normalize a ll the ra w input data to values between 3 and 40 is shown by (1).
min max min
40
( ) 3
i i
x d d
d d
(1)
The dmax and dmin are the ma ximu m and min imu m inputs and
i
d is ith input. Input of ith neuron on hidden layer
I
yi , calculated by,1
M
yi xy i
i
I w x
(2)M is number of neurons in input layer and wxy is numerica l
weight value of the connection between the two neurons. xi
is ith normalized output fro m the input layer. The output of the ith neuron on hidden layer yi is to be calculated by applying an activation function to the summed input of that neuron. The output of ith neuron on hidden layer then appear as,
( )
1
( )
1 yi
i yi s I
y f I
e
(3) The s is the slope of the sigmo id function and the values received by the output layer Iz are outputs of the hidden and
input layers.
1 1
M N
xz i yz i
i i
Izi w x w y
(4)M and N a re the nu mbers of neurons in the input and hidden layers.
w
xz andw
yz are corresponding weights fro m theinput to the output layer and fro m hidden layer to output layer. The actual output in the output layer is calcu lated by applying the same sig moid function as applied for h idden layer.
zi f I( zi) (5) Error between the desired and actual output in the output layer is given by
'( )( )
zi f Izi Ti Zi
(6) Where,
T
i is the ith training input to the neuron and f'isthe derivative of the sig mo id function. For each neuron on the hidden layer, the error,
yi is1
( )
L
yi yi zi yz
i
f I w
(7) ParametersModeling Variables
Validation Variables Low High Low High
Power (Watt) 1330 1730 1320 1740
Cutting speed
(mm/min) 1600 2000 1500 2100
Where, the L is number of neurons in the output layer.
V. NET WORK TRAINING AND TEST ING AND VALIDAT ION
Goa l of the training process is to find the sets of weight values that can match the designed network output with the actual target values. Connections between the neurons which are ca lled weights were randomized to initia lize network we ights before training to avoid sigmoid saturation problem that causes slow train ing. In this project, the synaptic weights were init ially selected at random of 0.5 and below. Once a neural network has been exposed to the training, and learn the data pattern and trend from the loaded data sets, it can then be applied to new test data sets to study the predicting capability. For validation, the ANN was subjected to input patterns unseen during training, and introduces an adjustment to ma ke the system more re liab le and robust and a typical fitt ing criterion has been introduced to e mphasis the model validity. Such criterion may be mean absolute error (MA E) and mean absolute relative error (MARE) wh ich was calcu lated between the target and the network output. The standard error measure ment method used in the project pe rformance model develop ment was Root Mean Square Error (RMSE) Method. If the output and error contributed fro m both experiment and model (new data trained) is small, so the architecture will be considered as the best network. Back-propagation network is the most popular type where, it can be applied to a lmost all applications in the manufacturing domain [14]. For the surface roughness analysis, total number o f e ight models had been developed based on different tra ining algorith ms to finalized best fir Ra predictive model.
The best selected model is tested for e xtrapolat ion ability where the input machining variables are increased accordingly and the responses generated are validated e xperimentally. The machin ing variab les we re stretched up to 20% fro m its origina l values to see the model robustness in predict ing the e xperimental output. The new inputs were 4 bar and 8 bar for gas pressure, 2100 and 1500 for powe r and 1320 and 1740 for cutting speed. This was done to investigate whether the developed ANN mode l is capable of producing the best network performance with higher degree of prediction accuracy even with new interpolate and extrapolate ranges of the trained values.
VI. RESULT AND DISCUSSIONS
A. Modeling
The best ANN architecture was selected based on the heuristic search and the selected intuitively based on the best fitness value (1.446) with test error of 0.763, where the summary of the model networks developed based on the data live tra ining line model networks a re shown in Tab le II, where the selected architecture was 3-8-1 with highest RMS value which is 0.985 with yielded lowest test error and highest RMS value.
TABLE II
Summarized statistics of trained and tested architectures, 3-8-1 was finally selected
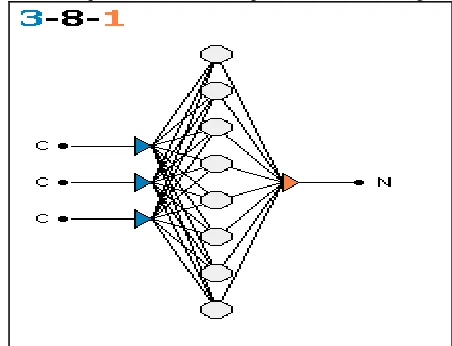
The best fit developed model is found to be 3-8-1 architecture with optimized variables as shown in Fig. 3 with 3 input layers, 1 hidden layer with 8 neurons and 1 output layer. The entire data sets was trained and tested based on the Dither Randomization approach. The Quic k back propagation coefficient was 1.75 with the learning rate of 0.1 for 500 iterations. The output error method was based on sum-of-square and for the output activation was logistic.
Fig. 3. T he optimized and best fit 3-8-1 model architecture
The training was done with the speed of 834, 999 967 itr/sec. In precise, the result shown by the network can be considered as very much pro mising with the predict ion error below 10% and found to be highly capable of predicting Ra values with best fitting values .
TABLE III
Observed and 3-8-1 model estimated Ra Values
mach ining variables used in experimentation. They we re conducted with two levels to study the statistical variances. Fro m the pred iction, the model is found to be very stable and able to capture and learn the behavior of the trained data sets.
Fig. 4 shows the plot of observed and estimated Ra va lues. It indicates that predictive model was able to trac k the trained pattern and estimates the Ra va lues very much closer to the observed numeric . The scatter of predicted values was also found to be statistically balance with values being on both lower and higher sides of the observed values proving good correlations between the variables, observed and prediction values.
Fig. 4. Actual versus model estimated Ra plot
B. Experimental Validation
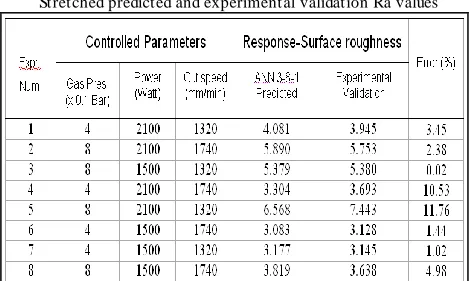
In modeling, the predictions made within the range of e xperimental values are common. But, here, the e xperimental va lues were stretched 20% up down fro m the original values to see if the model is able to predict to its best accuracy. Once the values were stretched, they were tested with 3-8-1 model to predict Ra values. Then, the same stretched experimental va lues were used on laser mach ine to conduct validation experiment. Once they are cut, the validated Ra were observed and compared to the model predict ions. The nume ric of the stretched predicted and experimental validations are tabulated in Table IV.
TABLE IV
Stretched predicted and experimental validation Ra values
Fro m the values in Table IV, it can be clea rly seen that the e xperimental values for gas pressure, power and cutting speed has been stretched as compared to original mach ining
conditions. Colu mn 5 fro m left shows the predictions of 3-8-1 model with the new setting of machin ing conditions (20% stretched values). Where else, nu merica l in co lu mn 6 a re the e xperimentally validated Ra values. The validation results yielded to an e xce llent degree of accuracy reaching above 88 % agree ing well with common mode ling validation standard.
ANN 3-8-1 Model Predicted vs. Experimental Validation
0 1 2 3 4 5 6 7 8
1 2 3 4 5 6 7 8
Experiment Number
S
urf
a
c
e
R
ou
gh
ne
s
s
(
m
ic
ron
)
ANN 3-8-1 Model Predicted Experimentally Validated
Fig. 5. Histogram of Ra values for stretch predicted versus experimental validation
The histogram p lot as shown in Fig. 4 proves the strong relationship of the stretched predicted and experimental validation values. The highest error was recorded for 5th validation was 12% where, high level of gas pressure and power with low level of cutting speed was employed. On the other hand, the validation results also witness the statistically stable corre lation between the m with ba lanced negative and positive variations proving ANN’s ab ility in producing adequate surface roughness predictive model.
VII. CONCLUSIONS
The response of laser machin ing phenomenon has been modeled using Artificia l Neura l Net work (ANN) to predict surface roughness. The best out of eight evaluated mu ltilayer back-propagation neural network model was 3-8-1 architecture with three inputs, eight hidden nodes and one singleton output. This findings has enabled the development of sound predictive model with an accuracy reaching a lmost 90%. The train ing of 3 layer back propagation network was carried out on the data generated from e xperimental job , while the validation was done using 20% stretched values. Highest error in the predictive mode l was only 9 % . As for the e xperimental va lidation, the recorded error was belo w 12 percent which falls within acceptable range of mode ling standards. ANN predict ive modeling technique not only saves a lot of materia ls wastage and cost to the manufacturing industry, instead, it helps to reduce downtime by providing off-hand prediction values before they were cut in actual. The mode l is currently being evaluated by Kara Power Pte. Ltd to estimate the cut quality of MnMo pressure vessel metal plates to ensure good weld ing jo ins are met in producing pressure vessels .
ACKNOLEDGEM ENT
(Malaysia) for sponsoring the entire research project including work materials and equipments. The authors would also like to e xpress their sincere thanks and gratitude to the Management of Manufacturing Engineering Faculty , Universiti Teknikal Malaysia Melaka.
REFERENCES
[1] E. Nagels, et al., ―The influence of sulphur content on the quality of laser cutting of steel‖ Material Process Technology, vol. 194, pp. 159–62, 2007.
[2] C. Karatas, et al., ― Laser Cutting Of Steel Sheets: Influence of Workpiece Thickness And Beam Waist Position On The Kerf Width And Strain Formation‖, Material Process Technology, vol. 172, pp. 22–9, 2006.
[3] Y. Arata, et al., ―Dynamic Behaviour in Laser Gas Cutting of Mild Steel,‖ Trans. JWRI, pp. 15-26, 1979.
[4] H.G. Salem, et al., ― Nd:YAG Laser Cutting Of Ultra Low Carbon Steel Thin Sheets Using O2 Assist Gas‖ Material Process Technology, vol. 196, pp. 64–72, 2008.
[5] L.M. Yu, ―Three-Dimensional Finite Element Modeling of Laser Cutting‖ Material Process Technology, vol. 63, pp. 637–639, 1997. [6] Kuo, R. J., ―Intelligent tool wear system through artificial neural
networks and fuzzy modeling‖, Journal of Artificial Intelligence in Engineering, Vol. 5, pp. 229 – 242, 1988.
[7] G.A. Stark, ―Modeling Of Surface Texture in the Peripheral Milling Process, Using Neural Network, Spline, and Fractal Methods with Evidence of Chaos‖ Trans. of the ASME, Manufacturing Science Engineering, vol. 121, pp. 251–256, 1999.
[8] K.A. Osman, et al., ―Monitoring of Resistance Spot-Welding Using Multi- Layer Perceptrons‖ International Journal of Advanced Manufacturing Technology, Vol. 12, pp. 67–73, 1994.
[9] J.H. Lee, et al., ―Application of Neural Network Flank Wear Prediction‖, Journal of Mechanical System and Signal Processing, Vol. 10, pp. 265-276, 1996.
[10] W. Hao, et al., ―Prediction of Cutting Force for Self-Propelled Rotary Tool Using Artificial Neural Networks‖, Journal of Material Processing Technology, Vol. 180, pp. 23-29, 2006.
[11] D. Umbrello, et al., ― An ANN Approach for Predicting Subsurface Residual Stresses and the Desired Cutting Conditions during Hard T urning‖, Journal of Materials Processing Technology, Vol. 189, pp. 143-152, 2007.
[12] E.O. Ezugwu, et al., ―Tool-wear Prediction Using Artificial Neural Networks. InternationalJournal of Materials Processing Technology, Vol 49, pp. 255-264, 1995.
[13] Abu-Mahfouz, ―Drilling Wear Detection and Classification Using Vibration Signals and Artificial Neural Network‖, Journal of Machine Tools and Manufacture, Vol. 43, pp. 707-720, 2003. [14] F. Basem, etal., ―Neural network modeling and analysis of the