Page 362 www.ijiras.com | Email: [email protected]
Relationship Analysis Of Vegetation Cover And Rainfall Over
Ghana Based On Their Spatio-Temporal Variability
Ebenezer Tetteh Domaley
Edward Mathew Osei JNR
Samual Ato Andam Akorful
Lily Lisa Yevugah
Department of Geomatic Engineering, Kwame Nkrumah University of Science & Technology, Kumasi, Ghana
I. INTRODUCTION
The Normalized Difference Vegetation Index (NDVI) is a fractional indicator that quantifies vegetation by means of measuring the difference between the wavelength strongly reflected by vegetation (near-infrared) and the wavelength highly absorbed by vegetation (red) (Brown 2015; Didan et al, 2015). When harnessed, it can analyse remote sensing measurements and to assess whether or not the object (material) under observation contains live green vegetation.
NDVI is a highly versatile indicator found in a wide field of applications. In the field of crop yield assessment, it has
been used by Ban et al, (2017) to forecast regional corn yields, performance of pasture, and rangeland containment capacities and many more (Zewdie et al, 2017). NDVI is most often directly related to other surface parameters such as percentage of vegetation cover, photosynthetic activity of plants, rainfall, leaf area index, the amount of biomass and in some cases soil moisture content (Didan et al, 2015).
NDVI values when averaged over a certain time interval, establishes a "normal" growing condition in a region for a given time of year (Ban et al, 2017). According to Brown (2015), advance monitoring and assessment can then distinguish the health of vegetation in that place relative to the
Page 363 www.ijiras.com | Email: [email protected] norm. When analyzed through time, NDVI can be used as an
indicator to show where vegetation is striving well and where vegetation is not, as well as changes in vegetation cover or type due to human activities such as deforestation, life stock grazing, natural obstructions such as wild fires, or changes in plants' phenological stage (Brown 2015).
On the basis that, the spectral behaviour of foliage, soil, rocks and mineral components across the electromagnetic spectrum are known, it is then possible to obtain NDVI information by placing emphasis on the near-infrared (NIR) and red (R) bands of the sensor (Lillesand et al 2004). Therefore, the magnitude of the difference between the near-infrared and the red reflectance, then determines the amount of vegetation. Vegetation is one of the key constituent of the global ecosystem, in the sense that, it maintains balance in the ecosystem by way of its ability to retain water, aid atmospheric circulation and maintain terrestrial soil stability (Leilei et al, 2014). Monitoring and mapping of vegetation are therefore very crucial for various modelling applications in such fields as; agro-ecosystem, climatology, crop yield and vegetation health.
According to Michaelides et al, (2009), Rainfall is widely recognized as one of the fundamental component of the global water cycle. Its‟ direct significance to the sustenance of human lives is obvious, as it is the primary source of drinking water. The agricultural sector in all parts of the world is probably one of the most sensitive to rainfall. Extreme events associated with various forms of precipitation, such as floods or droughts due to abundance or scarcity of rainfall, respectively, can have detrimental effects on a regional, national and global scales. As a result, an in-depth assessment of the relationship between rainfall and vegetation is very imperative at the regional to global level.
In Ghana, it is known that the onset of rainfall is followed by vegetation greenness, however the exact relationship between rainfall and vegetation cover have not received much attention. This research seeks to relate the response of vegetation greenness to rainfall and to assess their relationship by means of time series analysis and correlation analysis. The study will take a step further to analyze the spatiotemporal distribution of rainfall and vegetation. A study focused on the relationship between Vegetation Cover and Rainfall over Ghana, would be of great significance to continental ecological changes. The research will help farmers and agro-meteorologist to appreciate the temporal and spatial dynamics of rainfall and its effect on vegetation for proper planning towards ensuring food security.
II. MATERIALS AND METHOD
A. STUDY AREA
Figure 1: Map of Study Area (Ghana)
Ghana is found in the western part of Africa, along the Gulf of Guinea, between latitudes 4°44‟12.2” N and 11°10‟23.9” N and longitudes 1°11'30.4” E and 3°15'19.5” W, with an approximate land surface area of 239,460 square kilometers (World Book Encyclopedia, 2000; AQUASTAT Survey, 2005).
Ghana has a tropical climate with two rainy seasons spanning from March to July and from September to October. The Northern part of Ghana has one wet season which spans from June to October (World Book Encyclopedia, 2000; AQUASTAT Survey, 2005).
There are quite a wide range of vegetation types in Ghana. The major types being:
Strand and Mangrove; found along the coast or lagoons.
Moist semi-deciduous; forest found in the southern part of
Ghana
Sudan savannah; found in the northern part of Ghana
Guinea savannah; found in the transition zone of Ghana
Tropical rain forest; found in the south-western part of Ghana.
Coastal savannah and Shrubs found in the south-eastern
coastal plains of Ghana.
B. BRIEF DESCRIPTION OF DATA
Data acquired for this study are;
MOD13C2: this is a version six MODIS Vegetation Indices data product obtained from the United States Geological Survey (USGS) website at a special 0.05 Degree spatial resolution and at monthly temporal resolution. MOD13C2 produced on a Climate Modelling Grid (CMG) and is a stage three validated data product (Didan, 2015). The data has a global coverage.
Page 364 www.ijiras.com | Email: [email protected]
a. PRELIMINARY DATA PREPARATION
MOD13C2, obtained in hierarchical data format (. hdf) was imported into ERDAS Imagine and converted into imagine (.img) format. Area of Interest (for Ghana and all ten regions) were then clipped from the global dataset. The resulting raster was multiplied with the scale factor 0.0001 to convert from digital numbers into reflectance values ranging from -0.3 to 1.0 by use of a model I designed using the modelling tool in ERDAS Imagine.
The resulting raster was declared as „float‟ (this is to
make raster arithmetic possible). The conversion from digital numbers to NDVI values was done.
The CHIRPS rainfall data was also imported into ERDAS Imagine and converted from tagged image file (.tif) format into imagine (.img) format. The Areas of Interest (AOI) for Ghana and all ten regions were then clipped form the global dataset. The resulting raster was then declared as float to allow for raster arithmetic to be performed.
C. DATA ANALYSIS
a. TIME SERIES ANALYSIS
Data for time series analysis was extracted from individual raster files of all 132 months (of the study period) for Rainfall and Vegetation Cover, at both the national and regional level. These data were then fed into Microsoft Excel spread sheet and subsequently plotted. Times series plots were produced for the entire study area (Ghana) and all ten regions of the country.
b. TEMPORAL CORRELATION ANALYSIS
Data extracted for the time series analysis was again used to perform the temporal correlation analysis using Microsoft Excel to obtain correlation plots at both national and regional level.
c. SPATIAL CORRELATION ANALYSIS
Data for spatial correlation was obtained by layer-stacking the various raster datasets into the following categories;
Monthly (from 2005 to 2015) e.g. Jan-2005, Jan-2006, Jan-2007 through to Jan-2015, then Feb-2005, Feb-2006, Feb-2007 through to Feb-2015 etc.
Yearly (from 2005 to 2015) e.g. (Jan to Dec 2005), (Jan to Dec 2006), (Jan to Dec 2007) through to (Jan to Dec 2015).
From January 2005 to December 2015
These data were then analyzed using Matlab to obtain spatial correlation maps for the respective times.
III. RESULTS AND DISCUSSIONS
A. SPATIAL DISTRIBUTION OF RAINFALL AND VEGETATION
Sector Jan Feb Mar Apr May Jun Jul Aug Sep Oct Nov Dec
South North
No Rain
Table 1: Rainfall months in Northern and Southern Ghana
Table 1 gives a brief break-down of the annual rainfall pattern in Ghana. It shows a dual rainy season in the southern part of the country, spanning from March to July with a brief break in August then followed by another season from September to October. The northern part of Ghana experiences only one rainy season lasting from June to October.
(a)
(b)
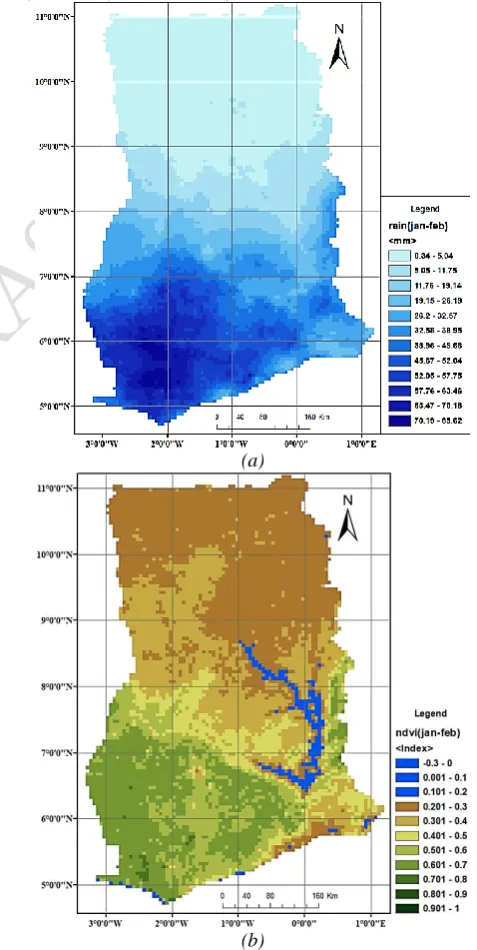
Page 365 www.ijiras.com | Email: [email protected] In a year, Ghana experiences two dry seasons, they are;
January-February and November-December seasons. Figure 2
represents the January-December season, where very low rainfall values are recorded all through the country. The south-western part of Ghana, during this time of the year, records the highest mean rainfall value ranging between 45mm and 85mm and NDVI values ranging between 0.51 and 0.75 as depicted by Figure 2 (a) and (b).
The middle portion (the transition zone) of the country records mid average rainfall values (11mm to 38mm) and low NDVI values (0.30 and 0.50) because of loss of foliage due to lack of rain. The northern part of Ghana during this time record almost no rainfall and loss most green vegetation. The recorded NDVI values during the months of January and February in the northern part of Ghana is around 0.20 to 0.3.
(a)
(b)
Figure 3: Spatial distribution of Rainfall (a) and Vegetation (b) for Ghana for March-April-May season
By March every year, rainfall starts in the middle and southern portions of the country as the northern portions awaits their share of rain. The Southern portions at the time (from March to May as depicted by Figure 3) records between 100mm to 240mm of mean rainfall (with the south-western part recording the highest mean rainfall values) and between 0.60 and 0.90 in NDVI values. Northern Ghana around these times records between 45mm to 90mm of mean rainfall and NDVI values ranging between 0.20 and 0.501. the lowest NDVI recorded at this time of the year is around the Upper East region.
(a)
(b)
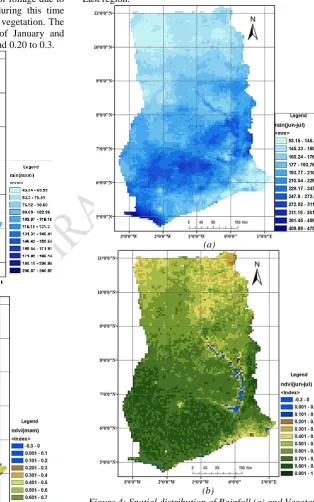
Figure 4: Spatial distribution of Rainfall (a) and Vegetation (b) for Ghana for June-July season
Consulting Table 3.1, reveals that, by June-July and September-October every year, it is raining all through Ghana.
Page 366 www.ijiras.com | Email: [email protected] Mean rainfall is high all through the country with the lowest
mean value of about 93mm recorded in the northern part of the country. The southern portion at this time doubles (475mm) the amount of rainfall recorded in the March-April-May season. NDVI values recorded in this time of the year is high. The southern portions records between 0.70 to 0.9 NDVI values and the northern portions records between 0.21 and 0.7.
(a)
(b)
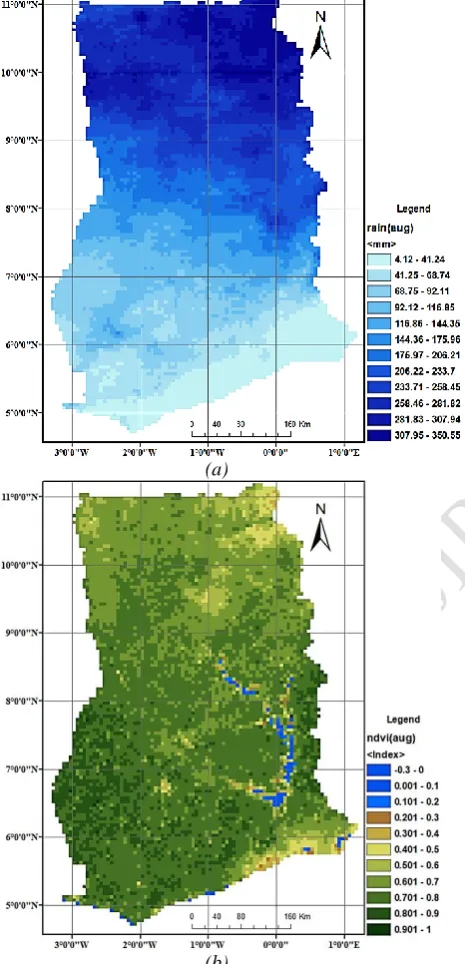
Figure 5: Spatial distribution of Rainfall (a) and Vegetation (b) for Ghana for August
By August every year, rainfall subsides in the southern parts of the country is reaches its peak in the northern parts of the country. The northern part of Ghana in the month of August records the highest mean rainfall of about 350mm whereas the coastal areas record mean rainfall range between 4mm and 41mm. However, by the month of August NDVI values are very high and greenness is very evident as demonstrated by Figure 5.
(a)
(b)
Figure 6: Spatial distribution of Rainfall (a) and Vegetation (b) for Ghana for September-October season
Page 367 www.ijiras.com | Email: [email protected]
(a)
(b)
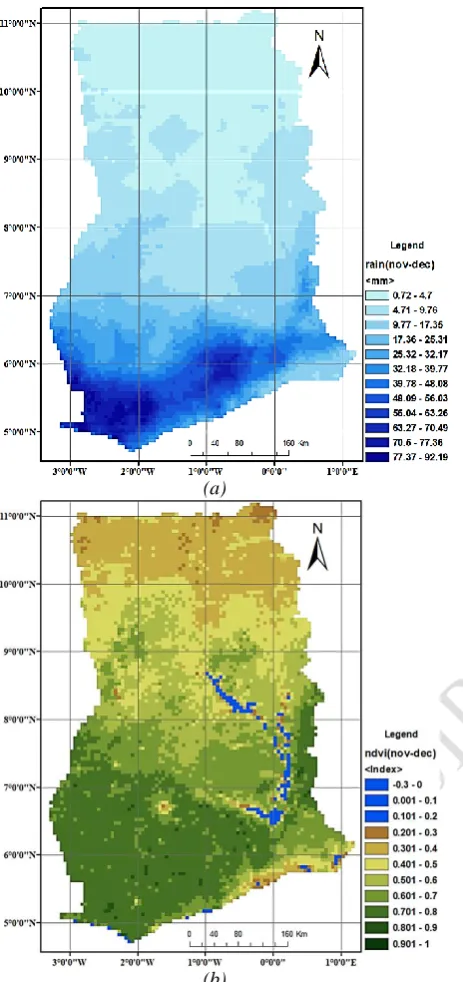
Figure 7: Spatial distribution of Rainfall (a) and Vegetation (b) for Ghana for November-December season
By November every year, the rains have ceased, and another dry-season is being introduced. As a results trees lose their leaves to reduce water loss through evapotranspiration, and grasslands give way to bare grounds. This leads to the evidence of bare grounds in the northern part of Ghana and low vegetation in the southern part of Ghana as shown in
Figure 7(b). Therefore, NDVI values are low with the
northern part dropping from about 0.60 in September-October to 0.30 in November-December. Mean rainfall in the northern parts of Ghana records a drastic drop from about 60mm (in September-October) to almost zero (in November-December).
B. TIME SERIES ANALYSIS
To better understand the temporal relationship between rainfall and vegetation, time series analysis was performed for Ghana on both national and regional level, from January 2005 to December 2015.
Figure 8: Time series Plot of Rainfall and Vegetation for Ghana (2005 to 2015)
Figure 8 shows the temporal distribution of Rainfall and Vegetation over Ghana from January 2005 to December 2015. Generally, a positive response of vegetation greenness to rainfall was demonstrated for Ghana as a whole. From Figure 8, the seasonality of both rainfall and vegetation (NDVI) is very evident. The highest mean NDVI value for any year is recorded between August and September whereas the lowest mean NDVI values are recorded between January and February. The seasonality of vegetation is such that, it is at its lowest in around January and February and increases steadily to its highest mean value around August and the steadily reduces to it lowest value in December (of that year) and January of the following year.
Figure 8 portrays the seasonality of rainfall in an
interesting manner. The bimodal seasonality of rainfall is demonstrated by a crest around June, followed by a „shallow‟
trough in August and another crest around September and October and the finally a deep trough in December. The „shallow‟ trough on the graph around August represents the
brief reduction in rainfall in the southern part of the country. The conspicuousness of the „shallow‟ trough around August is
dependent on the amount of rainfall recorded in the northern part of the country. This is because in August it is still raining in the north, so a high rainfall will compensate for the deficit in the south thereby making the trough around August very shallow or completely absent.
The very deep troughs found around December and January of the following year is evidence of the end of the yearly rainy season.
Figure 9: Time series Plot of Rainfall and Vegetation for Northern Ghana
Page 368 www.ijiras.com | Email: [email protected] (unimodal) rainy season that start from June and lasts till
October (World Book Encyclopedia, 1999; AQUASTAT Survey, 2005). Therefore the „double-crest‟ observed in the Figure 8 and Figure 10 is absent. By intuition, it could be seen that the vegetation plot and the rainfall plot follow the same pattern son. It can also be noted that the vegetation plot slightly lags the rainfall plot. It was again observed that, the highest mean readings for rainfall is recorded in the month of August whereas that for vegetation was recorded between the later part of August and September.
Figure 10: Time series Plot of Rainfall and Vegetation in the middle and Southern portions of Ghana
Figure 10 represents the temporal variability plot of
Rainfall and Vegetation for the southern parts of Ghana. The dual seasonality of rainfall is evident in the double-crests separated by a very shallow trough in August in the plots. Just as in the case of Figure 9, high rainfall corresponds to high NDVI values. The crests (representing the highest mean rainfall) were recorded in June-July and September-October seasons whereas the „shallow‟ troughs (representing the pause in rain) were recorded in August. The deep troughs were recorded around December and January.
C. SPATIAL CORRELATION ANALYSIS
(a)
(b)
(c)
Figure 11: Yearly spatial correlation between Rainfall and Vegetation for 2005 (a), 2010 (b) and 2015 (c)
The annual spatial correlation analysis produced results suggesting very high positive correlation between rainfall and vegetation in the northern part of Ghana. The northern part of the country recorded correlation coefficients between 0.6 and 0.8. This relationship between Rainfall and Vegetation is evident throughout the study period (from 2005 to 2015) as represented in Figure 11 a, b and c. This strong positive correlation between rainfall and vegetation in the northern part of Ghana can be attributed to the dominant savannah vegetation found in that part of the country. The savannah vegetation is highly responsive to water (rainfall), therefore considering that part of the country as an arid region, vegetation greenness is greatly dependent on water (rainfall).
Page 369 www.ijiras.com | Email: [email protected] region demonstrated a rather weak correlation between rainfall
and vegetation. This revelation was attributed to the fact that, the tropical rain forest found in this part of the country possess the ability to maintain soil moisture all year round because of their broad leaves that form very thick tree-canopies. Because of this, vegetation greenness is greatly maintained even in the absence of rainfall, so even when the rains finally pour down, the vegetation greenness does not change much. Hence the not so strong positive correlation.
Jan - Feb
Mar-Apr-May
Jun-Jul
August
Page 370 www.ijiras.com | Email: [email protected]
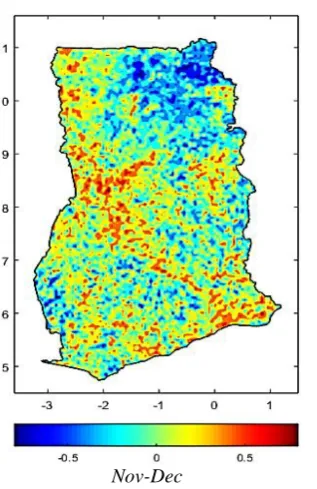
Nov-Dec
Figure 12: Seasonal spatial correlation plots between Rainfall and Vegetation (from 2005 to 2015)
Figure 12 represents the monthly spatial correlation between Rainfall and Vegetation throughout Ghana. The results demonstrated that;
During the Jan-Feb season (dry-season), correlation co-efficient records the highest value of about 0.5 around the southern part of the country and some portions of the northern region of Ghana. The north-western parts of the country at this time records between -0.5 to 0 in correlation co-efficients.
The Mar-Apr-May season, rainfall have started in the
southern and mid portions of Ghana. However, areas spanning from the south-eastern corner of the country through parts of the middle portions and around the Volta Lake, up to the north-eastern corner of the country demonstrate a negative correlation between -0.2 to -0.65. The negative correlation displayed around the Volta Lake is attribute to soil moisture in the area (due to the lake). The south-western corner of the country during this season, recorded a correlation between 0.1 to 0.7.
In the June-July season (rainy season throughout the country) every year throughout the study period, the northern part of Ghana recorded the highest positive correlation co-efficient of the range 0.5 to 0.7 and some parts of the middle portion of the country recorded correlation co-efficients about 0.50.
In the month of August, rainfall have subsided in the south and have reached its peak in the northern part of Ghana. Therefore, high positive correlation (nearly +0.80) is recorded in the north as vegetation become very green due to the downpour of rain.
In the Sep-Oct season, northern Ghana demonstrated positive correlation with co-efficients ranging between 0.20 to 0.60 and same is recorded throughout the country. It is so because at this time of the year most parts of the country is green with healthy vegetation (Figure 6b) and rainfall is still evident (Figure 6a).
The Nov-Dec season, introduces any period of dryness in
through the country. This causes grassland to make way
for bare grounds, shrubs and other trees shed-off leaves in order to reduce water loss through evapotranspiration and vegetation greenness is greatly reduced as a result. At this time, the southwestern part of Ghana records between -0.2 to + 0.5 correlation co-efficients.
D. TEMPORAL Correlation Analysis
TEMPORAL CORRELATION CO-EFFICIENTS
REGION 2005 2006 2007 2008 2009 2010 2011 2012 2013 2014 2015
Ashanti 0.547 0.687 0.730 0.748 0.549 0.783 0.796 0.524 0.604 0.602 0.519
Brong -
Ahafo 0.713 0.773 0.782 0.892 0.659 0.822 0.863 0.592 0.771 0.791 0.750
Central 0.275 0.623 0.763 0.649 0.297 0.768 0.651 0.378 0.744 0.534 0.194
Eastern 0.439 0.635 0.710 0.832 0.358 0.742 0.753 0.504 0.631 0.651 0.423
Greater
Accra 0.450 0.652 0.674 0.736 0.193 0.562 0.557 0.522 0.579 0.745 0.371
Northern 0.781 0.829 0.735 0.882 0.767 0.823 0.814 0.806 0.867 0.797 0.704
Upper
East 0.809 0.815 0.767 0.750 0.825 0.779 0.794 0.802 0.808 0.845 0.725
Upper
West 0.899 0.810 0.661 0.802 0.781 0.736 0.822 0.837 0.779 0.811 0.760
Volta 0.718 0.748 0.732 0.848 0.870 0.710 0.782 0.660 0.787 0.700 0.602
Western 0.534 0.580 0.772 0.671 0.320 0.605 0.616 0.495 0.602 0.552 0.487
Table 2: Regional temporal correlation co-efficients for Rainfall and Vegetation
Table 2 shows the correlation between Rainfall and Vegetation over time. The highest temporal correlation co-efficient (0.899) was recorded by the Upper West in 2005 followed by Brong-Ahafo Region recording 0.892 in 2008. The lowest temporal correlation co-efficient of 0.194 was recorded by the Central Region in the year 2015.
On the average, the lowest correlation co-efficients of 0.534, 0.549 and 0.567 was recorded by Central region, Greater Accra region and Western region respectively throughout the study period. Brong-Ahafo region, Ashanti region and Volta region, recorded average correlation co-efficients of 0.764, 0.644 and 074 respectively. The Northern, Upper East and Upper West region respectively recorded average correlation co-efficients of 0.801, 0.793 and 0.791.
IV. CONCLUSIONS
On the objective of examining the relationships between Vegetation Cover and Rainfall, it was observed that;
Vegetation and Rainfall correlated positively throughout Ghana with the strongest positive correlation recorded in northern Ghana. This strong positive correlation between Rainfall and Vegetation recorded in the north was attributed to the fact that the vegetation in northern Ghana is predominantly savannah. The savannah vegetation strives well with the availability of water and is therefore highly responsive to changes in rainfall.
Page 371 www.ijiras.com | Email: [email protected] form very thick tree canopies (all year round) which
maintain soil moisture all year round thereby maintaining greenness all through the year. This reduces the reliance on rainfall for vegetation greenness, hence the not so strong positive correlation in the area.
From the time series analysis, it was observed that, in Ghana vegetation growth and vegetation greenness is dependent on rainfall.
REFERENCES
[1] AQUASTAT survey (2005). Irrigation in Africa in Figures. www.fao.org/GHA/GHA_CP_eng
[2] Ban, H. Y., Kim, K. S., Park, N. W., and Lee, B.W. (2017). Using MODIS Data to Predict Regional Corn Yields. REMOTE SENSING, 9(1), 16. doi: 10.3390/rs9010016
[3] Brown J. F. (2015) https://phenology.cr.usgs.gov/ndvi_ foundation.php [Accessed March, 2017]
[4] Didan, K. (2015). MOD13C2 MODIS/Terra Vegetation Indices Monthly L3 Global 0.05Deg CMG V006 [Data set]. NASA EOSDIS LPDAAC. doi.10.5067/MODIS/ MOD13C2.006
[5] Didan, K., Munoz, A. B., Ramon and Huete, S. A. (2015). MODIS Vegetation Index User‟s Guide.: Carlifonia [6] Funk, C., Peterson P., Landsfeld M., Pedreros D., Verdin
J., Shukla S., Husak G., Rowland J., Harrison L., Hoell A.
and Michaelsen J. (2015). The climate hazards infrared precipitation with stations—a new environmental record for monitoring extremes. Scientific Data volume 2,
Article number: 150066 (2015)
doi:10.1038/sdata.2015.66.
[7] Leilei L., Jianrong F. and Yang C. (2014). The relationship analysis of vegetation cover, rainfall and land surface temperature based on remote sensing in Tibet, China. Conf. Ser.: Earth Environ. Sci. 17 012034. http://iopscience.iop.org/1755-1315/17/1/012034.
[8] Lillesand, T. M., Kiefer, R. W. and Chipman, J. W. (2004). Remote Sensing and Image Interpretation (5th edition). U.S.A.: John Wiley & Sons, Inc.
[9] Michaelides, S., Levizzani, V., Anagnostou, E., Baner, P., Kasparis, T., and Lane, J. E. (2009). Precipitation: Measurement, remote sensing, climatology and modelling. Atmospheric Research 94 pp512-533. doi:10.1016/j.atmosres.2009.08.017.
[10] World Book Encyclopedia, Millennium 2000 standard edition, 1999. “Ghana”
[11] World Book Encyclopedia, Millennium 2000 standard edition, 1999. “Climate”
[12] Zewdie, W; Csaplovics, E; Inostroza, L (2017). Monitoring ecosystem dynamics in northwestern Ethiopia using NDVI and climate variables to assess long term trends in dryland vegetation variability. APPLIED
GEOGRAPHY, 79, 167-178.