(UDC: 616.12-008.318-073:519.673)
Finite element modeling of the endocardial radiofrequency ablation
M. Obradović1,2, A. Avilla4, A. Thiagalingam4 and N. Filipović1,2,3*
1 Faculty of Mechanical Engineering, University of Kragujevac, 34000 Kragujevac, Serbia [email protected]
2 Bioengineering Research and Development Center, BioIRC, 34000 Kragujevac, Serbia [email protected]
3 Harvard School of Public Health, Harvard University, 02115 Boston, USA [email protected]
4 MGH, Harvard University, 02115 Boston, USA [email protected]
*Corresponding author
Abstract
In this study a three-dimensional finite element model for endocardial radiofrequency ablation is presented. We investigated temperature distribution through the heart during ablation for three cases: 1) when blood flow through the coronary artery exists, 2) when the blood flow through the coronary artery is zero, and 3) when there is no blood in the coronary artery (we modeled air zero flow in the coronary artery). The effects of parameters, such as blood flow rate and applied power (voltage on the electrode) are investigated. It is shown that blood flow in the coronary artery does not have significant influence on the temperature distribution. Also we found that desirable temperature distribution ranges between 50° and 100˚ C can be achieved for the applied constant voltage of 15V.
Key words: Arrhythmia, Radiofrequency endocardial ablation, Joule heating, Finite element.method
1. Introduction
The radiofrequency ablation becomes very popular method as preferred alternative to the drug therapy for treating certain supraventricular arrhythmias. Several groups were investigating this technique as a cure for the ventricular tachycardia (Panescu 1997) and the atrial fibrillation (McRury et al. 1997).
The heart ablation can be performed on the endocarium or on the epicardium. The epicardial ablation can be performed on a beating or stopped heart. The epicardial ablation permits clear view of ablating area and it avoids electrode – blood contact, unlike endocardial ablation. On the other hand, the epicardial ablation has an invasive nature.
heating of the damaged cells is applied. Below damaging zone other cells overtake function in conduction of the electrical impulses. The heart receives a regular electrical pathway and it works properly from SA node - to AV node – to Purkinje cells pathway. Myocardium becomes nonviable at 50° C, and it is necessary to reach temperature over 50° C to destroy damaged cells, but not over 100° C, because of patient safety (Gopalakrishnan 2002).
Fig. 1. The pathways for insertion ncatheter inside the heart
The fixed applied voltage on the electrode is prescribed as Dirichlet boundary condition (Jain and Wolf 2000). Also the current with a frequency between 300 kHz and 1 MHz can be applied between the catheter electrode and a dispersive electrode attached to the patient’s skin (Cao et al. 2000). In this study we applied a constant voltage value on the electrode as Dirichlet boundary condition.
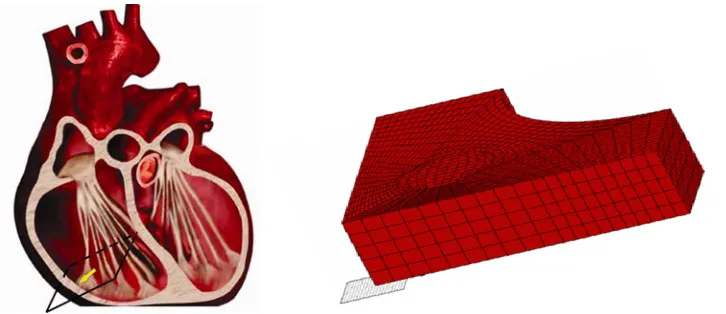
Our model was developed using Finite Element Method (FEM). We modeled part of the endocardium on the right side of the heart, in the right heart chamber area (Figure 2). The model includes the coronary artery (we used average value for diameter - 3mm). Finite element mesh of the model is shown in Figure 3.
In this study we firstly described the methods used for simulation of the endocardial ablation on the marked region of the right heart chamber with the basic theoretical consideration. Then the method for generating Finite Element Model, including prescribed boundary conditions is described. In the next section results for the temperature field distribution of all three investigated cases with the various applied electrode voltage and blood flow rates are shown. Finally, conclusions of this research are given.
2. Methods
2.1 Governing equations
Our mathematical model is based on the principles of Joule heating and the approximation of quasistatic electrical field generated by the electrode..
According to Joule heating principle the temperature T (x, y, z, t) satisfy the equation:
) +
-T
ρc (κ T σ φ φ ρcv T t
(1)
where κ is thermal conductivity,σ is electrical conductivity, c is the specific heat capacity, φ is electrical potential, v(x, y, z) is the blood velocity, and ρ is the mass density. The first term on the right side of the eq (1) represents the convective part. The second term denotes the influence of applied electrode voltage on generated temperature field. The last term in eq(1) represents the heat loss due to blood flow in the coronary artery.
On the other hand, the electrode generates electric field E(x, y, z), which can be approximated by E =φ, where φ satisfies the equation:
) = 0
(σ φ
(2)
Characteristics of material for blood, myocardium and air are given in Table 1
Table1. The material properties for blood, myocardium and air
2.2 Finite element modeling
In our simulation we used three-dimensional brick 8-node finite element. The three – dimensional flow of a viscous incompressible fluid is governed by the Navier-Stokes equation
2 2
p j
i i i
j
t xj xi x xj j x xj i
(3) ρ
(kg/mm3) (J/kg/°C) C (S/mm) σ (W/mm/°C) κ (kg/s/mm) μ Myocardium 1.2E-06 3.2E+09 6.1E-10 7.0E+02 0.0E+00
Blood 1.064E-06 3.66E+09 9.95E-10 4.9E+02 3.0E-06
where ρ is fluid density, υi is blood velocity in xi direction, p is pressure, μ is dynamic viscosity, and summation is assumed on the repeated indices, i,j=1,2,3. This equation represents balance of the linear momentum.
In the analysis we considered that convergence is reached when maximum absolute change in the non- dimensional velocity between respective times in two adjacent cycles is less than 10 -3.
The incremental-iterative form of the equations for the current time step of size Δt and equilibrium iteration ‘i’ is
1 +t+Δt i-1+t+Δt i-1+t+Δt i-1 Δt
i-1 i-1 i-1
t+Δt (i-1) c (t+Δt )+t+Δt t+Δt
i-1 t+Δt
t+Δt (i-1) (i)
Δ
t+Δt (i-1) (i) Δ t (i) Δ (i) Δ T
T T T
p
Mv Kvv Kμv Jvv Kvp 0 0
Kvp 0 0 0
J v 0 Kvv Kκ Kσ
0 0 0 Kσφ
F v v F p T φ
+Δt (i-1) t+Δt (i-1)
T F Fφ (4)
Index ‘t+Δt’ denotes that the quantities are evaluated at the end of time step. Matrix Mv is the mass matrix, Kvv, Jvv, KκT and JTv are the convective matrices, Kμv is the viscous matrix, KσTand
Kσφ are the matrices due to electrical potential and Fv, Fp, FT, and Fφ are the forcing vectors. To
reduce the number of unknowns we used a penalty formulation in our solver (Filipovic 1999). The incremental-iterative form of the equilibrium equations with penalty formulation (Filipovic and Kojic 2004, Kojic et al, 2008) which is applied in software PAK-F (Kojic et al. 1998) is:
t+Δt (i-1) t+Δt i-1
t+Δt i-1
i t+Δtˆ i-1
Δ
(i) t+Δtˆ (i-1)
Δ
(i) t+Δtˆ(i-1)
Δ
1 +t+Δt i-1+t+Δt i-1+t+Δtˆ i-1+t+Δt i-1+
Δt
i-1 i-1
t+Δt t+Δt
c ( )+
T 0 0
JTv KσT
0 0 Kσφ
v Fv
T FT
φ Fφ
Mv Kvv Kμv Kμv Jvv Kλv
Kvv Kκ
(5)
V V S ( i-1t+Δt ˆ μ dV,
λ dV,
i-1 i-1 i-1
t+Δt ˆ t+Δt t+Δtˆ t+Δt i-1+t+Δt i-1 t+Δtˆ i-1 t+Δt , t+Δt ˆ i-1 t+Δt i-1 t+Δt i-1 t+Δt i-1
λ dS,
iα
(i-1) t+Δt ˆ t+Δ
T T T + T T B S S
Kμv H H
Kλv H H
Fv R R Kvv Kμv Kμv Kλv v
R H v n v v n
F + ∇ ∇ ∇ V V V
t +Δt t +Δt t +Δt )
t +Δt
( )
i-1 i-1
i-1
(i-1) (i-1) (i-1)
t t+Δt t+Δt
i-1
(i-1) (i-1)
t+Δt ˆ t+Δt
ρ dV,
i-1 i-1
t+Δt ρ ( t+Δt ) dV,
i-1 i-1
t+Δt t+Δt ) dV,
i-1
t+Δt t+Δt
T T T T T ( c (
T T T
T
J v v Kκ T Kσ φ
Fφ Kσφ φ
Mv H H
Kvv H H v H
Jvv H H v H
J v H H T
∇ V V V V V V T i-1 ) dV, i-1
t+Δt dV,
i-1
t+Δt dV,
i-1 i-1
t+Δt ( t+Δt ) dV,
i-1
t+Δt dV,
t+Δt t+Δt dV,
i-1 i-1
i-1
t+Δt -t+Δt t+Δt dS,
S T T T T T T T T T σ φ σ B T T B S H
Kμv H H
Kκ κ H H
Kσ H H H
Kσφ H H
R H f
R H p n v n
∇ (6)
2.3 Boundary conditions
We assumed that the voltage from electrode has a constant value V at the location of damaged cells, and the voltage on the exterior side of myocardium is zero, which represents a dispersive electrode. The initial temperature of myocardium and blood is 37° C. For the case that blood flows through the coronary artery we used a constant value of velocity in the direction of z-axis vz=288 mm/s, which was used from experimental measurement in our previous investigation. The components of the blood velocity in x and y directions are equal to zero.
3. Results
We calculated temperature field for applied voltage of 60V, 30V, 15V, and 10V for all three cases to find the best results for the desired temperature.
Fig. 4. Maximum temperature distribution for the cases when blood flow is equal to zero (left side of figure) and when there is no blood in the coronary artery (right side of figure) for
applied voltage V=30V after 60s of the ablation process.
Fig. 5. Maximum temperature distribution for cases when blood flow is equal to zero (left side of figure) and when there is no blood in the coronary artery (right side of figure) for applied
voltage V=60V after 60s of the ablation process.
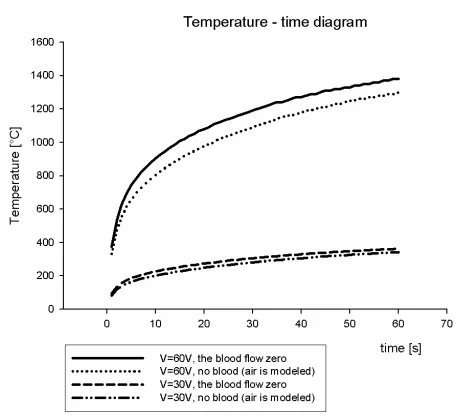
Fig. 6. Temperature versus time for applied voltage V=30V and V=60V
Maximum temperature distribution is a little higher than 50 °C (Figure 7) for applied voltage V=10V. That is good for the patient safety, but on the other hand the time of ablation is shorter – it needs 50s of the ablation process to reach the desired temperature over 50 °C.
Fig. 7. Maximum temperature distribution for case when blood flow is equal to zero (left side of figure) and when there is no blood in the coronary artery (right side of figure) for applied
voltage V=10V after 60s of the ablation process
Fig. 8. Maximum temperature for the cases when blood flow is equal to zero (left side of figure) and when there is no blood in the coronary artery (right side of figure) for applied voltage
V=15V after 60s of the ablation process.
The differences between cases when blood flow is normal through the coronary artery and when blood flow is zero, are small. Blood flow decreases temperature in the range of 0.1-0.01, which does not have a significant effect on the maximum temperature distribution. The results from computational simulations are given in Table 2:
contact electrode-
endocardium point inside the myocardium point inside the coronary artery time v=0mm/s v=288mm/s v=0mm/s v=288mm/s v=0mm/s v=288mm/s
1 23.4 23.4 20.9 20.9 0.635 0.634
2 33.2 33.3 26.4 26.4 2.02 2.02
3 39.1 39.2 28.7 28.7 3.93 3.93
4 43.2 43.3 30 30 6.08 6.08
5 46.4 46.5 30.9 30.9 8.26 8.26
6 49.1 49.2 31.5 31.5 10.4 10.3
7 51.4 51.5 31.9 31.9 12.3 12.3
8 53.4 53.6 32.3 32.3 14.1 14.1
9 55.3 55.4 32.6 32.6 15.7 15.7
10 57.1 57.2 32.9 32.9 17.2 17.2
11 58.8 58.9 33.1 33.1 18.5 18.5
12 60.4 60.5 33.3 33.3 19.8 19.8
13 61.9 62 33.5 33.5 20.9 20.9
14 63.4 63.5 33.6 33.6 21.9 21.9
15 64.9 65 33.8 33.8 22.9 22.8
Table 2. Differences in temperature distribution for the cases when blood flow is equal to zero and when blood flows with velocity of 288 mm/s through the coronary artery at characteristic
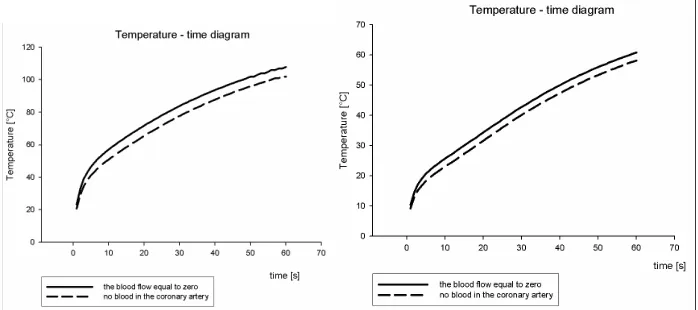
We considered the dependence temperature – time, because it determines duration of an ablation and it gives a critical time, which must not be exceeded because of patient safety. The critical time is time when temperature reaches 100° C. In figure 9 it is shown how temperature increases during the ablation on the contact electrode – endocardium, where the temperature reaches maximum value in the ablation process.
Fig. 9. Temperature distribution vs time for the applied voltage V=10V and V=15V respectively
It can be seen from figure 9 (left side) that at applied voltage V=10V there is about 45s for the ablation process to take an effect and start to destroy damaged cells. At applied voltage V=15V (figure 9 right side) it can be seen that after 6s for case when there is no blood flow and 9s for case when there is no blood in the coronary artery, temperature reaches 50 °C. So, we can ablate damaged cells until critical time is reached – 47s and 55s for the above mentioned cases, respectively. We obtained the best response at applied voltage V=15V with reasonable time for the ablation process at desired temperature distribution range of 50-100 °C.
4. Conclusions
In this study a three-dimensional finite element model of endocardial radiofrequency ablation is developed. Blood flow in the heart chamber and electrode are not modeled. Temperature distribution through the heart is calculated, and it is analyzed how temperature distribution depends on the electrode voltage and blood flow in the coronary artery. We concluded that temperature distribution increases as applied electrode voltage increases. Temperature rapidly reaches 100° C when voltage is high, which makes the ablation process shorter. Blood flow in the coronary artery has influence on the maximum temperature and on the time for the ablation process, but not so significantly. More significant effects can be reached if we pump out blood from the coronary artery. It can be concluded that the best temperature distribution was obtained for applied voltage of V=15V.
If we take into account blood flow in the heart chamber, we would probably obtain similar results for the maximum temperature, but for the higher applied electrode voltage, because the blood is cooling the electrode. This issue will be a subject of future investigation.
Извод
Моделирање
ендокардиалне
радиофреквентне
аблације
методом
коначних
елемената
Milica Obradovic1,2, Andre Avilla4, Aravinda Thiagalingam4 and Nenad Filipovic1,2,3*
1 Faculty of Mechanical Engineering, University of Kragujevac, 34000 Kragujevac, Serbia [email protected]
2 Bioengineering Research and Development Center, BioIRC, 34000 Kragujevac, Serbia [email protected]
3 Harvard School of Public Health, Harvard University, 02115 Boston, USA [email protected]
4 MGH, Harvard University, 02115 Boston, USA [email protected]
*Corresponding author
Резиме
У раду се представља тродимензионални модел коначнихелемената заендокардиалну радиофреквентну аблацију. Истраживали смо расподелу температуре у срцу за време аблацијезатрислучаја: 1) кадапостојикрвотокукоронарнојартерији, 2) каданепостоји струјање крви у коронарној артерији, и 3) када нема крви у коронарној артерији (моделирали смо ваздух без кретања у коронарној артерији). Истраживани су ефекти параметара, као што је брзина крвног тока и коришћена снага (волтажа на електоди). Показаноједакретањекрвиукоронарнојартеријинемазначајногутицајанарасподелу температуре. Такођесмоутврдилида пожељнидоменитемпературске рсподелеизмеђу 50° и 100˚Смогубитиоствареникоришћењемконстантневолтажеод 15V.
Кључнеречи: Аритмија, редиофреквентна ендокардиална аблација, Џуловозагревање,
методконачнихелемената
References
Cao, H. V. R. Vorperian, J. Z. Tsai, S. Tungjitkusolmun, E. J. Woo, J. G. Webster, “Temperature Measurement within Myocardium During In Vitro RF Catheter Ablation”, IEEE Transactions on Biomedical Engineering, Vol. 47, No. 11, Nov. 2000,
Filipovic N. and Kojic M. (2004), Computer simulations of blood flow with mass transport through the carotid artery bifurcation, Theoret. Appl. Mech. (Serbian), Vol. 31, No. 1, pp. 1-33
Filipovic N., 1999. Numerical Analysis of Coupled Problems: Deformable Body and Fluid Flow. Ph. D. Thesis, University of Kragujevac, Serbia,
Gopalakrishnan, J. “A Methematical Model for Irrigated Epicardial Radiofrequency Ablation”,
Jain, M.K. P. D. Wolf, “A Three – Dimensional Finite Element Model of Radiofrequency Ablation with Blood Flow and its Experimental Validation”, Annals of Biomedical Engineering, Vol. 28, pp. 1075-1084, 2000.
Kojic M, Filipovic N, Zivkovic M, Slavkovic R, Grujovic N (1998). PAK-F Finite Element Program for Laminar Flow of Incompressible Fluid and Heat Transfer. Faculty of Mech. Engrg, University of Kragujevac, Serbia.
Kojic M., Filipovic N., Stojanovic B., Kojic N., Computer Modelling in Bioengineering – Theoretical Background, Examples and Software, J. Wiley and Sons, 2008.
McRury, I.D., D. Panescu, M. A. Mitchell and D. E. Haines, “Nonuniform Heating During Radiofrequency Catheter Ablation with Long Electrodes Monitoring the Edge Effect”, Circulation, Vol. 96, pp. 4057-4064, Dec. 1997,