D. Prodanović*, M. Stanić2, N. Milivojević3, Z. Simić4, B. Stojanović5
Faculty of Civil Engineering, University of Belgrade, 73 Bulevar Kralja Aleksandra St., 11000 Belgrade, Serbia; e-mail: 1[email protected], 2[email protected]
Institute for Development of Water Resources “Jaroslav Černi”, 80 Jaroslava Černog St., 11226 Beli Potok, Serbia; e-mail: 3[email protected], 4[email protected] 5Faculty of Science, University of Kragujevac, 12 Radoja Domanovića St., 34000 Kragujevac,
Serbia; e-mail: [email protected]
*Corresponding author
Abstract
The particularity of “Vlasina” hydropower plants catchment is a big number of gravitation channels used to collect the water from neighboring natural catchments. The overall catchment size is thus increased, compared to the natural catchment. At the bifurcations where the gravitation channels with mild slope are intersecting the steep natural hydrographic network, the natural surface and subsurface water flows are significantly altered. The channel which intersects the river flow will hold the water at higher elevations, filling the storages or transferring the water to another catchment. Under such conditions, the concept of rainfall to runoff transformation in SWAT-based model had to be modified in a way that the channel does not capture all the water from the natural watercourse, but will allow a certain volume of water to run downstream, both for the surface and subsurface flow. New SWAT-related objects were introduced: HPN (hydro-profile on the natural watercourse), HPC (hydro-profile on the channel), HPI (hydro-profile on the channel, the intake) and HPS (storage hydro-profile). For each object the water balance and transformation equations were derived, adapting SWAT model to simulate the flow in the bifurcating network of natural streams and channels. The new model was calibrated on the catchment area of the “Vlasina” hydropower plants system. This paper presents the adaptations of the SWAT-based model and results of its application on the northern part of the system (catchments of the channels “Strvna” and “Čemernik”).
Keywords: Drainage channels, water bifurcation, SWAT model, surface and subsurface flows
1. Introduction
and serve as the system cold reserve. A modern hydro-information system was developed for the purpose of appropriate and timely decision-making related to the management of the “Vlasina HPPs” system. With the specifics of this system and the coupling of the power plants in mind special management methods were developed, as described in the paper Stojanović et al. (2009). System input is the inflow of water from the system catchment areas that was additionally expanded by the gravitational drainage channels that intersect natural watercourses of adjacent catchments. These channels transfer the water into the “Vlasina” catchment and provide additional water for hydropower purposes. The natural hydrographic network, coupled with channels, creates bifurcations on intersection points, i.e. the natural surface and subsurface water flows are significantly altered by the artificial drainage channels. By intersecting natural river flows and subsurface water flows, and by draining the water into the storage, water is kept at higher elevations and then transmitted from one catchment into another and used for filling the “Vlasina HPPs” storages.
For the purpose of successful modeling of water flow in the system, especially in terms of rainfall-runoff transformation, a hydrological, continuous, physically-based SWAT model was developed in the USDA (abbreviation: Soil and Water Assessment Tool; Neitsch et al., 2005). A NEW SWAT implementation was applied (Simić et al., 2009) and adjusted by links and new objects that facilitate modeling of a system with bifurcations.
Present paper describes SWAT modification, as well as an example of its the practical use. This modified model is currently used only in Vlasina hydro-information system. However, it can be generally used in other hydro-information systems with bifurcations of surface and subsurface flows within a single sub-catchment.
2. Theoretical background of SWAT model
Chapter 2 in the paper Simić et al. (2009) presents an overview of the SWAT model development. Basically, SWAT was gradually upgraded with more and more advanced modules, according to user demands and availability of real physical data.
SWAT model is able to describe many different physical processes simulated in a catchment area. For the purpose of modelling a catchment can be divided into many sub-catchments. The use of sub-catchments in simulations is justified in case of various uses of the areas or different land types, which impacts the hydrological processes.
(mm H2O), and Qgw is the value of underground runoff (mm H2O).The second phase is water and sediment circulation through the river network up to the exit profile. Model accuracy is the matter of river network and objects on it.
After the research of the principal, as well as of numerous adapted models, the project team of the Belgrade-based Institute “Jaroslav Černi” had decided to implement an additional development of the SWAT model and adapt it to the catchment areas of “Vlasina” hydropower plants system in the conditions of bifurcation of catchment area intersected by channels. Hydrological simulation SWAT model computes the transformation of the rainfall into runoff (surface and base) in the case of natural basin and natural river network. However, natural surface and sub-surface flows in Vlasina catchment area were significantly altered by the construction of the drainage channels intersecting river flows. It should be noted that channels do not capture all water from the natural watercourse, but they let a certain amount of water to run downstream, in the form of surface and sub-surface flows. This amount of water is directly related to the channel type (location) and the season. Changes in the SWAT model presented here are related to both phases of model operation, i.e. both surface and sub-surface flow.
3. Theoretical background of the new model
3.1. Adaptation of SWAT theory
In addition to rivers (natural linear object capturing water from the terrain along the entire watercourse), certain new elements were introduced into the SWAT model:
channels (artificial linear objects) which can capture terrain water longitudinally (i.e. they have their surface profile) and which intersect the river they are taking certain amount of water from, and
tunnels (artificial linear objects) which are only transporting water downstream and neither they have a catchment, nor do they intersect a river.
New elements have been defined (hydro-profiles HP). They represent places on the watercourse (natural or artificial) where all waters from the upstream part of the catchment area are collected by virtue of the hydrological SWAT model:
HPN (hydro-profile on the natural watercourse) is the hydro-profile with only a natural profile on the upstream side, such that all water from the catchment reaches the hydro-profile. Further downstream, water travels along only one, downstream watercourse (river, channel or tunnel).
HPC (hydro-profile on the channel) is the hydro-profile which uses the channel and upstream river flows to determine the catchment, but a certain amount of water from the upstream rivers (intersected by channels) is transferred downstream through a natural watercourse (a river).
catchment. Some leakage on the intake is also allowed; hence, one part of the water is not taken in, but transferred downstream.
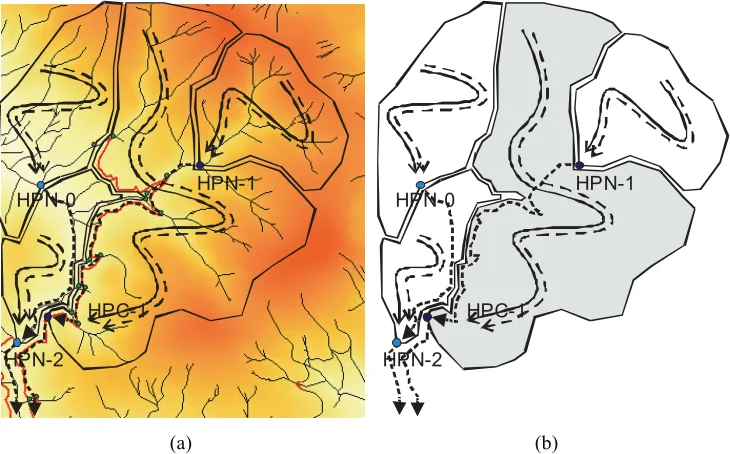
HPS (storage hydro-profile) is located within the storage. One channel link is used to drain out a certain amount of water to the plant or into the downstream channel. Figure 1 shows one part of “Vlasina” catchment area (north of Lake Vlasina) with the digital terrain model, rivers (natural flows – black lines) and channels (red lines). The subject example contains the hydro-profiles too – the natural, channel and intake (part of the catchment area inside the broken line is magnified in Figure 3). The figure shows the river flow intersected by the boundary channels on higher elevations and how they run along the contour lines to drain out river waters to Vlasina Lake. In the same time, a certain amount of these waters runs downstream over or along the channel into the natural watercourse.
Fig. 1. Northern part of Lake Vlasina catchment area with marked hydro-profiles
Figure 2 (a) shows the artificial channel with surface water flow (solid line) and sub-surface water flow (broken line). Figure 3 (b) shows the artificial channel capturing all sub-surface and sub-surface waters from the upstream part of the catchment area, and Figure 3 (c) shows the artificial channel which is capturing some (but not all) surface and sub-surface waters from the upstream part of the catchment area.
HPN-1
HPC-1
HPC-2
HPC-3
HPC-4
HPC-5
HPN-3
HPN-2
(a) (b) (c) Fig. 2. Link between the channel and the surface flow
A complex network of rivers and artificial channels should be integrated into a unified topologically organized branched network. This is achieved by the introduction of a new common node with two outlets: the first one runs downstream along the channel network (with a higher priority during propagation), and the second one, down the river (natural) network (with a lower priority during the downstream propagation). The common node is not marked by any special attributes. The supporting database contains a special table that lists all in this manner discontinued segments of the natural river network, in the Blink field (discontinued link).
HPN-1
HPC-1
HPN-2
HPN-0 HPN-1
HPC-1
HPN-2 HPN-0
(a) (b)
Fig. 3. Calculation of the surface flow, sub-surface flow and flow in the storage
database were determined in this type of network by virtue of standard GIS procedures for all predefined hydro-profiles (channels and rivers are not separated here).
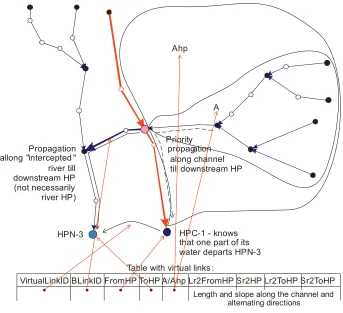
The runoff simulation by SWAT model assumes that these parameters and the formed branched network can drain (take in) all waters (surface and sub-surface ones) available to them. However, in most cases the channels drain only one a certain amount of waters. The ratio of drained waters and waters transferred downstream is not constant time-wise or channel length-wise. In order to simulate this in the model, the lists of all links between the hydro-profiles on the channel and all downstream hydro-hydro-profiles on rivers intersected by that channel are formed in the table Vlink (Virtual Link). This link makes possible the downstream propagation of the amount of water that reaches the channel hydro-profile (surface waters are treated separately from sub-surface waters).
HP -1 -
HP -3 C
N knows that one part of its water departs HP -3N
Propagation allong intercepted
river till downstream P not necessarily river HP " "
H (
)
Priorit propagyation
along channel till downstream HP
Tabl :e with virtual links
VirtualLinkID BLinkID FromHP ToHP A/Ahp Lr2FromHP Sr2HP Lr2ToHP Sr2ToHP A
Ahp
Length and slope along the channel and alternating directions
Fig. 4. Real and virtual links
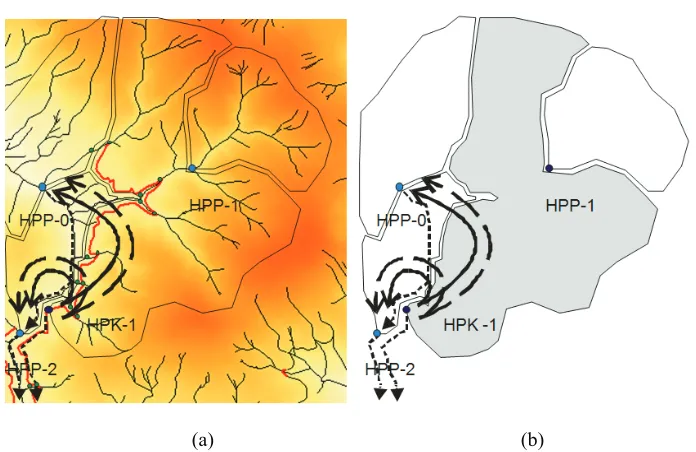
(a) (b) Fig. 5. Transfer of the surface and sub-surface flows into downstream basins
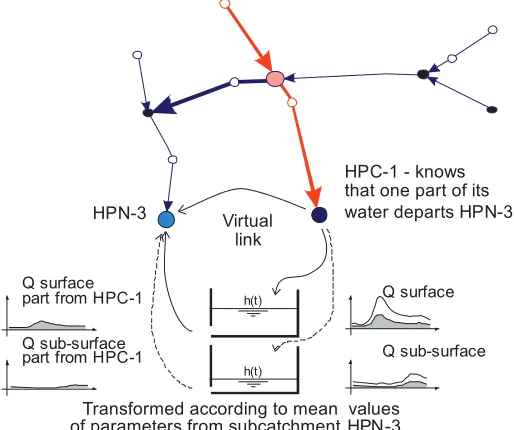
Figures 5 (a) and (b) show the transfer of surface and sub-surface flows into downstream basins with the lag parameters determined according to the mean values of parameters for downstream basins and the ratio of flows determined according to the ratio of areas of downstream basins. Solid lines show the transfer of a part of the surface flow; long broken lines show the transfer of the part of sub-surface flow; while the short broken lines indicate the flow along the river. For the purpose of calculation of the propagation of the part of water spilled from the channel network, departing from FromHP to downstream (ToHP) hydro-profiles, flow parameters will be calculated for all downstream hydro-profiles (HPN-0 and HPN-2 in Figure 5). The model assumes that these parameters are equal to the average parameters for each basin, computed for SWAT model. Upon these parameters and water division proportional to the values of all downstream basins, the water from HPC (HPC-1 in Figure 5) is transferred into downstream hydro-profiles (more detail is shown in Figure 7, for one link between the channel upstream and the natural downstream hydro-profiles).
HPC-1 HPN-3
HPC HPN
HPC-1 - it knows that one part of its water departs to HPN-3 HPN-3
Propagation to a down-stream HPN catchment area of HPC-1 ca tch m en t a rea o f H P N -3
Q - inflow from the upstream part Q disch. +Q surf. +Q sub-surf. Q discharge +Q surface +Q sub-surface
+Q surface part from HPC-1
+Q sub-surface part from HPC-1
transformed according to the mean values of parameters for the HPN-3 catchment area Two independent networks
(no common nodes)
Formation of a branched network through the introduction of new nodes and the listing of "downstream" nodes
for channel hydro-profiles
Legend River River River node River hydro-profile Channel nserted node
Search for the spilling HP Discontinued river BLink
: - vertex - - - vertex - - Channel Channel node Channel hydro-profile I
Fig. 6. Water propagation by river and channel sections
HPC-1 -
HPN-3 knows that one part of its water departs HPN-3 Virtuel link
through two linear reservoirs
Virtuel (
reservoirs for surface and sub-surface flow
Flow parameters are function of Lr2FromHP Sr2HP Lr2ToHP Sr2ToHP and volume of A/Ahp
) link with two
Qs u rfa c e Qs u b -s u rf . h(t) h(t)
Fig. 7. Two storages for virtual links
3.2. Algorithm of HPC-HPN virtual link
A virtual link between the channel hydro-profile HPC and any lower level hydro-profile is assumed. The assumed network is one-way oriented and explicit, which is a way to conform to the explicit formulation of the SWAT-based hydrological model of vertical balance. Link parameters can be derived from the terrain topology, volume of water arriving to a channel hydro-profile HPC (primary hydro-profile) and the estimated time of water transfer from the primary hydro-profile to the lower priority hydro-profile. This approach provides for an explicit description of virtual link concept with just one additional calibration parameter (the coefficient of water transfer through the virtual link k in percents).
The following analysis assumes the water transfer through the virtual link using the linear storage. The objective of water transfer is to make possible a continuous water transfer through a virtual network with lag control. The behaviour of the linear storage applied on the virtual link is described by the following formula:
_ _
1
( ) ( ) (1 )
virt HPK virt virt lag
Q t Q t
e
(2)
while conforming to the following condition: virt lag_ 0
where Qvirt is the water volume transferred in a given time segment by the virtual link from
HPC to the lower rank hydro-profile, QHPK_virt is water volume in the reservoir and parameter virt_lag is the lag coefficient (defined separately for surface and underground runoff components). Water volume that remains in the reservoir in the next moment of time is as follows:
_ ( ) _ ( ) ( ) _ ( )
HPK virt HPK virt virt HPK trans
Q t Q t t Q t t Q t (3)
where QHPK_trans is the water volume transferred by the virtual link from the primary hydro-node
calculation or any other after the storage was emptied), the first two members of the function are equal to zero and the reservoir is filled with the discharge QHPK_trans .
Water volume planned for transfer by the virtual link from the primary hydro-profile (channel hydro-profile) to the secondary one, during the given time moment, is determined by the following formula:
_ ( ) _ ( )
HPK trans surf HPK surf hp
A
Q t k Q t
A
(4)_ ( ) _ ( )
HPK trans gw HPK gw
hp
A
Q t k Q t
A
(5)where QHPK_surf(gw) is the water volume obtained by the hydrological calculation for the part of
sub-catchment, being the part of the primary (channel) hydro-profile, A/Ahp – ratio of the areas
of the individual basins of discontinued watercourses and the total area of the sub-catchment, being the part of the respective primary hydro-profile, and k – the coefficient denoting the amount of water (in percents) to be transmitted (this parameter is a calibration parameter). Water volume determined for transfer is thesum of all discontinued links.
HP -1 -
-3 C knows that one part of its water departs HPN HPN-3 Virtual
link
h(t)
h(t)
Q surface
Q sub-surface Q surface
part from HPC-1
Q sub-surface part from HPC-1
Transform
HP -3 ed according to mean values of parameters from subcatchment N
Fig. 8. Transformed hydrograph of virtual links
Equations (2), (3), (4) and (5) describe the balance of linear reservoirs of virtual links. Each virtual link should have one linear reservoir for underground and one for surface waters. The operational difference between the reservoirs is described by the lag coefficient, which will be shown for each reservoir separately after the considerations that are common for both types of reservoirs.
(3) and (4), has a major effect on the mentioned two ratios: if ratio A/Ahp is greater, the
mentioned ratios of distance and terrain slope should be given a higher weight.
If the above mentioned ratios are conformed to, the lag coefficient of the linear reservoir
virt_lag, for each virtual link, is determined by the following equations (separately for surface and sub-surface components):
2 2 _ ( ) 2 2 surf surf hp Sr FromHP
A Sr ToHP
virt lag C k
Lr FromHP A
Lr ToHP
(6)
2 2 _ ( ) 2 2 gw gw hp Sr FromHP
A Sr ToHP
virt lag C k
Lr FromHP A
Lr ToHP
(7)
where Csurf and Cgw are the scaling functions determined for the entire “Vlasina” catchment
area. Accordingly, lag coefficients are placed in a certain (real) interval. This interval is determined separately for linear reservoirs that correspond to surface and sub-surface waters respectively, in real time of natural water transportation.
The function C has been determined upon the fact that surface water travels to the hydro-profile during 0.5 days on average, while the underground water leaks for approximately 20-60 days, as well as on the basis of parameter calibrations.
The value of lag parameter virt_lag, corresponding to the linear reservoir of surface water, is between 1 and 1.5, while the value corresponding to sub-surface waters is between 0.03 and 0.1. The first interval forecasts the emptying of 95% of the storage water in 0.5 days, while the second one forecasts the emptying of 95% of the water during 20-60 days.
Scaling the lag coefficient down to envisaged intervals should be performed for the entire catchment area. If a certain array [xmin, …,xi,….xmax] needs to be scaled to fit into the interval [a,b], a new value yi,, which would correspond to the array member xi , will be calculated using the formula: min max min i i x x y a b
x x
(8)
In this case, the array [xmin, …,xi,….xmax] is a sorted array of values corresponding to a virtual link: 2 2 2 2 hp Sr FromHP
A Sr ToHP
k
Lr FromHP A
Lr ToHP
(9)
4. Application of the new model
Vlasina dam was built in South-East Serbia in 1950's. Vlasina Lake was then formed as the skeleton of the “Vlasina” HPPs system. “Vlasina” HPPs system is described in the paper Divac et al. 2009. The model was applied on the “Vlasina” HPPs system (Institut Jaroslav Černi, 2007).4.1. Model Preparation
Final number of HRUs was defined for the catchment area of the “Vlasina” hydropower plants system. The HRU network is the main unit for modelling of the rainfall-runoff phenomenon. The adopted discretization for the River Drina basin is 0.2 x 0.2 km, resulting in 14681 HRUs. HRUs are mainly of a square shape, with the total area of 0.04 km2, except on the boundaries of several basins where they have an irregular shape. It is assumed that all input values of the model at the level of HRU are homogeneous that is, quasi-homogeneous.
The hydrological model developed in the catchment area of “Vlasina” hydropower plants system is based on the following data:
DMT (digital model of terrain) with a pixel size 25x25 m, what corresponds to the map scale of 1:25000.
vegetation map with 10 classes according to CORINA classification, soil map with 1 class,
hydrogeological map with 4 classes, hydrographic network of 2D poly-lines, and data collected by 16 meteorological stations.
“Vlasina” HIS database contains historical data on mean daily values of water levels and discharges on 23 water-metering stations in the “Vlasina” catchment area. Data sources used were the annual reports of the “Vlasina HPPs” Hydro-Construction Department and the Republic Hydro-Meteorological Service.
In addition to water levels and discharges on the official water-metering stations, the database contains the data of the same type related to operation and management of the system hydropower objects, such as storage water levels, water spills, outflows etc.
The database contains the daily values of the following meteorological phenomena: rainfall data from 25 rainfall or meteorological stations, air temperature data from 2 meteorological stations, air humidity from 2 meteorological stations and the sum of daily evaporations from the water table and from the vessel from 1 meteorological station. The total amount of meteorological data in the database for the period 1946–2005 is 196,808 daily values.
4.2. Example of runoff simulation on the catchments of “Čemernik” and “Strvna” channels
Fig. 10. Part of the “Vlasina” hydropower system catchment area, north of Lake Vlasina, composed of gravitation channels “Čemernik” and “Strvna”
Fig. 11. Input data (rainfall, air temperature) on one of the stations on the part of the “Vlasina” hydropower system catchment area, north of Lake Vlasina, composed of gravitation channels
“Čemernik” and “Strvna”
5. Results
The results of the SWAT model adapted to bifurcation environment intersected by channels in the part of “Vlasina” hydropower plants system (Figure 10) are presented in Figures 12, 13 and 14. Figure 12 shows the comparison of observed and simulated hydrographs on the subject part of the “Vlasina” hydropower plants system (the chosen HPC–1, Figure 7). This measurement point is actually the location of the mouth of channel “Strvna” into Lake Vlasina. Comparative discharges are given for nine months of the year 1981.
Fig. 12. Comparison of measured and simulated hydrographs of the subject part of “Vlasina” hydropower plants system (at the mouth of the “Strvna” Channel into Lake Vlasina for a part of
year 1981)
Figure 13 shows the comparison of measured and simulated hydrographs on the subject part of the “Vlasina” hydropower plants system (selected HPC–1, Figure 7). This measurement point is actually the location of the mouth of the channel “Čemernik” into Lake Vlasina. Comparative discharges are giver for nine months of the year 1981.
Fig. 13. Comparison of observed and simulated hydrographs of the subject part of “Vlasina” hydropower plants system (the mouth of the “Čemernik” Channel into Lake Vlasina, part of the
year 1981)
The mean observed discharge is 348 l/s, while the discharge resulting from the model is 299 l/s, what makes a 14% difference. Figure 13 shows that the base component of discharge was rather successfully simulated, while the component of surface runoff shows significant deviations.
Fig. 14. Discharges “transferred” by virtual links to the natural discharge hydro-profile “Crna Trava” (for “Strvna” and “Čemernik” channels catchment areas, part of the year 1981)
The analysis of the example leads to the conclusion that the quality of calibration of model parameters is relatively satisfactory in terms of the balance, and to a certain extent satisfactory in terms of the runoff dynamics, as certain deviations between the measured and simulated discharges during the periods of the surface runoff component can be observed.
6. Conclusions
Present paper shows how the channels in conjunction with a natural hydrographic network create bifurcations at intersection spots and, accordingly, how the natural surface and sub-surface water flows are significantly changed by the artificial drainage channels. NEW SWAT implementation was used for the modeling of this phenomenon (Simić et al., 2009). It was supplemented by the links and new objects providing for the modeling of the system with bifurcations. The following notions were introduced: HPN (natural hydro-profile), HPC (channel hydro-profile), HPI (intake hydro-profile), HPS (storage hydro-profile) and virtual links. They were used for the solution of the phenomenon of water bifurcation at the intersection points of channels and natural watercourses.
It can be stated that the developed SWAT model adaptation to bifurcation created by channel intersections is applicable in the hydro-information systems of Serbian basins. The developed model was applied in the catchment area of “Vlasina” hydropower plants. Model parameters require further calibration so that the quality of the results can be improved. In addition to further model application, it is necessary to continue the work on its further development, improvement and on the application of better GIS and input hydro-metrological data.
References
Divac D, Grujović N, Milivojević N, Stojanović Z, Simić Z (2009), Hydro-Information Systems and Management of Hydropower Resources in Serbia, Journal of the Serbian Society for Computational Mechanics, Vol. 3, No. 1
Neitsch SL, Arnold JG, Kiniry JR, Williams JR (2005), The soil and water assessment tool, version 2005. http://www.brc.tamus.edu/swat/doc.html.
Stanić M, Prodanović D, Branisavljević N (2005), Improvement of distributed hydrological model of River Drina . Ministry of Agriculture, Forestry and Water Management.
Simić Z, Milivojević N, Prodanović D, Milivojević V, Perović N (2009), SWAT-Based Runoff Modeling in Complex Catchment Areas – Theoretical Background and Numerical Procedures. Journal of the Serbian Society for Computational Mechanics, Vol. 3, No. 1 Stojanović Z, Vukosavić D, Divac D, Milivojević N, Vučković D (2009), Hydropower Plants