INTRODUCTION
Air emission poses a serious problem for the environment. Each activity aimed at processing natural resources involves some discharge of sub-stances into the atmosphere. Taking into consid-eration a refining and petrochemical plant with its own power supply, one can discern the so-called chanelled emission, i.e. emission of pollutants from every kind of technological and combustion processes, released through stacks, emitters, etc. The sources of this emission include the follow -ing: boilers, furnaces, absorber blowouts and oth -er places from which combustion gases (en-ergy- (energy-related pollutants in particular) and waste gases (mainly hydrocarbons), which constitute inherent elements of refining and petrochemical produc -tion, are released. It is relatively easy to estimate, quantify and reduce this type of emission. Tech-nologies which curb it are universally accessible and known; they include, among other things, cat -alytic oxidation, reduction, electrostatic precipita -tors, adsorbers and absorbers. Fugitive emission, which cannot be omitted when we discuss an in -tegrated approach to environmental management,
is slightly different from the chanelled one [Kamiński 2015], and is extremely important in terms of both air protection and optimum opera-tional activity. Only a systemic approach can en-sure the expected results of emission reduction.
LDAR PROGRAM
The origin of the program
The fugitive emission of volatile organic compounds (VOCs) is significant for the refining and petrochemical industry. According to the In -dustrial Emission Directive (IED), VOCs are ei -ther organic compounds with vapour pressure of at least 0.01 kPa at a temperature of 293.15 K or organic compounds whose volatility corresponds to this value in special operating conditions.
The obligation to take fugitive emission into account while analysing the impact of installa -tions with integrated permits on atmospheric air quality arises from the provisions of the Envi-ronmental Protection Law (articles 144 and 222, paragraph 1). Also, under articles 284 and 285 Accepted: 2019.01.13 Available online: 2019.01.20 Volume 20, Issue 3, March 2019, pages 172–178
https://doi.org/10.12911/22998993/101644
The Use of Dedicated System Tools in Integrated Management
in Environmental Protection on the Example of LDAR Program
Arkadiusz Kamiński
1*, Paweł Koziczyński
11 PKN ORLEN S.A., ul. Chemików 7, 09-411 Płock, Poland
* Corresponding author’s e-mail: [email protected]
ABSTRACT
Fugitive emissions of volatile organic compounds (VOCs) in the chemical industry are, in addition to channelled emissions, an important element of the total emission into the air. The Leak Detection and Repair (LDAR) pro -gram is one of the tools to control this type of emission and is a key component of an integrated approach to
en-vironmental management. This paper presents the genesis and general assumptions of LDAR, the methodology of fugitive emissions analysis, including its quantification, an example of how to proceed with the implementa
-tion of a comprehensive LDAR system, including tools to support its func-tioning. The potential environmental and non-environmental benefits of implementing the LDAR program in the refining and petrochemical industry
are also presented.
of this law, charges for fugitive emission are im -posed on those who make use of the environment. Despite a number of legal requirements, the is -sue of fugitive emission control and reduction has been evaded up to now. Frequently, only the formal requirements were met. In the refining and petrochemical industry, however, the situa -tion changed after the European Commission had published its decision establishing best available techniques (BAT) conclusions for the refining of mineral oil and gas as well as sewage treatment and waste gas purification for the chemical indus -try. These documents discuss the monitoring and estimation of fugitive VOC emission on the basis of particular methodologies and indicate the need for a comprehensive leak detection and repair system, i.e. the LDAR program. It is a working practice designed for identifying leakage from in-stallation elements; repairing such leaking com -ponents can reduce VOC emission. Subject to the requirements of the LDAR program, installation components need to be monitored at regular in-tervals in order to determine whether they are leaking or tight. Each leaking element has to be repaired or replaced by a set deadline.
In the United States, certain regulations which can be referred to as the beginnings of LDAR were introduced as early as the 1950s. A number of contemporary methodologies originated from the Air Pollution Control Act, which was trans -formed into the Clean Air Act in 1963, amended in 1970. This Act entitled the American Envi -ronmental Protection Agency (EPA) to establish the universal air quality norms protecting the environment and society. LDAR became a for -mal requirement at the turn of the 20th and 21st centuries. As a result, the fugitive emission of hydrocarbons had been reduced by 42% by 2008 as compared with the beginning of the 2000s [LDAR 2017]. However, that was not achieved at no extra cost. According to the refining industry
REF BREF 2015, the annual cost of LDAR for a typical American refinery with over 200,000 fugitive emission points exceeds 750,000 euros.
In Europe, LDAR has been used since the 1990s. In Sweden, it became a compulsory prac -tice for refineries in 1995, which resulted from certain observations made in the late 1980s about the real VOC emission levels being 15–20 times higher than the ones included by reports [Cuclis 2011]. It was not until the 2010s that LDAR was ‘noticed’ in Poland. It became obligatory for re -fineries at that time on the strength of the BAT conclusions. Therefore, the requirement to use LDAR as of October 2018 at the latest will have to be included in integrated permits issued for refining installations. Refineries which have not implemented any LDAR system yet will need to do a lot of work consisting in identifying and cataloguing their potential sources of VOC leak -age, taking quantitative measurements, formulat -ing emission rates and creat-ing a comprehensive LDAR procedure. It must be stressed here that no details of how to implement the LDAR program are given in the form of legislative acts, so refin -eries are given considerable latitude in adopting their approach. What matters is merely the ability to show that one’s LDAR program works and en -ables one to achieve the goal of minimising fugi-tive emission through keeping one’s installations in good working order.
Table 1 shows how important the issue of fugitiveemission control is. This table presents statistical data for a typical refinery or a petro -chemical plant. Valves and flanged connections are the source of over 90% of fugitive VOC emis -sion. Research carried out in 17 refineries by the American National Research Council in the late 1990s shows that leaking valves in the re -fineries could have released into the atmosphere a total of 6,350 tonnes of VOCs per year [Best Practice Guide 2007].
Table 1. Fugitive VOC emission for a typical refinery or petrochemical plant [Best Practice Guide 2007] Elements of the
instalation Quantity (range) Avarage amount Estimated fugitive emission of VOC [Mg/year] in total emissionsParticipation[%]
Pumps 10 – 360 100 19 3
Valves 150 – 46 000 7 400 408 62
Safety valves 5 – 360 90 5 1
Flange connections 600 – 60 000 12 000 201 31
Open ends of pips 1 – 1 600 560 9 1
Sampling connections 20 – 200 80 11 2
Guidelines
An innovative, integrated and comprehensive approach to fugitive emission management in a refining and petrochemical plant should be pur -sued with the use of an LDAR system and com -putational methods. Monitoring should be done by means of the following:
• photoionisation detectors (PID) and flame ionisation detectors (FID) – the so-called sniffing method connected with correla -tion curves referring to key installa-tions (quantitative method);
• optical gas imaging – OGI and FLIR cameras (mainly qualitative method);
• index-based computations, periodically verified through measurement.
A complementary, non-obligatory method consists in controlling and quantifying hydro-carbons which occur in the air through periodic campaigns using optical techniques based on ab-sorption, e.g. differential absorption lidar (DIAL) or solar occultation flux (SOF). However, their drawback is that – instead of focusing directly on the source of emission – they mainly show what happens in the air around installations [BREF REF 2015]. Fugitive emission from tanks is determined on the basis of Raoult’s law, taking into account vapour liquid equilibrium. Figure 1 shows corre -lations between qualitative and quantitative meth -ods for determining fugitive emission volume. The odour detection method and optical gas imaging are inseparable components of each LDAR system because they are used to detect leaks within installations. However, they cannot be used to quantify emissions. A comprehen-sive approach can be applied through combining odour detection methods with correlation curves
in relation to the key elements of installations and the calculation of lengthy emissions. Emission determined in this way becomes a component of the total fugitive emission which constitutes the sum of emission caused by leakage and emission occurring during normal installation operation [Kanderska 2015].
Subject to the requirements of the LDAR pro -gram, installation components need to be moni -tored at regular intervals in order to determine whether their elements are leaking or tight. Each leaking element has to be repaired or replaced by a set deadline. According to the data included in Best Practice Guide 2007, the implementation of an LDAR system enables one to eliminate around 63% of VOC emission coming from refinery instal -lation leakage and around 56% of VOC emission coming from the production of organic chemicals. When properly run, the LDAR program comes in the following five steps [Best Practice Guide 2007]:
1. Identification of elements – ascribing explicit identifiers to potentially leaking elements on the basis of, for instance, P&ID diagrams and databases including information on location, medium, emission index, last repair, etc.; 2. Leakage definition – one may follow the ex
-ample of the American ‘Method 21’ [US EPA 2017], which defines a leakage as untightness resulting in emission exceeding 10,000 ppm. One may assume other threshold values or ob-serve the visual changes of a given element. 3. Monitoring of leakage detection and VOC emis
-sion by means of portable devices and method-ologies described in BAT 6 (see Table 1). The monitoring frequency of 2–8 years suggested by US EPA in Method 21 depends on the type of component and periodical rates of its flight.
4. Repair – in certain cases it may be sufficient to tighten bolts, replace bolts, tighten gland nuts and inject lubricant. Some elements may be listed for later repair (the exact date should be included in the documentation). Elements are considered repaired when the very next tight -ness test shows that the leakage threshold has not been exceeded.
5. Recordkeeping – all the elements which may be leaking must be listed; equipment specifica -tions (description of changes) as well as tight -ness monitoring results must be stored; addi -tionally, each repair and inspection test need to be recorded.
A significant advantage brought indirectly by the LDAR program is the chance to quantify the fugitive VOC emission on the basis of the survey made in step no. 3 according to EN 15446:2008 standard or its amended version. The fixed emis -sion indexes and patterns of correlation curves pre-sented in Table 2 may be used interchangeably, but the amended version of the standard is preferred in official legal documents and norms (Method 21 US EPA 2017) as well as specialist literature [Best Practice Guide 2007, Gonzalez et al. 2015].
Practical utilisation of the LDAR program
It must be mentioned here that despite the lack of legal obligation to implement the LDAR program, refineries have been inspecting their potentially leaking components as well as seal -ing and repair-ing their installations. As a result, they now need to systematise their current solu -tions and procedures, organise them into an inte -grated system combining BAT 6 and BAT 18, and assign certain roles to particular organisational sections. The way in which a refinery implements the LDAR program largely depends on its past experiences, complexity and certain local condi -tioning, including public expectations.
Preparatory works should consist in divid -ing the plant into separate installations (this di -vision is most often consistent with the di-vision in the integrated permit) and then each installa-tion into process streams. Since in most cases the production and/or technology departments have the most detailed knowledge of these divi -sions, it is them that are most actively involved in the preparatory works. The very next step is to establish the number and types of fugitive emis-sion points for each process line. Points should
Table 2. VOC emission factors [Gonzalez et al. 2015]
Fixed emission factors
Elements of the instalation Medium Coefficient[kg/h/element] for emissions ≥ 10 000 ppm Coefficient[kg/h/element] for emissions < 10 000 ppm
Pumps Light liquid 0.437 0.012
Heavy liquid 0.3885 0.0135
Valves
Gas 0.2626 0.0006
Light liqiud 0.0852 0.0017
Heavy liquid 0.00023 0.00023
Safety valves gas 1.691 0.0477
Flange connections All 0.0375 0.00006
Open ends of pipe All 0.01195 0.0015
Compressors Gas 1.608 0.0894
Correlation curves
Emission SV ≥ 100 000 ppm Emission SV < 100 000 ppm
coefficient [kg/h/element] = C coefficient [kg/h/element] = A x (SV)B
Elements of instalation Constant value C [kg/h/element] Coefficient A Coefficient B
Pumps 0.16 0.0000503 0.610
Valves 0.14 0.00000229 0.746
Flanges 0.084 0.00000461 0.703
Other flanges 0.03 0.00000153 0.735
open ends of pipe 0.079 0.0000022 0.704
be understood as details, including the smallest ones, which may be sources of emission. A given set of points forms an element which is illustrated in piping and instrumentation diagrams (P&ID). Thus, for instance, a valve is an element with points in the form of three flanged connections and a gland. A flanged connection at a pipeline is an example of a one-point element. The elements which should be inventoried include, among other things, the following: mixers, pumps, com -pressors, flanges, open pipe ends, valves, sample collection points. Figure 2 presents an example of how to mark process streams and elements which are subject to LDAR.
Since the LDAR program is connected with preventing VOC emission, it is necessary to de -termine the threshold value for volatile hydro-carbons in the process streams; when the value is exceeded, the volatile hydrocarbons will be clas -sified as those which are subject to LDAR. The
purpose is to avoid inventorying water streams or those with inorganic substances. The threshold value depends on a number of factors and is not legally imposed; it is selected individually.
An important component of the LDAR sys -tem is the value of leakage threshold, i.e. the level of VOC emission expressed in ppm. When untightness exceeds this threshold, it is classified as leakage and is subject to special repair pro -cedures. The value of this threshold is selected individually, too.
In order to use the data collected in the process of inventorying for quantifying the fugitive VOC emission, among other things, one has to deter -mine the composition of process streams. Know -ing this composition, we can convert the emission of total organic carbon (expressed in ppm) meas -ured by means of a PID detector into the emis -sion of a particular substance expressed in kg/h, additionally using the correlations presented in
Table 2. To simplify this conversion, one can as -sume that the percentage composition of a liquid stream corresponds to the composition of vapours.
One can carry out the field inventorying by engaging one’s own production and maintenance specialists or outsourcing this service. It is crucial to make sure that the people responsible for the inventorying are experienced, preferably in terms of a given installation, which shortens the time needed for inventorying and enables the people to avoid making mistakes. Inventorying one’s el -ements, one needs to designate each of them. If there already exist some symbols in one’s plant, there are obviously no obstacles to using them. It must be taken into account that some elements may be inaccessible (no access; areas requiring the use of oxygen respirators, etc). Such elements can be inventoried when they become accessible. One way to designate elements in the field is to affix designation labels to them. Such labels have to be made of durable materials resistant to weather and the environment of the plant (hydro -carbon vapours, acids, etc). These labels have to be affixed in such a way that they do not hinder the everyday usage of installations and, at the same time, are not accidentally dismantled; this is particularly important when it comes to instal -lation repairs during which the labels may be lost or wrongly re-affixed.
Measurements and leakage repairs are the most important components of the LDAR pro -gram. Alike inventorying, they can be carried out by one’s own specialists or outsourced. In large plants where the number of points is over 300,000 such measurements and repairs are out -sourced. The frequency and scope of monitoring campaigns should be selected individually. Ex-perience [BREF REF 2015, Best Practice Guide 2007] shows that the frequency may range from once every three or four years to several times a year. It seems to be rational to organise such mon -itoring campaigns at least as often as the repairs.
The measurements are performed first by means of OGI optical cameras and then, if leak -age is detected in the form of a cloud, flame ioni -sation detectors are used. When leakage is identi-fied (i.e. untightness exceeds the assumed thresh -old) through planned (routine) or extraordinary measurements, it needs to be marked by means of a designation label, for instance, and reported as earmarked for the first repair attempt. Mainte -nance specialists usually verify whether it is pos -sible to repair a leakage or not. The procedure of
the first repair attempt is adopted when the repair is approved. In large industrial complexes, such repairs usually consist in tightening bolts only. As a general rule, no extensive repairs are pos -sible due to guarantee restrictions, regulations imposed by technical inspection offices and the risk of further damage to the element. It must also be remembered that even tightening a bolt may be regarded as a repair process and may need to be agreed on internally. After a repair has been completed, its effectiveness is evaluated through a control measurement. Control teams and repair teams may work separately or together. One of the good practices is to carry out measurements during the repairs.
If the repair of a given point is not approved or ineffective, the point is earmarked for proper repair usually done when the installation stop -page. Stopping an installation because of a leak only is rational for neither environmental nor eco-nomic reasons (flare stack dumps and production losses respectively). The measurement confirm -ing the effectiveness of a repair is done after the installation has been restarted; the medium needs to be present in the stream.
Both first and proper leakage repairs should take place as early as possible; however, there are no deadlines imposed by LDAR regula -tions. Deadlines should be clearly set depend-ing on individual factors and included in plants’ internal procedures.
CONCLUSIONS
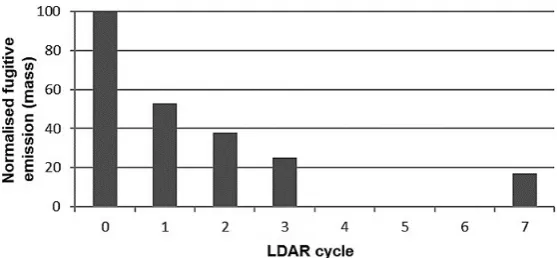
An example of the integrated approach to environmental management, LDAR benefits the environment as it lowers VOC emissions into the atmosphere. When properly run by maintenance crews and technological specialists responsible for production installations, LDAR reduces fuel, medium and product losses, improves workplace safety and generates savings in terms of envi-ronmental fees. Data collected by CONCAWE [Gonzalez et al. 2015] include results produced by one of the European refineries over several LDAR cycles. Figure 3 shows that it is possible to decrease mass fugitive VOC emission fivefold over a longer period of time. The study [Drago 2010] indicates that between 1988 and 2008 emission reductions in the United States reached 79% and 82% in the case of refinery installations and chemical industry installations.
It takes several or even a dozen or so years to produce notable effects of LDAR. We will be able to share our Polish LDAR experiences in a dozen or so years because LDAR has been implemented in Polish refineries since October 2018. Neverthe -less, it can already be seen that there are and will be some challenges which must be confronted. It must also be remembered that the approach pre-sented in this article is merely an example of how LDAR can be run; the approach is not imposed by law or obligatory in any way.
REFERENCES
1. A Simplified Timeline of the History of LDAR (Leak Detection and Repair) http://www.targetemission. com/2017/12/27/simplified-timeline-history-ldar-leak-detection-repair/ dostęp 20–07–2018;
2. Cuclis A., 2011. Measuring VOCs in Refineries and Chemical Plants, Houston Advanced Research Center, Houston;
3. Drago J., 2010. Enhanced Leak Detection and Repair Programs for the Chemical Processing In
-dustry, materiały konferencyjne ChemInnovations, Houston;
4. Gonzalez L. et al. Techniques for detecting and quantifying fugitive emissions – results on com
-parative field studies, CONCAWE, Brussels, 2015; 5. Kamiński A., Koziczyński P. 2015. Zintegrowane
podejście do zagadnień ochrony środowiska w kompleksie rafineryjno-petrochemiczno-ener
-getycznym w obliczu środowiskowych regulacji prawnych. Chemik, 69, 10, 635–638;
6. Kanderska K., 2015. Documentation prepared by ORLEN Eko Sp. z o.o. as an order by PKN OR
-LEN S.A., December;
7. REF BREF, European Commission: Best Avail
-able Techniques (BAT) Reference Document for the Refining of Mineral Oil and Gas, March 2015; 8. Best Practices Guide, Leak Detection and Repair;
US EPA, Washington, 2007;
9. Method 21 – Determination of Volatile Organic Compound Leaks, US EPA, https://www.epa.gov/ sites/production/files/2017–08/documents/meth
-od_21.pdf; available 20–07–2018.
Fig. 3. Relative VOC emission for one of the European refineries, assuming that the emission before the imple
![Table 1. Fugitive VOC emission for a typical refinery or petrochemical plant [Best Practice Guide 2007]](https://thumb-us.123doks.com/thumbv2/123dok_us/8369721.1674795/2.595.71.526.657.770/table-fugitive-emission-typical-refinery-petrochemical-practice-guide.webp)
![Fig. 1. Correlations between qualitative and quantitative methods for determining fugitive VOC emissions [Kanderska 2015]](https://thumb-us.123doks.com/thumbv2/123dok_us/8369721.1674795/3.595.74.522.607.740/correlations-qualitative-quantitative-methods-determining-fugitive-emissions-kanderska.webp)
![Table 2. VOC emission factors [Gonzalez et al. 2015]](https://thumb-us.123doks.com/thumbv2/123dok_us/8369721.1674795/4.595.72.528.455.772/table-voc-emission-factors-gonzalez-al.webp)
![Fig. 2. An example of process streams establishing and instrumentation marking, based on [Kanderska 2015]](https://thumb-us.123doks.com/thumbv2/123dok_us/8369721.1674795/5.595.69.520.357.754/example-process-streams-establishing-instrumentation-marking-based-kanderska.webp)