Correlation Analysis between a Modified
Ring Method and the FAST System
Enric Carrera-Gallissà1, Xavier Capdevila1, Josep Valldeperas2
1
Department of Textile and Paper Engineering, Universitat Politècnica de Catalunya, SPAIN
2
Instituto de Investigación Textil y Cooperación Industrial de Terrassa, Universitat Politècnica de Catalunya, SPAIN
Correspondence to:
Enric Carrera-Gallissà email: [email protected]
ABSTRACT
The original ring method and some of its modified versions were examined with a view to developing a straightforward, universal alternative for use by the textile industry. For this purpose, a total of 42 specimens of commercial woven fabrics differing in composition, weave type and aerial weight were studied by using the FAST method and a modified version of the ring method developed by the authors. Correlation between the results of the two methods was found to depend largely on (a) fabric formability, (b) bending rigidity, and (c) maximum extraction force and the time needed to reach it. Regression equations relating the main variables of the two methods via canonical correlations were developed. The proposed modified version of the ring method allows the easy, inexpensive determination of fabric formability, which was previously possible with the FAST method only.
Keywords: FAST, Ring test, Hand, Low-stress properties, Tailorability, Formability, Canonical relations
INTRODUCTION
Fabric hand can be measured by using direct or indirect methods, which differ in the specific parameters they assess and in the way the phenomenon of hand is interpreted [1]. Thus, indirect methods measure properties such as fabric bending rigidity, roughness or compressibility; and then establish cross-correlations with the results of subjective assessment tests conducted in parallel. The best known, most widely used direct methods are the Kawabata Evaluating System for Fabrics (KES-F) [2] and the Fabric Assurance by Simple Testing (FAST) method [3]. On the other hand, indirect methods use ingenious techniques mimicking the response of humans to fabric feel by
assessing quantities such as hand force or hand modulus. The best-known indirect methods include the ring test and the slot method.
The Ring Test and Its Evolution
According to its advocates, the ring test provides a simple, expeditious method accurately mimicking the traditional procedure by which fabrics are passed through a half-closed hand to feel their softness. In fact, this is how the softness of next-to-skin fabrics and their resistance to multiaxial deformation have traditionally been assessed. For example, women in the Middle Ages assessed silk fabrics for softness by passing them through their rings [4].
The ring test involves measuring the force needed to completely pass a circular fabric specimen through a metal ring of specific dimensions. A patent for a test method and a device for measuring hand in fabrics and other flexible materials were filed in the USA in the late 1970s [5]. The method was used to measure the extraction force needed for a fabric specimen to pass through a conical hole of given thickness and diameter. This operational principle was subsequently used to develop a test method the results of which were found to correlate well with subjective hand assessment tests [6] [7]. Also, a detailed interpretation of the force– extraction curve for fabric specimens passed through the ring was reported [8].
extraction force for various types of fabric; the measured “handle force” was found to be well correlated with KES parameters [4]. This method was also used to assess handle in differently finished fabrics and proved suitable for determining total handle and differences in fabric structure, finish or moisture [9].
A comprehensive study of fabric comfort led to the development of the El Mogahzy–Kilinc method as a substantially improved version of the ring test [10] [11]. The main difference from previous similar methods was that the head used to pass the fabric consisted of a small tube of flexible material ending in an inverted half-cone of the same material. The head was mounted on a digitally controlled low-deformation mechanical analyzer governed via dedicated software [12] [13]. The equipment was used to construct an extraction–time curve (a “hand profile”) for each fabric specimen and calculate the amount of energy required to pass it through the head (the “objective total hand”).
The previous tests, however, provide rather disparate extraction force results owing to the high variability in folding between specimens. New techniques based on the ring test principle but improving on specimen control have been developed since the year 2000 to reduce such variability and efficiently control specimen folding during passage through the ring. To this end, the fabric specimen is passed through a circular hole of variable radius and retained by two disks a variable distance apart [14] [15] [16]. The optimization and application of this test method to woven and knitted fabrics, and also to membranes, has been the subject of much literature [17] [18] [19] [20] [21] [22] [23] [24] [25] [26].
Based on previous research with various types of equipment [27] [28], the USA firm Nu Cybertek, Inc. developed the PhabrOmeter, which affords automatic performance of the ring test on a circular fabric specimen, recording of the extraction–time curve, and processing of the curve to determine new quantities such as the “relative hand value”, “drape index” and “wrinkle recovery rate” [28]. The PhabrOmeter has been successfully used in several applications [30].
One other similar method determines the force required not to extract, but rather to insert a fabric, paper, or plastic film specimen through a ring or
slot. This method is typically used to measure the softness of sanitary paper with the aid of a Handle-O-meter [31] [32] and that of textiles with a Handmeter [33]. The latter, however, has scarcely been used to date.
OBJECTIVES
The primary aim of this work was to simplify the ring test by using a fixed ring diameter and thickness in order to allow the textile industry to readily assess any type of woven fabric with a conventional dynamometer. The ensuing, “UPC ring method” should allow various hand-related properties including fabric tailor ability or drape to be determined without the need for the sophisticated, sluggish, expensive equipment typically needed for these measurements. The method was developed by examining the relationships between mechanical properties of commercial woven fabric specimens as measured with both the FAST method and the proposed modified version of the ring test.
Despite their conceptual complexity, the original ring test and its existing versions require adjusting the measuring conditions (ring material and dimensions) to the particular fabric type or, alternatively, finding reference values for comparison. Also, the measuring head is not always mounted on a conventional dynamometer, so specific equipment and software are often needed.
EXPERIMENTAL
A total of 42 specimens spanning a wide range of commercially woven drapery, shirt making, and lining fabrics differing in type, composition, aerial weight (50–447 m2/g), weave type and density (data not shown) were tested with the FAST method and the proposed (UPC ring) method, as reported in Table I.
TABLE I. Composition of the studied fabrics.
Composition Number of specimens
100% Wool 3
Wool and wool blends 8
100% Cotton 5
Cotton and cotton blends 2
Linen and linen blends 4
Polyester/Viscose 4
Polyester/Viscose (Lining) 6
100% Polyester (Lining) 6
100% Viscose (Lining) 2
Acetate and blends (Lining) 2
The measuring head used in the UPC Ring Method was a 4 mm thick stainless steel ring of circular cross-section attached to an external support. The ring was placed under the vertical of the upper jaw of a conventional dynamometer (pre-calibrated position). The fabric specimens used were circles 30 cm in diameter. This diameter was used in order to find a universal dimension allowing passage of a wide variety of commercial fabrics by applying a reasonable amount of force. The ring was made from a rod of circular section in order to minimize potential effects of fabric friction with the ring on specimen extraction force while maximizing those of intrinsic multiaxial deformation in the fabric. Testing revealed that a ring 4 mm thick and 36 mm in inner diameter fulfilled the previous requirements.
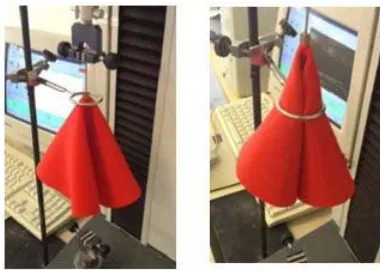
In each test run, a specimen was pierced through its geometric center with a rigid metal needle 80 mm long and 2 mm thick. An inverted T-piece was used to retain the specimen at the bottom. The metal needle was held in place by the dynamometer upper jaw (see Figure 1, which shows the specimen at the beginning of the test). After the dynamometer was started, the upper jaw was raised at 100 mm/min. The fabric was not yet in contact with the ring, so the extraction–displacement curve had a zero slope; however, as soon as the specimen started to touch the ring (see Image 3 in Figure 3), the curve rose with a slope dependent on the particular extraction force applied. The test was finished once the whole specimen had passed through the ring.
The dynamometer recorded the extraction– displacement or extraction–time curve for each specimen in order to determine the time elapsed between the start of the test and the point where the specimen first came into contact with the ring (Figure 2).
This point in the recording corresponds to the distance h in Image 3 of Figure 3, which is related to the fabric drape. In addition, the dynamometer allowed calculation of the maximum extraction force and the time needed to reach it.
FIGURE 1. Experimental sequence of the UPC ring method. (Left) Start of the test. (Right) During the test.
FIGURE 2. Extraction–displacement curve for specimen B2482.
FIGURE 3. Stages of the UPC ring method.
a) Maximum extraction force, Fmax (mN).
b) Time or displacement needed to reach Fmax
(mm).
c) Distance h(mm) between the starting point of the test and that where the specimen first touched the ring (see Image 3 in
Figure 3).
d) Ratio of h to ring radius (h/r).
e) Contact angle, a(º) (see Image 1 in Figure 3).
All tests were performed under standard atmospheric conditions and all specimens were previously conditioned at the Textile Physics Laboratory of the Department of Textile and Paper Engineering of the Polytechnical University of Catalonia (UPC).
RESULTS AND DISCUSSION
The specific parameters determined with the FAST and UPC ring methods are shown in Table II and
Table III, respectively.
Canonical correlation analysis is a descriptive technique allowing the relationships between two sets of variables designated x and y for purely denominative purposes to be explored. The relationships are quantified via canonical variables that are linear combinations of the actual typified variables:
ui = ai1x1 + ai2x2 + + aipxp (1a)
vi = bi1y1 + bi2y2 + … + biqyq (1b)
The coefficients in the previous equations are chosen in a sequential manner: once the most highly correlated values for u1 and v1 are found, the (u2 , v2) ) pair with the highest correlation not exceeding that of the first —provided the latter variables are uncorrelated to all others— is sought and the procedure repeated until the last pair (ur , vr) is processed.
The maximization step can be summarized as follows:
Let x be a random vector of dimension p and y one of dimension q.
Let Sxx be the variance–covariance matrix for x and
Syy that for Y.
Let U = ax and V = by be a linear combination of
x and y, respectively.
The correlation between the canonical variables Eq. (2) will be given by
(2)
where ru,vis to be maximized under the following
constraints Eq. (3a) and Eq. (3b):
a Sxxa = 1 (3a)
b Syyb = 1 (3b)
The solution a can be obtained by calculating the eigenvectors associated to the eigenvalues of the characteristic equation for the matrix S S S Sxx1 xy yy1 yx
. Likewise, b can be obtained by calculating the eigenvectors associated to the eigenvalues of the characteristic equation for S S S Syy1 yx xx1 xy
. The eigenvalues i(i=1r) are the squares of the correlations between the canonical variables (denoted by R2) and represent the amounts of variance shared by the two canonical variables.
Once the canonical correlation analysis is completed, significantly related variables, whether dependent or independent, can be selected further analysis with exclusion or inclusion of the others.
In this work, we denoted the body of parameters for the FAST and UPC Ring methods by the variables
TABLE II. Parameters determined with the FAST method.
Parameter Description
Overall formability (F, mm2) Capacity of absorbing lengthwise compression 100% warp extensibility (WpE100, %) Warpwise stretch
100% weft extensibility (WeE100, %) Weftwise stretch
Bias extensibility (%) Biaswise stretch
Overall bending rigidity (BR, N·m) Bending resistance (cantilever method) Difference in BR between warp and weft (BRWp – BRWe) Difference between the two quantities
Shearing strength (G, N/m) Resistance to lateral distortion
Relative compressibility (RC, %) [(Thickness at 2 gf – Thickness at 100f)/Thickness at 2 gf] × 100
TABLE III. Parameters determined with the UPC ring method.
Parameter Description
Overall contact height (h, mm) See Image 3 in Figure 3
Ring thickness-to-radius ratio (h/r) Ratio between the two quantities
Contact angle, (°) See Image 3 inFigure 3
Maximum extraction force (Fmax, mN) Maximum force needed to extract the specimen from the ring Distance to maximum force (DFmax, mm) Distance from the starting point of the test to that where Fmax is reached
TABLE IV. Canonical correlation between FAST and UPC Ring variables.
Number R2 Correlation 2 DF p
1 0.965308 0.982501 0.003972 187.962 40 0.0000
2 0.705235 0.839782 0.114515 73.679 28 0.0000
TABLE V. Coefficients of the canonical variables of the FAST test (first set).
Parameter Variable u1 u2
F X1 0.590030 –0.055190
WpE100 x2 –0.107122 0.487352
WeE100 X3 –0.057508 0.731357
BE x4 –0.022615 –0.154711
BR x5 0.431553 –0.390179
BRWp – BRWe x6 0.097874 0.098644
G x7 0.080426 0.114457
RC x8 0.099461 0.038823
TABLE VI. Coefficients of the canonical variables of the UPC ring method (first set).
Parameter Variable v1 v2
h y1 0.171664 1.306970
h/r y 2 0.168913 0.320043
y 3 0.207683 0.282589
Fmax y 4 1.159850 0.309771
DFmax y 5 –0.110071 0.243814
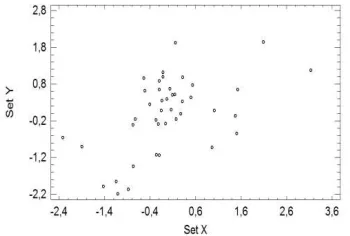
Figure 4 and Figure 5 are scores plots for the two sets of variables (x and y) as obtained from the canonical variables u1 and v1, and u2 and v2,
respectively.
FIGURE 4. Scores between variables in set x (x1, x2, x3, x4, x5, x6, x7, x8) and set y (y1, y2, y3, y4, y5) as obtained from the canonical variables u1 and v1.
Coefficients aij and bij are the standardized weights
for each canonical variable and represent their relative contributions to the theoretical (canonical) values. Based on the magnitude of these coefficients alone, the contribution of x to u1 decreases in the sequence x1 > x5 > x2 > x8 > x6 >
x7 > x3 > x4and that of y to v1 in the sequence y4 >
y3 > y1 > y2 > y5. Similarly, the contribution of x to
u2 and that of y to v2 vary in the following
sequences: x3 > x2 > x5 > x4>x7 > x6 > x1 > x8 and
y1 > y2 > y4 > y3 > y5. However, it is more
convenient to describe the canonical variables in terms of their correlations with the original variables, x and y(i.e., their canonical loads rather than their coefficients). Table VII lists the direct and cross loads of the first two canonical variables.
TABLE VII. Direct and crossed canonical loads of the first two canonical variables.
Parameter Variable u1 u2 v1 v2
F x1 0.881259 –0.285763 0.865838 –0.239979
WpE100 x2 0.150031 –0.729277 0.147405 –0.612434
WeE100 x3 0.315824 –0.828324 0.310298 –0.695612
BE x4 –0.211843 –0.095045 –0.208136 –0.079817
BR x5 0.945913 0.162302 0.929360 0.136298
BRWp – BRWe x6 0.431498 0.246638 0.423948 0.207123
G x7 0.183395 –0.113030 0.180186 –0.094920
RC x8 0.445191 –0.446294 0.437400 –0.374790
H y1 –0.382128 –0.745707 –0.388934 –0.887976
h/r y2 0.470257 0.583003 0.478633 0.694230
y3 –0.367978 0.246166 –0.374532 0.293131
Fmax y4 0.961459 –0.058774 0.978584 –0.069987
DFmax y5 0.636485 –0.423163 0.647821 –0.503896
As can be seen from Table VII, u1 was highly
correlated with BR (0.945913) and F (0.881259), and so was u2 with WpE100 (–0.828324) and WeE100
(-.729277). Similarly, v1 was highly correlated with
Fmax (0.978584) and somewhat less so with DFmax
(0.6478211). Finally, v2 was highly correlated with h
(–0.887976) and less markedly s o with the h/r
(0.694230). These results suggest that the canonical variable u1 explains “shaping” in the studied
materials, u2 extensibility, and v1 and v2 “handle” and
“drape” in the ring method.
Also, based on the canonical cross-loads of Table VII,
u1 was highly correlated with Fmax (0.961439) and
also, to a lesser extent, with DFmax (0.636485); and so
was u2 with h (–0.745707) and the h/r
(0.58303).Similarly, v1 was highly correlated with BR
(0.929360) and F (0.865838), and v2 with WpE100 (–
0.695612) and WeE100 (–0.612434).
The previous canonical loads were used to calculate the corresponding redundancies. The total variance in the eight x variables explained by five y variables was 41.4% and that in the five y variables explained by the eight x variables was 59.4%.
Based on these loads, u1 can seemingly be described
in terms of F and BR, and v1in terms of Fmaxa n d
DFmaxEq. (4a) and Eq. (4b). Subsequent analysis of
the x (F, B R ) and y (Fmax, DFmax) groups yielded the
following pair of variables with a canonical correlation coefficient of 0.954315 and a redundancy of 78.5% for x and 70.4% for y:
u1 = 0.58301·F + 0.492647·BR (4a)
v1 = 0.981225·Fmax + 0.0256056·DFmax (4b)
Based on these loads, u2can be described in terms
of WpE100 and WeE100 Eq. (5a) and Eq. (5b), and so can v2in terms of h and the h/r. Subsequent
analysis of the x (WpE100, WeE100) and y (h, h/r) groups yielded the following pair of variables with a canonical correlation coefficient of 0.640159 and a redundancy of 29.7% for x and 21.9% for y:
u2 = 0.570394·WpE100 + 0.604879·WeE100 (5a)
v2 = 1.888027·h + 1.1343·(h/r) (5b)
Figure 7 is a plot of scores between the canonical variables.
FIGURE 6. Scores between variables in set x (x1,x5) and set y (y4,y5) as obtained from the canonical variables u1 and v1.
FIGURE 7. Scores between variables in set x(x1,x5) and set y (y4,y5) as obtained from the canonical variables u2 and v2.
Eq. (4a), Eq. (4b), Eq. (5a) and Eq. (5b) describe the relationships between the body of parameters of the FAST method and that of the UPC Ring method. Although these equations can be used for prediction, it is more practical to use regressions on the original variables instead for this purpose.
For predictions, the variables of the FAST method are ranked as dependent variables (y) and those of the UPC ring method as independent variables (x). This is so because the UPC Ring method is more universal
in scope (it only requires a dynamometer, which is usually available in textile laboratories, for implementation), so it affords easier control of its variables and their use to predict FAST variables.
Regressing the FAST variable F and the UPC Ring variables Fmax and DFmax required transforming F in
order to correct for deviations from the linear model hypothesis. We used the Box–Cox power transformation for this purpose. The value minimizing the sum of residual squares of the model fitted with Y2 was 0.313.
Previously, the origin of F was displaced by 0.03122, which was the point where this parameter started to exceed 0. The regression Eq. (6) for the resulting response variable was
F* = –0.517111 + 0.000108106·Fmax
+ 0.0345987·DFmax (6)
Table VIII shows the results of the analysis of the coefficients of Eq. (3) and Table IX that of the variance of the regression. The corrected coefficient of determination was 90.757%.
The FAST variable BR was regressed on the UPC Ring variables Fmaxand DFmax by using the Box–
Cox transformation with = 0.021. The resulting regression Eq. (7) was:
BR* = 1.027274 + 0.00000958131·Fmax –
0.000965294·DFmax (7)
Table X shows the analysis of the coefficients of Eq. (7) and Table XI those of the r egr essio n variance. The corrected coefficient of determination was 66.7893%.
The FAST variable WpE100 was regressed on the UPC Ring variables h and h/r by using the Box– Cox transformation with = 0.068. The resulting Eq. (8) was:
WpE100*= 0.654607 + 0.032523·h +
0.0478099·(h/r) (8)
Table XII shows the analysis of the coefficients of Eq. (8) and Table XIII those of the regression variance. The corrected coefficient of determination was 28.940%.
WeE100* = 1.02499 + 0.00593136·h (9) Table XIV shows results of the analysis of the coefficients of Eq. (9) and Table XV those of the regression variance. The corrected coefficient of determination was 23.4335%.
TABLE VIII. Analysis of the coefficients of Eq. (4a) and Eq. (4b).
Parameter Estimate Standard error T p
Constant –0.517111 0.336351 –1.537410 0.1323
Fmax 0.000108 0.000025 4.272500 0.0001
DFmax 0.034598 0.010779 3.209550 0.0027
TABLE IX. Analysis of the variance of F* vs Fmax and DFmax.
Source Sum of squares DF Mean square F-ratio p
Model 3.81359 2 1.90679 51.46 0.0000
Residual 1.44497 39 0.037050
Total 5.25856 41
TABLE X. Analysis of the coefficients of Eq. (7).
Parameter Estimate Standard
error T p
Constant 1.07274 0.0170364 62.9674 0.0000
Fmax 0.000009 0.000001 7.47603 0.0000
DFmax –0.000965 0.000546 –1.7679 0.0849
TABLE XI. Analysis of the variance of BR* vs F
max and DFmax.
Source Sum of squares DF Mean square F-ratio p
Model 0.008027 2 0.004013 42.23 0.0000
Residual 0.003707 39 0.000095
Total 0.011734 41
TABLE XII. Analysis of the coefficients of Eq. (8).
Parameter Estimate Standard
error T p
Constant 0.654607 0.112311 5.82853 0.0000
h 0.032523 0.008405 3.86925 0.0004
h/r 0.047809 0.018149 2.63427 0.0120
TABLE XIII. Analysis of the variance of WpE100* vs h and h/r.
Source Sum of squares DF Mean square F-ratio p
Model 0.0860188 2 0.043009 9.35 0.0005
Residual 0.179416 39 0.004600
Total 0.265435 41
TABLE XIV. Analysis of the coefficients of Eq. (9).
Parameter Estimate Standard
error T P
Intercept 1.02499 0.012892 79.5011 0.0000
Slope –0.005931 0.001611 –3.68079 0.0007
TABLE XV. Analysis of the variance of WeE100* vs h.
Source Sum of squares DF Mean square F-ratio p
Model 0.011962 1 0.011962 13.55 0.0007
Residual 0.035316 40 0.000882
Journal of Engineered Fibers and Fabrics 139 http://www.jeffjournal.org CONCLUSIONS
The exploratory study conducted in this work allowed us to relate the FAST test to the proposed UPC Ring method by correlating their parameters. The results obtained here afford the following conclusions:
Fabric formability (F), bending rigidity (BR), maximum extraction force (Fmax) and
the times needed to reach it (DFmax) are
the individual parameters most markedly contributing to correlation between the FAST and UPC ring methods. The canonical correlation between these variables is 0.95.
Full (100%) extensibility (WpE and
WeE), the distance between the specimen position at the start of the test and the point where it touches the ring (h), and the ratio of h to the ring radius (h/r) exhibit a canonical correlation of 0.64.
The previous correlations account for the facts that the three-dimensional molding of fabrics is correlated with their handle, and so is extensibility with drape.
Based on the regression equations between the main FAST and UPC Ring variables as identified from their canonical correlations,
Fmax and DFmax explain 95.75% of the
variance in fabric formability (F) and 66.79% of that in bending rigidity (BR). Also, h and the h/r explain 28.94% of the variance in 100% warp extensibility (WpE) and 23.43% of that in 100% weft extensibility (WeE).
The UPC Ring method provides a more universal alternative to the determination of some FAST parameters in a more simple economical than the FAST method itself. Thus, the proposed method allows the determination of such an important property as fabric formability (F), which could only be assessed with the FAST method before.
ACKNOWLEDGEMENTS
The authors are grateful to Mercedes Escusa, of the Textile Physics Laboratory of the UPC’s Department of Textile and Paper Engineering for her help in conducting UPC Ring tests.
REFERENCES
[1] Mogahzy, Y.E., Kilinc, F.S., Hassan, H. Developments in measurement and evaluation of fabric hand. pp 45–65. In: “Behery H.M. Effect of mechanical and physical properties on fabric hand”. Woodhead Publishing in Textiles. Cambridge 2005.
[2] Kawabata, S. The standardization and analysis of handle evaluation. The Textile Machinery Society of Japan. 1980. Osaka, Japan. [3] De Boss A., Tester, D.H. A system for fabric
objective measurement and its application in fabric and garment manufacture. CSIRO Report No. WT92.02. 1994.
[4] Grover, G., Sultan, M.A., Spivak, S.M. A screen technique for fabric handle. Journal of Textile Institute, 84 (3), 1993, pp 1–9. [5] Alley, V.L., McHatton, A.D. Nozzle Extraction
Process and Handlemeter for Measuring Handle. United States Patent 4,103,550. August 1, 1978.
[6] Soliman, H.A., Sultan, M.A., Sheta, A.M. The Bulletin of Faculty of Engineering. 23: 115. 1984. Alexandria University.
[7] Sultan, M. Sheta, A. Predicting fabric hand acceptance for a specific end-use. Textile Information Bulletin, 36 (4), 1994, 57-64. [8] Pan, N., Yen, K.C., Zhao, S.J., Yang, S.R. A
new approach to the objective evaluation of fabric hand from mechanical properties. Part II: Objective measure for total handle. Textile Research Journal, 58. 1988, pp 438–444. [9] Kim, J., Slaten, B.L. Objective assessment of
fabric handle in fabric treated with flame retardants. Journal of Testing and Evaluation, 24, 1999, pp 223–228.
[10] Killinc, F.S. A Study of the Nature of Fabric Comfort: Design-oriented Fabric C o m f o r t Model. PhD Thesis. Auburn University, USA. 2004.
[11] Hassan, M. Computer-based System for Evaluation and Recognition of the Structural a n d Surface Characteristics of Fabrics. PhD Thesis. Al Mansoura University, Egypt. 2004.
[13] Mogahzy, Y.E., Broughton, R., Wang, Q. The friction profile of cotton fibers and its importance in determining fiber performance in the nonwoven process. Part II: Experimental observations. International Nonwoven Journal 7(1), 1995, pp 26–33.
[14] Hennrich, L., Seidel, A., Reider, O.
Griffprüfung au Maschenwaren. Maschen Industrie, 7, 1999, pp 46–47.
[15] Seidel, A. Griffgewertung von Strumpfwaren mit dem ITV-Griff-Tester. Melliand Textilberichte, 6, 2001, pp 491–494.
[16] Martisiutè, G., Gutauskas, M. A new approach to evaluation of fabric handle. Materials Science. Vol. 7 No 3, 2001, pp 186–190. [17] Strazdiene, E., Gutauskas, M. New method for
the objective evaluation of textile hand. Fibres and Textiles in Eastern Europe. Vol. 13 No. 2, 2005, pp 35–38.
[18] Strazdiene, E., Ben Saïd, S., Gutauskas, M., Schacher, L., Adolphe, D.C. The evaluation of fabric treatment by Griff tester and sensory analysis. International Journal of Clothing Science and Technology. Vol. 18, No. 5, 2006, pp. 326–334.
[19] Daukantiene, V., Papreckiene, L., Gutauskas, M. Simulation and application of the behaviour of the textile fabric while pulling through a round hole. Fibres and Textiles in Eastern Europe. Vol. 11, No 2 (41), 2003, pp 37–41. [20] Strazdiene, E., Martisiutè, G., Gutauskas, M.,
Papreckiene, L. Textile Hand: A new method for textile objective evaluation. Journal of Textile Institute, 94, Part 1, No. 3–4, 2003, pp 245–255.
[21] Grineviciute, D., Gutauskas, M. The comparison of methods for the evaluation of woven fabric hand. Materials Science, Vol. 10, no. 1, 2004, pp 97–100.
[22] Juodsnukyte, D., Gutauskas, M, Krauledas, S. Influence of fabric softners on performance stability of textile materials. Materials Science. Vol. 11, No 2, 2005, pp. 179–182.
[23] Grineviciute, D., Daukantienè, V., Gutauskas, M. Textile Hand: comparison of two evaluation methods. Materials Science, Vol. 11, No 1, 2005, pp 57–63.
[24] Truncyte, D., Papreckiene, L., Gutauskas, M. Behaviour of textile membranes while being pulling through a hole by the constrained method. Fibres and Textiles in Eastern Europe, Vol. 15, No 1, 2007, pp 50–54.
[25] Hasani, H., Planck, H. Analysis of the physical fundamentals of an objective integral measuring system for the determination of the handle of knitted fabrics. Fibres and Textiles in Eastern Europe, Vol. 17, No 6, 2009, pp 70–75.
[26] Hasani, H. Novel method to evaluate the low-stress shearing behaviour of knitted fabrics. Fibres and Textiles in Eastern Europe, Vol. 18, No 2, 2010, pp 70–72.
[27] Pan, N., Zeronian, S.H., Ryu, H.S. An alternative approach to the objective measurement of fabrics. Textile Research Journal, 63, 1993, pp 33–43.
[28] Pan, N. Quantification and evaluation of human tactile sense towards fabrics. International Journal of Design & Nature, Vol. 1, No 1, 2007, pp 48–60
[29] Nu Cybertek Inc. http://www.nucybertek.com, accessed August 20, 2012.
[30] Wang, H., Mahar, T.J., Hall, R. [2012). Prediction of the handle characteristics of lightweight next-to-skin knitted fabrics using a fabric extraction technique. Journal of Textile Institute, Vol. 13, No 7, 2012, pp 691–697.
[31] Twing–Albert Instrument Company. Clupak Fabricometer. Philadelphia, P.A. Trade literature. 1970.
[32] Thwing–Albert Instrument Company.
Información técnica del Handle-O-Meter.
http://www.thwingalbert.com/handle-o-meter.html, accessed August 22, 2012.
[33] Dent, R.W., Oatfield, J.C., Mayes, R.T. Fabric Characterising Apparatus. U.S. Patent 3,613,445. 1971.
[34] Dillon, W.R.; Goldstein, M. Multivariate Analysis: Methods and Applications. 1984, Wiley. New York.
AUTHORS’ ADDRESSES Enric Carrera-Gallissà, M.D. Xavier Capdevila, PhD Josep Valldeperas, PhD
Universitat Politècnica de Catalunya Colom, 15