Vol. 3 Issue 2, February - 2017
Improved Feature Weight Calculation Methods
Based on Part-of-Speech in Text Classification
Yonghe Lu
School of Information Management Sun Yat-sen University
Guangzhou, China [email protected]
Danqing Huang
School of Information Management Sun Yat-sen University
Guangzhou, China
Hongbin Wang
School of Information Management Sun Yat-sen University
Guangzhou, China
Abstract—With the development of Information Technology and the increasing number of electronic documents, as a large-scale text information processing means, text classification attracts more and more attention on researchers. In order to obtain better performance in text classification works, two methods on improving the feature weight calculation by introducing the influence of part-of-speech are proposed, one is Single-Part-of-Speech (SPOS) and the other is Multi-Part-of-Speech (MPOS). Contrast experiments between the improved feature weight calculation methods and the original TF-IDF method are conducted. In terms of the improved approaches, the part-of-speech weights are optimized by the Particle Swarm Optimization algorithm. Besides, in order to prove that the improved methods are applicable, Reuters-21578 is used as the corpus in the experiment. The experiment results demonstrate that the improved feature weighting methods perform better than the original TF-IDF method by achieving higher precisions at different dimensions of feature space. In addition, MPOS method works more effectively than SPOS method. Through the in-depth analysis we can also find out that both noun and verb have certain extent of influence, but noun contributes relatively more to classification.
Keywords—Text Classification; Part-of-Speech; Particle Swarm Optimization; Feature Weight;
I. INTRODUCTION
Text classification is an extensively used technique in the fields of data mining and artificial intelligence. So far, researchers have made a lot of improvements on various aspects of text classification. For instance, some researchers redesigned the traditional classification algorithms such as KNN, SVM, Naive Bayes to fix their intrinsic defects, and some researchers made studies on the grammar information [1] as well as the semantic information of the features to make the features represent the texts more properly. As part-of-speech contains the grammar information of features, it has the potential to optimize the representation of texts and improve the performance of
text classification finally. Therefore, in this paper, we are going to introduce the part-of-speech into the process of text classification, and try to demonstrate its ability to make positive influence on classification. At the same time, improved feature weight calculation methods including the part-of-speech weight are going to be proposed.
II. RELATED WORKS
A. Part-of-Speech Studies
In text-mining studies and experiments, several pre-processing procedures such as word segmentation, part-of-speech tagging and part-of-speech filtering are ought to be conducted. English texts are comprised of separated single words, so the word segmentation process can be skipped and part-of-speech tagging process should be the first step. Focusing on how to construct a model for part-of-speech tagging with high efficiency, lots of researches had been launched. For example, Z. Song [2] and F. Shamsi [3] adopted HMM (Hidden Markov Model) as the part-of-speech tagging method, and J. Gimerez [4] used CRF (Conditional Random Fields) as the model.
Basically, automatic part-of-speech tagging demands the system for part-of-speech analyzing and the norm of the tags. In this paper, we decided to use Stanford POSTagger [5,7] for auto-tagging the texts, which contains a standardized tag list and performs remarkably on tagging.
As a sort of grammar information, part-of-speech are widely used for dependency parsing as well as automatic abstracting [6], while in the field of text classification, part-of-speech studies are mainly emphasizing on short text classification [7] and sentimental analysis [8]. A. C. Fang [9] proved that corpora with abundant part-of-speech tagging are more likely to achieve better classification results, which was because of the rich language information that lies in the text sets, whereas G. Wang [10] demonstrated that part-of-speech is of significance in Chinese sentimental analysis as well as context identification.
Vol. 3 Issue 2, February - 2017 the description of features can get a higher classification
precision on Portugal corpora, and M. Zampieri [12] probed into the difference of contribution that part-of-speech makes in Spanish, Argentinian, Mexican and Peruvian corpora. Nevertheless, in long text classification, part-of-speech studies are majorly concentrating on part-of-speech filtering, an important part of pre-processing procedure. S. Chua [13] and T. Masuyama [14] both pointed out that limiting the part-of-speech selection of features can promote the efficiency of classification, and at the same time maintain its performance. Moreover, A. C. Tantug [15] and L. Asker [16] confirmed the positive effect that part-of-speech filtering makes, and R. J. N. Pise [17] further demonstrated that feature space with part-of-speech information may achieve better results comparing to what by means of stemming in English text classification.
However, although these researches agree on the view that filtering the parts-of-speech during the pre-process can improve not only the efficiency but also the performance of classification, they deal with the features of different parts-of-speech in the same way. Therefore, analyses on how the words with different parts-of-speech attach importance to the classification based on the semantic aspect can be made, and then improved methods of feature weight calculation can be brought forth.
B. Feature Weight Calculation
Before calculating the feature weight, it’s essential to select the model for text representation. Although Boolean Model [18] and Probabilistic Model [19] are decent ways to represent the texts, we still decide to choose the most widely used text representation model: Vector Space Model (VSM) [20], to display the texts.
In VSM, each vector represents a text, and each dimension of a vector stands for a single feature. Therefore, each text is represented by a specific amount of features. In addition, the value of each dimension means the weight value of a feature, so that we can assign a value for each dimension via a certain feature weight calculation method to represent the importance of each feature.
The most popularly used feature weight calculation method in VSM related studies is still TF-IDF (Term Frequency – Inverse Document Frequency), which was proposed by G. Salton [21]. TF is usually written as tf(t,d), which means the frequency that term t exists in document d, and IDF plays the role of describing a specific term’s distribution among the text set. How the TF-IDF method values the feature weight is showed as (1).
𝑤(𝑡, 𝑑) = 𝑇𝐹𝐼𝐷𝐹 = 𝑡𝑓(𝑡, 𝑑) ∗ 𝑙𝑜𝑔(𝑁
𝑛𝑡+ 0.01) (1)
Where w(t,d) means the weight of feature t in document d, which equals to the TF-IDF value, the product of TF and IDF. IDF is often displayed as a logarithm, in which N represents the number of texts in the feature space, and nt stands for the number of texts
that contains feature t.
As a matter of fact, because there is difference on the text length, the values of feature weight have to be normalized. The formula of feature weight calculation with normalization is displayed as (2).
𝑤(𝑡, 𝑑) = 𝑡𝑓(𝑡,𝑑)∗𝑙𝑜𝑔( 𝑁 𝑛𝑡+0.01)
√∑ (𝑡𝑓(𝑡,𝑑))2∗[𝑙𝑜𝑔(𝑁 𝑛𝑡+0.01)]2 𝑡∈𝑑
(2)
There are lots of researches that improved TF-IDF method. F. Ren [22] combined TF-IDF with Inverse Class Frequency (ICF), which performs promisingly even on imbalanced data sets. Similarly, M. Emmanuel [23] presented a new TF-IDF-based method integrated with positive impact factor, which lies on the standpoint that features have impact on the performance of classification, and when a feature has positive influence on one category, it may accordingly have negative impact on another category. Moreover, Q. Luo [24] held that the implicit information of features like their semantic similarity with the category names should be exploited and taken into account in valuing the feature weights, and constructed an enhanced TF-IDF-based method which gained better results against the original TF-IDF method. From this perspective of view, we are able to hold that as the syntax information of features, part-of-speech should have a positive effect on classification and be considered in measuring the feature weights.
C. Particle Swarm Optimization
Particle Swarm Optimization, which derives from the group behavior of animals, is proposed by J. Kennedy and R. C. Eberhart [25] and abbreviated as PSO. As an algorithm based on swarm intelligence, PSO are proved to be of great potential and with huge space for improvement in Y. Shi’s [26] experiments. In fact, PSO has been popular among text processing researches since a very early time. M. G. Omran [27] brought forth an unsupervised image classification algorithm based on PSO, and D. W. van der Merwe [28] attempted to use PSO for data clustering works. With regard to text classification, PSO is mostly used in modifying the feature selection process. B. M. Zahran [29] improved the Arabic text classification in this way, and M. Rahimirad [30] considered SVM and combined PSO with it to improve the selection of feature. On top of these related researches, Z. Wang [31] even introduced a PSO-based classification algorithm typically for web document classification.
PSO itself is virtually a process that a group of particles searching for the best solution of the whole problem, as one “particle” is defined as the solution of a single problem. For each particle, its position and velocity are randomly initialized, and then it will move towards its personal best (pbest as its position) as well as the global best (gbest as its position) amongst all the particles. The velocity decides the direction and distance a particle moves, and the position is reflected by the fitness value which is decided by a specific optimization function.
Vol. 3 Issue 2, February - 2017 algorithm method for PSO. For each particle i, if we
define its velocity as vi=(vi1 ,vi2 ,…,viD)T, and express its
position as xi=(xi1 ,xi2 ,…,xiD)T, SPSO can be displayed
as (3).
{𝑣𝑖𝑑𝑡+1= 𝜔𝑣𝑖𝑑𝑡 + 𝑐1𝑟1(𝑝𝑏𝑒𝑠𝑡𝑖𝑑𝑡 − 𝑥𝑖𝑑𝑡) + 𝑐2𝑟2(𝑔𝑏𝑒𝑠𝑡𝑖𝑑𝑡 − 𝑥𝑖𝑑𝑡)
𝑥𝑖𝑑𝑡+1= 𝑥𝑖𝑑𝑡 + 𝑣𝑖𝑑𝑡+1
(3)
Where t means the current number of iteration times, vid and xid represent the velocity and the position of
particle i in dimension d. Besides, pbestid and gbestid
stand for the position of pbest and gbest in dimension d, and w represents the inertia weight, which plays an important role in the SPSO process. After that, c1 and c2
are the acceleration constants, whereas r1 and r2 are
random digits in specific interval.
III. IMPROVEMENT ON FEATURE WEIGHT CALCULATION
A. Analysis on Contribution of Parts-of-Speech
According to the related works, though lots of researches had taken into account the part-of-speech in text classification studies, they paid less attention on the influence of part-of-speech during feature selection or feature weight calculation. Undoubtedly, nouns, verbs as well as adjectives take more effect on classification, but obviously each kind of the three parts-of-speech makes different influence, thus part-of-speech can be considered into valuing the weight of features. It can be discussed in two aspects.
Firstly, different words with different parts-of-speech have different extents of contribution to classification. Nouns describe people, things, locations as well as abstract concepts while verbs describe various kinds of actions. Because of that, nouns represent the text more precisely than verbs in general. Take the word “football” and the word “play” for example. The word “football” usually occurs in the category of sports whereas the word “play” may appear in the category of sports as well as game. Hence, “football” plays a more significant role in classification. However, in some special cases, verbs may have more contribution than nouns. For instance, the word “book” can appear in many categories but the word “transact” should mainly appear in the texts of economy. Therefore, how much the words of a specific part-of-speech contributes to classification is ought to be exactly evaluated.
Secondly, identical words with different parts-of-speech also have different extents of contribution to classification. This should be paid high attention to as it’s possible that a word appears as different parts-of-speech in different sentences. For example, there are two sentences, “Tom is learning English hard” and “I’m keen on machine learning”. Both sentences contain the word “learning”, but they appear as different parts-of-speech. However, it may be implied that the noun “learning” is more important than the verb “learning”, as the noun “learning” often relates to the texts about education, and the verb “learning” can be related to many other kinds, like “learning how to drive cars”, “learning playing game”, etc. Therefore, the noun “learning” will contribute more to classification as it mainly represents the category “education”.
All in all, certain part-of-speech should have certain contribution on classification, so it’s reasonable that we
take into account the influence of part-of-speech to make the text classification works more effectively.
B. SPOS and MPOS Methods
According to the analysis, in order to measure the influence of different parts-of-speech, we bring forth the concept of “part-of-speech weight”, which represents the extent that one part-of-speech influences on text classification. With regard to different parts-of-speech, they should have different values of part-of-speech weight respectively to differentiate their contributions.
As mentioned, TF-IDF is an effective and practical method for feature weight calculation, thus it’s appropriate to combine the TF-IDF method with speech weight so as to consider the effect of part-of-speech information in representing texts and make improvement on the original TF-IDF method. To begin with, according to the part-of-speech of each feature, a model combining TF-IDF with part-of-speech weight is constructed, which is shown as (4).
𝑤(𝑡, 𝑑) = 𝑡𝑓(𝑡,𝑑)∗𝑙𝑜𝑔( 𝑁 𝑛𝑡+0.01)
√∑𝑡∈𝑑(𝑡𝑓(𝑡,𝑑))2∗[𝑙𝑜𝑔(𝑛𝑡𝑁+0.01)]2∗ 𝑥𝑖 (4)
Where i means the part-of-speech of feature t, xi
stands for the weight of i. The feature weight calculation method showed in (4) is named Single-Part-Of-Speech, abbreviated as SPOS. The SPOS method considers that each feature has only one part-of-speech. It is because in the pre-processing procedures, each term is tagged by its part-of-speech, thus in the feature selection procedure, each feature should contain a single term and its part-of-speech.
But as a matter of fact, one single term may appear as several parts-of-speech. Therefore, the SPOS method is not able to make full use of the part-of-speech information of one single term. Based on this, we build another feature weight calculation model to link different parts-of-speech together and make full use of them, which can be represented as (5).
𝑤(𝑡, 𝑑) = 𝑡𝑓(𝑡,𝑑)∗𝑙𝑜𝑔(
𝑁 𝑛𝑡+0.01)
√∑ (𝑡𝑓(𝑡,𝑑))2∗[𝑙𝑜𝑔(𝑁
𝑛𝑡+0.01)] 2 𝑡∈𝑑
∗ ∑𝑛𝑖=1𝑥𝑖∙ 𝑃(𝑡𝑖|𝑡) (5)
Where tirepresents the number of times that feature
t appears as part-of-speech i in the whole text set. All in all, the contribution of the part-of-speech is depicted as the summation of the product of the part-of-speech weight of i and the conditional probability that feature t appears as part-of-speech i in the whole text set. The feature weight calculation method showed in (5) is named Multi-Part-Of-Speech, abbreviated as MPOS.
In short, SPOS method considers the term along with its part-of-speech as a single feature, whereas MPOS method takes a single term which may have various parts-of-speech as a single feature
C. PSO Parameter Settings
Vol. 3 Issue 2, February - 2017 going to be filtered out, so each particle will have three
dimensions and its position can be represented as (6).
𝑥𝑖
⃗⃗⃗ = (𝑥𝑖1,𝑥𝑖2,𝑥𝑖3) (6)
Where xi1 represents the part-of-speech weight of
noun, xi2 represents the part-of-speech weight of verb
and xi3 stands for the part-of-speech weight of adjective.
For all the part-of-speech weights, their value should be confined in the interval [0, 1]. If the value goes beyond the interval, it should be assigned as the boundary value (0 or 1). Additionally, the fitness function corresponding to PSO is going to be set as the precision of classification, as we aim to improve the performance of text classification. It can be displayed as (7).
Fitness() = Precision =𝑇𝑐
𝑇𝑎 (7)
Where Tc means the number of texts that are
correctly classified, Ta links to the number of all the texts
in the text set.
As mentioned, SPSO is selected as the PSO method to optimize the part-of-speech weight values. In this paper, inertia weight w is assigned as 0.8, acceleration constants c1 and c2 are both assigned as 2,
and r1 and r2are randomly valued in the interval [0, 4].
Meanwhile, number of particles is set as 15 and the max number of iteration times is set as 20.
IV. EXPERIMENTS AND ANALYSIS
A. Experiment Design
In the study of English language, each of the English words is corresponded to a stem, and different words may correspond to a single stem. For example, the word "happy" and the word "happiness" correspond to the stem "happ". By transforming a stem in different ways, we are able create words on different parts-of-speech. Therefore, before processing the MPOS method, we should extract stems from the words and calculate the probability of frequency on different parts-of-speech of each stem. In order to compare the results of SPOS method and MPOS method, experiments on improved feature weight calculation are designed respectively. On account of the different pre-processing ways, the feature space is constructed by complete words in the SPOS method experiment, and in the MPOS method experiment it is constructed by stems.
In the field of English text stemming, Porter Algorithm [32] is the most extensively used stemming method, which is introduced by Martin Porter in 1979. In the following experiments, Snowball Algorithm [33], which is based on the Porter Algorithm, is going to be used for text stemming.
Consequently, the procedure of the SPOS and MPOS experiments can be designed as following:
Objective: Test the effectiveness of SPOS method and MPOS method, then use PSO to optimize the part-of-speech weights and use SVM to calculate the precision of SPOS method and MPOS method. After that, compare the precision among the SPOS method, the MPOS method and the original TF-IDF method and make an analysis on the value of part-of-speech weights.
Environment: JDK 8 with Python 3.5, Eclipse IDE, Win7 64x 4GB Memory
Input: Training Text Set, Testing Text Set, Number of Particles n, Max Number of Iteration Times T
Output: Optimized Part-of-Speech Weights, Precision of Text Classification
Step I: Tag the part-of-speech of each words existed in the training set by Stanford-Tagger.
Step II: Filter out the words of other parts-of-speech and retain the words of nouns, verbs and adjectives as the original feature set (SPOS method). Use Snowball to extract the stem of each word, calculate the probability of frequency on different parts-of-speech of each stem, including noun, verb and adjective (MPOS method).
Step III: Use IG (Information Gain) as the feature selection method to select a specific number of words or stems for feature space construction.
Step IV: Use random functions to set the initial values for all dimensions xid of each particle as the
primitive part-of-speech weights. Use the SPOS method to calculate the feature weights and use SVM to do classification. Set the position of the particle with the maximum fitness as global best, then for each particle set its position as personal best.
Step V: Update velocity and position of the particles according to (3).
Step VI: For each particle, if the fitness on current position gains a higher value than the fitness on personal best, set the current position as personal best. Then, if the fitness on personal best achieves a higher value than the fitness on global best, set the personal best as the global best.
Step VII: Count the number of iteration times. If the number attains T, end the process and set the global best as the best solution of part-of-speech weights, then set its fitness as the final precision of classification. Otherwise, return to Step V.
Step VIII: Compare the classification performance with the original TF-IDF method. In the meantime, analyze the values of part-of-speech weights.
Additionally, in order to evaluate the result of improved methods properly, a series of sub-experiments are contained in each experiment, and the final results of each experiment are to be the best result of these sub-experiments. Therefore, the highest precision and its corresponding part-of-speech weights are to be recorded.
B. Text Classification Based on SPOS Method
Vol. 3 Issue 2, February - 2017 conducted the SPOS method experiment and obtained
the results, as shown in Table I, Table II, Table III, and Fig. 1.
TABLE I. PRECISIONS AT DIFFERENT FEATURE DIMENSIONS ON TF-IDF AND SPOS METHODS
Feature Dimension
Precision
TF-IDF SPOS
50 0.8156 0.8267
100 0.7278 0.8600
200 0.8812 0.8987
400 0.8544 0.8678
600 0.7962 0.8355
800 0.7694 0.8133
1000 0.7939 0.8133
TABLE II. MACF1 VALUES AT DIFFERENT FEATURE DIMENSIONS ON
TF-IDF AND SPOS METHODS
Feature Dimension
MacF1 Value
TF-IDF SPOS
50 0.7390 0.7002
100 0.6677 0.6929
200 0.8135 0.8120
400 0.7808 0.7389
600 0.7842 0.7280
800 0.7842 0.7477
1000 0.6753 0.7754
TABLE III. PAIRED SAMPLE T-TEST RESULTS OF THE PRECISIONS OF TF-IDF AND SPOSMETHODS
t df Sig. (two-sided) TF-IDF—SPOS -2.445 6 0.050
Fig. 1. Precision Line Chart of SPOS Method Experiment
As shown in Table I, Table III and Fig. 1, compared with TF-IDF method, SPOS method achieved relatively higher classification precisions, and the results are able to be statistically significant in the 90% confidence interval due to the small size of precision data sample. It is clear that SPOS method has the capability to perform advantageously in text classification works, and also demonstrates that part-of-speech does affect the
quality of classification. Besides, the precisions of SPOS method were all higher than 80%, and at feature dimension 200 the precision was nearly 90%, which reveals that SPOS method attains a good level in classification. However, as we can see in Table II, compared with SPOS method, TF-IDF method achieved higher MacF1 values at feature dimension 50,
200, 400, 600, 800. All in all, SPOS method achieved higher classification precisions but relatively lower MacF1 values, which reveals that SPOS method may be
less accurate in the categories with small volumes of testing data but more accurate in the categories with large volumes of testing data.
C. Text Classification Based on MPOS Method
In the experiment based on MPOS method, we used and separated the corpus as what we had done in the SPOS method experiment. However, feature pre-processing and statistics gathering would be processed in different ways. According to the experiment design, MPOS method contains stem-extracting and the calculation on the probability of each part-of-speech, hence the feature spaces of MPOS method and its contrast experiment would be constructed by stems. The results of text classification are showed in Table IV, Table V, Table VI and Fig. 2.
TABLE IV. PRECISIONS AT DIFFERENT FEATURE DIMENSIONS ON TF-IDF AND MPOS METHODS
Feature Dimension
Precision
TF-IDF MPOS
50 0.7990 0.8757
100 0.8507 0.9196
200 0.8775 0.8872
400 0.8558 0.8771
600 0.8156 0.8604
800 0.7971 0.8447
1000 0.6982 0.7703
TABLE V. MACF1 VALUES AT DIFFERENT FEATURE DIMENSIONS ON
TF-IDF AND MPOS METHODS
Feature Dimension
MacF1 Value
TF-IDF MPOS
50 0.7357 0.7948
100 0.6873 0.8477
200 0.7967 0.7932
400 0.7274 0.7975
600 0.7107 0.7357
800 0.6918 0.7095
Vol. 3 Issue 2, February - 2017
TABLE VI. PAIRED SAMPLE T-TEST RESULTS OF THE PRECISIONS OF TF-IDF AND MPOSMETHODS
t df Sig. (two-sided) TF-IDF—MPOS -4.976 6 0.003
Fig. 2. Precision Line Chart of MPOS Method Experiment
As is shown in Table IV, Table VI and Fig. 2, compared with TF-IDF method, MPOS method was superior to TF-IDF method at the 0.1 significant level and exceeded the classification precision from 1 to 8 percent, showing that MPOS also takes effect in improving the performance of text classification. Besides, from feature dimension 50 to feature dimension 800, the accuracy rates of MPOS method were all above 80%, and at feature dimension 100 the precision went to 91.96%, which means that MPOS method also performs well in classification works. Additionally, we can observe in Table V that compared with TF-IDF method, MPOS method were able to achieve higher MacF1 values, and especially at feature
dimension 100, MPOS method exceeded 12 percent in MacF1 value, which shows that the classification
precisions of MPOS method in different categories are similar. Therefore, compare with SPOS method, MPOS method is able to perform more stably on classifying categories with different sizes of testing data.
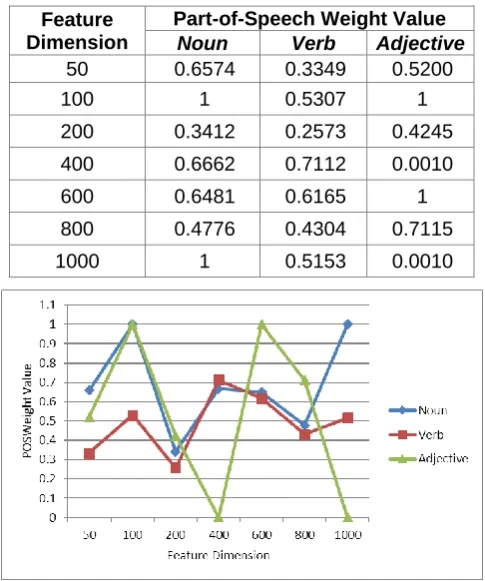
D. Analysis on the Values of Part-of-Speech Weight
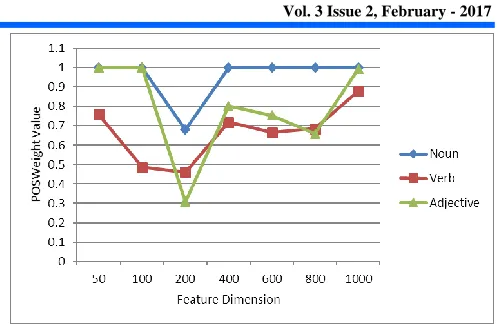
In the experiment based on SPOS method, the values of part-of-speech weight are shown in Table VII and Fig. 3.
TABLE VII. PART-OF-SPEECH WEIGHT VALUES AT DIFFERENT FEATURE DIMENSIONS IN SPOS EXPERIMENT
Feature Dimension
Part-of-Speech Weight Value
Noun Verb Adjective
50 1 0.7597 1
100 1 0.4854 1
200 0.6808 0.4600 0.3076
400 1 0.7185 0.8014
600 1 0.6660 0.7536
800 1 0.6859 0.6580
1000 1 0.8782 0.9933
Fig. 3. Line Chart of Part-of-Speech Weights of SPOS Method
From Table VII and Fig. 3 we can discover that noun obtained the highest part-of-speech weights among all parts-of-speech, while the part-of-speech weights of verb went stably and valued a little bit lower than the noun’s. It can be attributed to several reasons.
Firstly, as nouns represent different kinds of entity concepts, they should tell specific meanings respectively, and even some nouns may only exist in specific categories, so that nouns are more likely to cover the main idea of the texts and contribute more on differentiating the meanings between texts in different categories. Therefore, noun is likely to achieve a high value in part-of-speech weight.
Secondly, although verbs represent less on meanings of entity concepts, they are still indispensable to the construction and representation of texts as they show how these specific “concepts” do and act. Although many of the verbs are able to link with various nouns in English phrases, some nouns are corresponded to specific verbs. Therefore, verb is also able to represent texts of specific categories to some extent as well as achieve a certain value of part-of-speech weight, and the tendency of the part-of-part-of-speech weight of verb can also be stable.
Thirdly, as adjectives represent how an entity concept like, some adjectives may be used with nouns that representing the texts of certain categories well, thus they become able to make contribution to text classification, while some adjective features may be used with nouns that lack the ability on representing texts of specific categories, so that they will make less contribution to the classification work. In result, the part-of-speech weight of adjective displayed fluctuation on the figure.
Vol. 3 Issue 2, February - 2017
TABLE VIII. PART-OF-SPEECH WEIGHT VALUES AT DIFFERENT FEATURE DIMENSIONS IN SPOS EXPERIMENT
Feature Dimension
Part-of-Speech Weight Value
Noun Verb Adjective
50 0.6574 0.3349 0.5200
100 1 0.5307 1
200 0.3412 0.2573 0.4245
400 0.6662 0.7112 0.0010
600 0.6481 0.6165 1
800 0.4776 0.4304 0.7115
1000 1 0.5153 0.0010
Fig. 4. Line Chart of Part-of-Speech Weights of MPOS Method
From Table VIII and Fig. 4 we can also discover that the values of the part-of-speech weights of verb and noun went relatively more regularly, and the weight of noun valued higher, while the part-of-speech weights of adjective displayed a wide fluctuation and lacked the stability and regularity again. However, in MPOS method experiments, the part-of-speech weights of noun are relatively lower. It is because the feature space of MPOS method contains only stems, so that a certain number of nouns, which are not well-performed in representing specific categories, may contain stems in the feature space and should be taken into account in the classification process. Therefore, the part-of-speech weights of noun in MPOS method experiments are more likely to have lower values than that in SPOS method experiments. But in general, part-of-speech weights are able to represent the influence of different parts-of-speech and reflect how much each part-of-speech contributes on classification.
E. General Analysis
From the experiments above, it’s obviously that both SPOS and MPOS are superior to the original TF-IDF method on text classification works. We can have Fig. 5 by merging these precision data to compare the performance between these methods.
Fig. 5. Line Chart of Comparison of Precision between Two Experiments
From Fig. 5, we can see that MPOS method seems to perform the best in general, and SPOS method should rank the second. However, it demonstrates the effectiveness of the improved methods. At the same time, we can also see that MPOS method made its personal best performance at feature dimension 100, while SPOS method reached its best at feature dimension 200, and the precision went down as the feature dimension increases. This indicates that there should be an optimum interval of feature dimension for each method, in which there will be adequate features that are able to differentiate texts between all the categories properly, and if the feature dimension increases, the number of features that are relatively weaker in differentiating texts also increases, which may have negative impact on classification and decrease the accuracy.
But why MPOS method had the best performance at feature dimension 100, while SPOS method made it at feature dimension 200? It can be ascribed to the fact that there’s a stemming step in the MPOS experiment, through which the whole number of terms which are going to be selected as features decreases. For example, the words “happy” and “happiness” should be merged into one stem “happ”. The decrease of the number of terms will lead to the decrease of the dimension of features which best represent the text set and have the most excellent classification quality. Therefore, the optimum feature dimension of MPOS method becomes relatively lower.
Vol. 3 Issue 2, February - 2017 In fact, as MPOS method reaches its best at
relatively lower feature dimension, it’s reasonable to compare the performances of MPOS method and SPOS method by moving the precision curve of MPOS method. To be specific, according to the precision curve of MPOS method and SPOS method showed in Fig. 1, Fig. 2 and Fig. 5, move the curve of MPOS method and keep the precision at feature dimension 100 of MPOS method in accordance with the precision at feature dimension 200 of SPOS method so that the best performances of MPOS and SPOS are able to be compared. After that, the performance of SPOS and MPOS methods can be evaluated and compared with by analyzing their variation tendencies of precision. We can have Table IX and Fig. 6 to show the result after moving the curve of MPOS method.
TABLE IX. COMPARISON OF PRECISION BETWEEN SPOS AND MPOS AFTER MOVING THE CURVE OF MPOS
Feature Dimension
Number
Precision
SPOS MPOS
1 0.8267
2 0.8600 0.8757
3 0.8987 0.9196
4 0.8678 0.8872
5 0.8355 0.8771
6 0.8133 0.8604
7 0.8133 0.8447
8 0.7703
Fig. 6. Line Chart of Comparison of Precision between SPOS and MPOS after Moving the Curve of MPOS
In Table IX and Fig. 6, feature dimension number 1 stands for feature dimension 50 of SPOS method, and feature dimension number 2 links to feature dimension 100 of SPOS method and feature dimension 50 of MPOS method, and that feature dimension number 3 links to feature dimension 200 of SPOS method and feature dimension 100 of MPOS method, and so forth. It’s obvious that from feature dimension number 2 to number 7, SPOS method stays inferior to MPOS method on the accuracy of classification. Not only does MPOS method outperform SPOS method at their best performances but MPOS method keeps ahead of SPOS method along with the tendency of precision as well.
Therefore, it also strongly demonstrates that MPOS method should perform better in text classification works compared with SPOS method.
V. CONCLUSION AND FUTURE WORK
In this paper, two improved feature weight calculation methods called “SPOS” and “MPOS” are proposed, in which part-of-speech information is taken into account and a new concept "part-of-speech weight" is introduced. According to the experiments conducted, these two improved feature weight calculation methods can both promote the classification performance and increase the precision. However, compared to SPOS method, MPOS method works better on classification works, which can be ascribed to its flexible utilization of stemming and full-use of part-of-speech information of words. Also, in terms of the precision results, as the feature dimension rises, the precision climbs to the climax in the beginning and decreases at last, which shows that there will be different optimum intervals of feature dimension for specific feature weight calculation methods. Meanwhile, the optimum dimension of MPOS method stays conspicuously lower than SPOS method’s, which can be attributed to the stemming processing that cuts down the amount of terms that will be selected as features.
In addition, when it comes to the values of part-of-speech weights, while adjective displays as an irregular fluctuation, noun is usually high valued and verb is stably valued, which arrives to the tentative conclusion that noun makes great contribution to the text classification work and verb is also able to make certain extent of contribution, but not so much as noun’s.
Therefore, in the future, we will focus more on parts-of-speech other than noun and verb to probe into their effect on classification, try to figure out the regularities of the part-of-speech weights valued, and discover the reason why these regularities exist. Moreover, as SPOS method and MPOS method are both having much room for improvement, we will attempt to introduce some new improved methods based on SPOS or MPOS that work even more excellently on text classification. After that, we will also try to introduce the part-of-speech information into the feature selection process in order to optimize the feature space and improve the final classification result.
ACKNOWLEDGMENT
This research was supported by National Natural Science Foundation of China (Grant No. 71373291). This work also was supported by Science and Technology Planning Project of Guangdong Province, China (Grant No. 2016B030303003).
REFERENCES
[1] B. Galitsky. Machine learning of syntactic parse trees for search and classification of text. Engineering Applications of Artificial Intelligence, vol. 26, no. 3, pp. 1072-1091, 2013.
Vol. 3 Issue 2, February - 2017 Mechatronics, Electronic, Industrial and Control
Engineering (MEIC-14). Atlantis Press, pp. 393-397, 2014.
[3] F. Al Shamsi, A. Guessoum. A hidden Markov model-based POS tagger for Arabic. In Proceedings of the 8th International Conference on the Statistical Analysis of Textual Data. pp. 31-42, 2006.
[4] J. Giménez, L. Marquez. SVMTool: A general POS tagger generator based on Support Vector Machines. In Proceedings of the 4th International Conference on Language Resources and Evaluation. pp. 43-46, 2004.
[5] K. Toutanova, C. D. Manning. Enriching the knowledge sources used in a maximum entropy part-of-speech tagger. In Proceedings of the 2000 Joint SIGDAT conference on Empirical methods in natural language processing and very large corpora: held in conjunction with the 38th Annual Meeting of the Association for Computational Linguistics. Association for Computational Linguistics, pp. 63-70, 2000.
[6] C. Bouras, V. Tsogkas. Noun retrieval effect on text summarization and delivery of personalized news articles to the user’s desktop. Data & Knowledge Engineering, vol. 69, no. 7, pp. 664-677, 2010.
[7] K. Toutanova, D. Klein, C. D. Manning, Y. Singer. Feature-rich part-of-speech tagging with a cyclic dependency network. In Proceedings of the Conference of the North American Chapter of the Association for Computational Linguistics on Human Language Technology. Association for Computational Linguistics, pp. 173-180. 2003.
[8] B. K. Wang, Y. F. Huang, W. X. Yang, X. Li. Short text classification based on strong feature thesaurus. Journal of Zhejiang University SCIENCE C, vol. 13, no. 9, pp. 649-659, 2012.
[9] A. C. Fang, J. Cao. Part-of-Speech Tags and ICE Text Classification. Text Genres and Registers: The Computation of Linguistic Features, Springer Berlin Heidelberg, pp. 71-82, 2015.
[10] G. Wang, Z. Zhang, J. Sun, S. Yang, C. A. Larson. POS-RS: A Random Subspace method for sentiment classification based on part-of-speech analysis. Information Processing & Management, vol. 51, no. 4, pp. 458-479, 2015.
[11] P. Curto, N. J. Mamede, J. Baptista. Automatic readability classifier for European Portuguese. INFORUM 2014 – Simpósio de Informática. pp. 309-324, 2014
[12] M. Zampieri, B. G. Gebre, S. Diwersy. N-gram language models and POS distribution for the identification of Spanish varieties. In Proceedings of TALN2013. pp. 580-587, 2013.
[13] S. Chua. The role of parts-of-speech in feature selection. In Proceedings of the International MultiConference of Engineers and Computer Scientists. Newswood Limited, pp. 457-461, 2008.
[14] T. Masuyama, H. Nakagawa. Two step POS selection for SVM based text categorization. IEICE TRANSACTIONS on Information and Systems, vol. 87, no. 2, pp. 373-379, 2004.
[15] A. C. Tantug. Document Categorization with Modified Statistical Language Models for Agglutinative Languages. International Journal of Computational Intelligence Systems, vol. 3, no. 5, pp. 632-645, 2010.
[16] L. Asker, A. A. Argaw, B. Gambäck, S. E. Asfeha, L. N. Habte. Classifying Amharic webnews. Information retrieval, vol. 12, no. 3, pp. 416-435, 2009.
[17] R. J. N. Pise. Compact feature set using semantic information for text classification. International Journal of Computer Engineering and Applications, vol. 9, no. 8, pp. 43-56, 2012.
[18] W. S. Cooper. Getting beyond boole. Information Processing & Management, vol. 24, no. 3, pp. 243-248, 1988.
[19] N. Fuhr, C. Buckley. A Probabilistic Learning Approach for Document Indexing. ACM Transactions on Information Systems, vol. 9, no. 3, pp. 223-248, 1991.
[20] G. Salton, M. E. Lesk. Computer Evaluation of Indexing and Text Processing. Journal of the ACM, vol. 15, no. 1, pp. 8-36, 1968.
[21] G. Salton, C. Buckley. Term-weighting approaches in automatic text retrieval. Information processing & management, vol. 24, no. 5, pp. 513-523, 1988.
[22] F. Ren, M. G. Sohrab. Class-indexing-based term weighting for automatic text classification. Information Sciences, vol. 236, pp. 109-125, 2013.
[23] M. Emmanuel, S. M. Khatri, D. R. Babu. A Novel Scheme for Term Weighting in Text Categorization. In IEEE International Conference on Systems, Man, and Cybernetics. IEEE, pp. 2292-2297, 2013.
[24] Q. Luo, E. Chen, H. Xiong. A semantic term weighting scheme for text categorization. Expert Systems with Applications, vol. 38, no. 10, pp. 12708-12716, 2011.
[25] R. C. Eberhart, J. Kennedy. Particle swarm optimization. In Proceedings of IEEE International Conference on Neural Networks. IEEE, pp. 1942-1948, 1995.
[26] Y. Shi, R. C. Eberhart. Empirical study of particle swarm optimization. In Proceedings of the Congress on Evolutionary Computation, CEC 99. IEEE, pp. 1945-1950, 1999.
[27] M. Omran, A. Salman, A. P. Engelbrecht. Image Classification Using Particle Swarm Optimization. Recent Advances in Simulated Evolution and Learning, pp. 347-365, 2004.
Vol. 3 Issue 2, February - 2017 Proceedings IEEE Congress on Evolutionary
Computation, CEC 03. IEEE, pp. 215-220, 2003.
[29] B. M. Zahran, G. Kanaan. Text Feature Selection using Particle Swarm Optimization Algorithm 1. World Applied Sciences Journal, pp. 69-74, 2009.
[30] M. Rahimirad, M. Mosleh, A. M. Rahmani. Improving the Operation of Text Categorization Systems with Selecting Proper Features Based on PSO-LA. Journal of Advances in Computer Engineering and Technology, vol. 1, no. 2, pp. 1-8, 2015.
[31] Z. Wang, Q. Zhang, D. Zhang. A PSO-based Web document classification algorithm. Eighth ACIS International Conference on Software Engineering, Artificial Intelligence, Networking, and Parallel/Distributed Computing (SNPD 2007). IEEE Computer Society, pp. 659-664, 2007.
[32] C. J. Van Rijsbergen, S. E. Robertson, M. F. Porter. New models in probabilistic information retrieval, British Library Research and Development Department, 1980.
[33] M. F. Porter. Snowball: A language for stemming algorithms. 2001. Available from: http://snowball.tartarus.org/texts/introduction.html.