A Research on Mixture Splitting for CHMM
Based on DBC
Gang Liu
Key Laboratory of Information Processing and Intelligent Technology, Beijing University of Posts and Telecommunications, Beijing, China
Email: [email protected]
Wei Chen, Jun Guo
Key Laboratory of Information Processing and Intelligent Technology, Beijing University of Posts and Telecommunications, Beijing, China
Email: [email protected], [email protected]
Abstract— EM (expectation-maximization) algorithm is a
classical method for parameter estimation of HMM (Hidden Markov model). Concerning that EM algorithm is easily affected by initial parameter values, a mixture splitting algorithm based on decision boundary confusion(DBC) was proposed to describe more about boundary distribution. The algorithm mainly includes four aspects: firstly the number of incremented mixtures for every decision boundary could be determined according to decision boundary confusion; secondly the mixtures which are the closest to the decision boundary are chosen to split; thirdly the split mean of mixture is in the direction of decision boundary; finally the mixture number of a state is determined by the confusion between states. Our experiments show that our proposed algorithm is more effective for classification using HMM.
Index Terms — mixture splitting, DBC, HMM, EM.
I. INTRODUCTION
HMM [1] is widely used to solve kinds of pattern recognition problems now, and HMM’s parameters are usually computed by maximum likelihood (ML) estimation using the expectation maximization (EM) algorithm [2].
The EM algorithm is an iterative procedure that re-computes the model parameters iteratively so as to increase the likelihood of the training data at each iteration. But this algorithm is sensitive to the initial parameter values, and only guarantees a local optimal solution [3].
As a descriptive algorithm, EM can describe the probability distribution of random variable effectively. However, it is more important for pattern classification to enhance the discriminability between different models and describe decision boundary distribution more effectively. Therefore, some discriminative training methods of HMM are proposed, such as MCE, MMIE,
MPE and so on [5]. And active learning is also proposed from the perspective of sample selection in order to improve the classification ability of models [6].These methods essentially change the distribution of models, which can increase the classification ability of the models.
HMM is always modeled by weighted sums of different mixtures, each of whom has a different mixture weight. While estimating HMM parameters, parameters of single mixture are firstly estimated by EM algorithm, then initial parameter values of multiple mixtures can be obtained by mixture splitting method, and then parameters of multiple mixtures HMM model can be also estimated by EM algorithm. This process is often iterated for several times. Considering that EM algorithm is often influenced by initial model parameters, the performance of trained HMM is closely related to initial parameters of mixtures. So splitting method becomes very important. In HMM Tool Kit (HTK) of Cambridge University, the mixture with the maximum mixture weighted coefficient is split [4]. In [3], the mixture which has the largest variance is split. Usually, HMM includes many states in which each state has the same mixture number in the training for model parameters, but this way may be not the best.
In this paper, we propose a mixture splitting algorithm based on decision boundary confusion (DBC) in view of improving the description of decision boundary. The algorithm mainly includes four aspects: firstly the number of incremented mixtures for every decision boundary could be determined according to decision boundary confusion; secondly the mixtures which are the closest to the decision boundary are chosen to split, thirdly the split mean of mixture is in the direction of decision boundary, finally the mixture number of a state is determined by the confusion between states. Experiments show that our proposed algorithm can achieve better performance.
This paper is divided into six parts: in the first part, background information, and the organization of the paper are introduced; the second part shows parameter estimation process of Continuous density hidden Markov This study is supported by National Natural Science Foundation of
China (60705019) and the National High-Tech Research and Development Plan of China (2006AA010102 and 2007AA01Z417).
model (CHMM) using EM; the third part is demonstrating the proposed mixture splitting algorithm based on DBC; in the fourth part, the issue of mixture number of states is discussed; Then in fifth part, the experimental results are given; at last, we conclude the entire article.
II. EMESTIMATION OF CHMMPARAMETER
Continuous density hidden Markov model (CHMM) always uses Gaussian distribution to model mixture, and Gaussian mixture models (GMMs) for the state conditioned observation densities which is shown in equation(1) as below, where
b o
j( )
t is the probability of generating observation ot for state j, function g( ) is the multi-dimensional Gaussian distribution shown in equation (2), andµ
jm,
∑
jm are respectively mean and covariance matrix of being in state j and mixture m.1
( )
( ,
,
)
M
j t jm t jm jm m
b o
c g o
µ
=
=
∑
∑
(1)( ) 1( )
1 2
1
( , , )
(2 )
T
o o
P
g o
µ
e
µ µπ
−
− − ∑ −
∑ =
∑
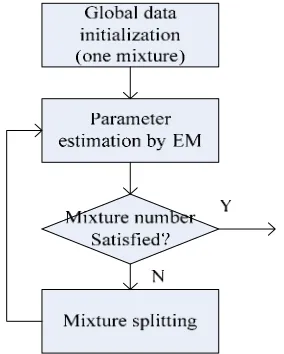
(2)While training parameters of HMM with multi Gaussian mixtures, firstly, each model is initialized by single mixture whose mean and variance are initialized by global values and estimated by EM later; Secondly, mixtures of models are always split, and then parameters of the split mixtures are re-estimated by EM algorithm. The training procedure is shown in Figure 1 as below.
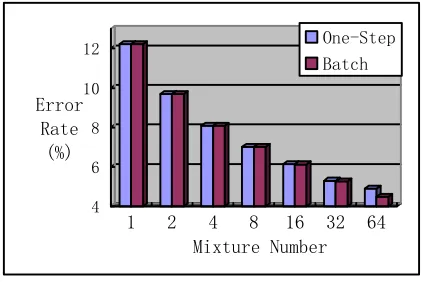
Mixture components are incremented and re-estimated after mixture splitting in stages until the required number of components is obtained. For example, mixture components are incremented by 1 or more and estimated, then incremented by 1 or more again and re-estimated, and so on until the required number is satisfied. If mixture components are incremented by 1 and re-estimated at each stage, for convenience, we call this method One-Step Incrementing, and if mixture components are incremented by more than one and then
re-estimated at each stage, we call this method Batch Incrementing.
In HTK, the method for mixture splitting works by repeatedly splitting the mixture with the largest mixture weight. And the split is actually performed by copying and dividing the weights of both copies by 2, and finally perturbing the means by plus or minus 0.2 standard deviations [4].
But this method can not guarantee that the splitting is in direction of the decision boundary. Aiming at including the boundary distribution information during splitting, we proposed the Mixture splitting algorithm based on DBC.
III. MIXTURE SPLITTING ALGORITHM BASED ON DBC
The well trained model for classification need not describe the whole distribution explicitly, but need to express decision boundary accurately. So the mixture closer to the decision boundary is more important. EM algorithm is essentially a descriptive estimation algorithm, which can approach the true distribution of training data. So the discriminabiltity of the model whose parameters estimated by EM may not the best. In this paper, we propose the mixture splitting algorithm based on decision boundary confusion. More mixtures close to the decision boundary are incremented appropriately during split of mixtures to improve the description for boundary.
There are three problems needing solving for mixture splitting algorithm based on DBC:
a. Which decision boundary can easily generate confusion or which decision boundary needs more mixtures;
b. Which mixture should be split; c. How to split the mixture.
A. Decision Boundary Confusion
Our algorithm attends to improve the description ability of boundary distribution. Supposing that there are N pattern classes, there will be N-1 decision boundary for every class.
B
ij is the decision boundary of model i relative to model j. Concerning that it is difficult to analyze the decision boundary confusion accurately, error recognition ratio is adopted.ij
e
represents the error recognition ratio ofmisrecognizing class i as class j, obviously
e
ii=
0
. It isevident that the larger
e
ij is, the easier class i can be misrecognized as class j, and the larger the confusion of decision boundaryB
ij is. We can also use normalizederror recognition ratio
e
ij/
e
i to characterize theboundary confusion, where
e
i represents errorrecognition ratio of class i, and i ij
j
e
=
∑
e
.boundary, the number of increased mixtures can be calculated by equation (3) , where
m
ij is the number ofincreased mixture number for the decision boundary
B
ijof model i relative to model j, INT( ) is rounding function, and
m
i is the total increased mixture number for model i.
m
ij=
INT m e
(
i ij/
e
i)
(3)B. Mixture Selection Based On DBC
In HTK, the mixture with the largest weight is chosen to split, but boundary distribution information cannot be obtained directly. In this paper, the mixture which is the closest to decision boundary is chosen to split.
(
,
)
ik ik ik
g
=
g
µ
∑
represents the kth Gaussian mixture of model i (for convenience of introducing this algorithm, the state information of HMM is omitted in the equations ).1
(
,
)
(
,
,
)
M
ik j jl ik jl jl l
P g
λ
c g
µ µ
=
=
∑
∑
represents theoutput probability of the mean of the k-th Gaussian mixture of model i under the condition of model j. The larger the probability is, the shorter the distance between
ik
µ
and model j is, and the shorter the distance between
mixture
g
ik and model j is.im
g
represents the mixture of model i which is the closest to model j and expressed in equation(4).1
arg max (
,
)
arg max
(
,
,
)
ik
ik
im ik j
g M
jl ik jl jl
g l
g
P g
c g
λ
µ µ
==
=
∑
∑
(4)The description ability of model i on boundary
ij
B
could be improved by splitting
g
im reasonably.C. Mixture Splitting Based On DBC
Supposing that
g
im will be split into two mixturesnamed
g
im1 andg
im2 whose mixture weights andvariances are generated like HTK. The key problem is the
splitting method of means of
g
im1 andg
im2 named1 im
µ
and
µ
im2. In this paper, two methods for splitting areproposed. Assume that
B
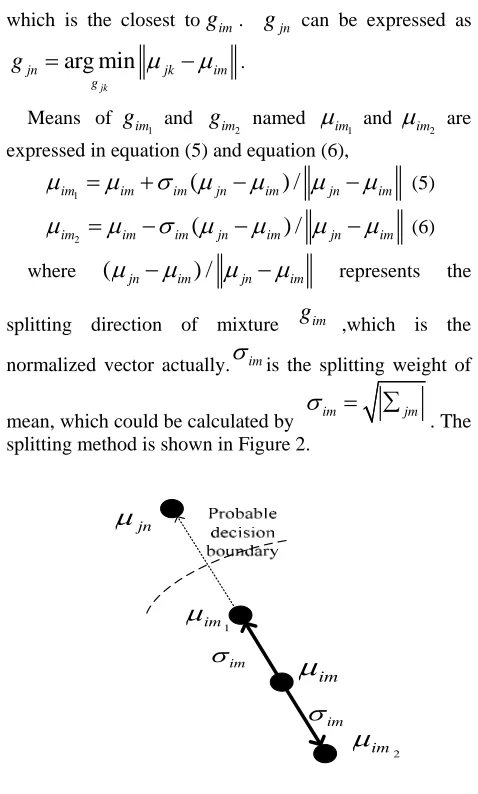
ij is the decision boundary for current analysis.Splitting method 1: mean of one mixture is split in two opposite directions like HTK. One of the split mixtures should be in the direction of the decision boundary. And the direction of the decision boundary can be expressed by the direction of the mixture named
g
jnof model jwhich is the closest to
g
im.g
jn can be expressed asarg min
jk
jn jk im
g
g
=
µ
−
µ
.Means of
1 im
g
and2 im
g
named1 im
µ
and2 im
µ
are expressed in equation (5) and equation (6),1
(
) /
im im im jn im jn im
µ
=
µ
+
σ µ
−
µ
µ
−
µ
(5)2
(
) /
im im im jn im jn im
µ
=
µ
−
σ µ
−
µ
µ
−
µ
(6)where
(
µ
jn−
µ
im) /
µ
jn−
µ
im represents thesplitting direction of mixture
g
im ,which is thenormalized vector actually.
σ
imis the splitting weight ofmean, which could be calculated by
σ
im= ∑
jm . The splitting method is shown in Figure 2.In splitting method 1, there is only one split mixture taking boundary information, so splitting method 2 is proposed.
Splitting method 2: Two mixtures of model j are needed to serve as the splitting directions.
im jb im ja
im jb T im ja jb ja
im g g
g
µ
µ
µ
µ
µ
µ
µ
µ
α
− ⋅ −
− −
= =
) (
) (
) cos( ) , , cos(
(7)
Equation (7) represents vector angular cosine among
two mixtures of model j named
g
ja,
g
jb and mean ofGaussian mixture
g
imof model i, and the vector angle isshown in figure 3. The value of angle is from 30º to 180º, and if the number of mixtures is less than 2 or the mixture satisfying constraint can not be found, the mixture will be split using splitting method 1.
jn
µ
im
µ
2 im
µ
1 im
µ
im
σ
im
σ
Let
g
jn1andg
jn2represent the mixtures which can getthe minimum vector angular cosine, and they can be expressed in equation (8) as below,
1 2
{ , }
{
,
}
arg min cos(
,
,
)
ja jb
jn jn im ja jb
g g
g
g
=
g
g
g
(8)
Assume that
g
jn1andg
jn2 are chosen to serve as thesplitting directions, and Means of split mixtures of
mixture m of model i named
µ
im1andµ
im2are expressedin equation (9) and equation (10) . The splitting method 2 is shown in figure 4.
1
(
1) /
1im im im jn im jn im
µ
=
µ
+
σ µ
−
µ
µ
−
µ
(9)
2
(
2) /
2im im im jn im jn im
µ
=
µ
+
σ µ
−
µ
µ
−
µ
(10)D. Mixture Selection Based On DBC
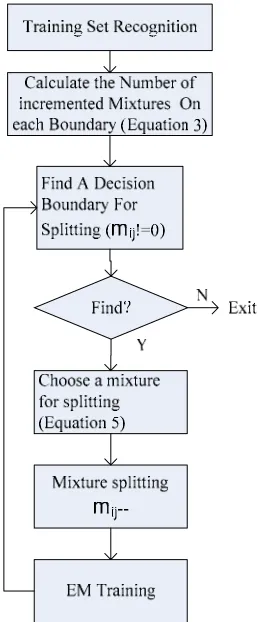
The process of mixture splitting algorithm based on DBC is shown in figure 5.
In Figure 5,
m
ij is the number of increased mixturenumber for the decision boundary
B
ij of model i relative to model j. Obviously, One-Step Incrementing is shown in figure 5, which increments mixture components by 1 and then re-estimates at each stage. Using One-Step Incrementing and considering about different splitting methods, algorithm DBC1 and DBC2 are separately used to represent the algorithms using splitting method1 and splitting method 2.Meanwhile, Batch Incrementing, which increments mixture components by more than one mixture and then re-estimates at each stage, could also be adopted. In our paper, Batch Incrementing is realized by incrementing one mixture at each decision boundary whose
m
ij is notequal to 0 and re-estimating subsequently. Using Batch Incrementing and considering about different splitting methods, algorithm DBC3 and DBC4 are separately used to represent the algorithms using splitting method1 and splitting method2.
In algorithm DBC3 or DBC4,
m
i' represents the increased mixture number of model i at each stage which is shown in equation(11) as below, where function h( ) is unit step function expressed in equation (12).'
1
(
)
Ni j ij
m
=
∑
=h m
(11)1
0
( )
0
0
n
h n
n
>
⎧
= ⎨
≤
⎩
(12)ij
m
becomes smaller and smaller accompany with thework of split of mixtures. So
m
i' is variable and becomes the largest for the first time, and then keep fixed or decrease until split completes andm
i' is equal to 0.IV.DETERMINATION OF MIXTURE NUMBER OF STATES
BASED ON THE CONFUSION
Figure 5. The process of mixture splitting algorithm based on DBC
jb
µ
jaµ
im
µ
α
Figure 3. Vector angle
2
jn
µ
1
jn
µ
im
µ
2
im
µ
1
im
µ
im
σ
σ
imConcerning that different states make different contributions to classification, it is necessary to model those more important states using more mixtures to improve their description accuracy, and model less important states using properly reduced mixtures.
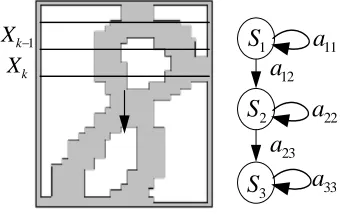
In current off-line Handwritten Digit Recognition System, the image of character was divided into many segments from top to bottom, and each segment is treated as one frame which is shown on the left side of Figure 6, where
X
krepresents the image of the kth frame. And on the right side of the Figure, the topology of the HMM states is shown, where one state of HMM is corresponding to some frames or area of image. And it can be seen that the top and bottom parts of character ‘0’ and ‘8’ are very similar, but the evident difference lies in the middle parts of these two characters. Therefore, the first and last states of the two HMM models of ‘0’ and ‘8’, are less useful for classification because of higher confusability, and the middle states with lower confusability make the greatest contributions to classification.Different distance measures are adopted to measure the confusion between different states in this paper.
A. Measurement of the confusion between different states One state of CHMM is modeled by GMM, and the distance between different states is the same as that between corresponding GMMs.
}
~
1
,
,
{
aik aik akk
a
c
g
i
M
s
=
=
represents parametersof kth state of HMM a,
M
ak represents the mixturenumber of kth state of HMM model a. Then the distance measure between kth state for HMM a and
l
thstate for HMM b is shown as below.
∑
∑
= ==
blk a M j l j k i l bj M i k ai l b k
a
s
c
c
d
g
g
s
dis
1
1
(
,
)
)
,
(
Function
d
(
)
represents the distance between two Gauss functions, common methods are expressed as follows [7]. Euclidean Distance(ED):)
(
)
(
)
,
(
g
ig
j i j T i jd
=
µ
−
µ
µ
−
µ
Mahalanobis Distance (MD):
)
(
2
)
(
)
,
(
1 j i i i T j i j ig
g
d
µ
µ
σ
σ
⎟
µ
−
µ
⎠
⎞
⎜
⎝
⎛ +
−
=
−Bhattachyaryya Distance (BD):
2 / 1 2 / 1 1 2 / ) ( ln 2 1 ) ( 2 ) ( 8 1 ) , ( j i j i j i j i T j i j i g g d σ σ σ σ µ µ σ σ µ µ + + − ⎟⎟ ⎠ ⎞ ⎜⎜ ⎝ ⎛ + − = −
K-L Distance (KLD):
]
2
[
2
1
)
)(
(
)
(
2
1
)
,
(
1 1 1 1I
tr
g
g
d
j i j i j i j i T j i j i−
+
+
−
+
−
=
− − − −σ
σ
σ
σ
µ
µ
σ
σ
µ
µ
Divergence Distance (DD):
⎟⎟
⎠
⎞
⎜⎜
⎝
⎛
+
=
)
,
(
)
,
(
)
,
(
)
,
(
2
1
)
,
(
' l b l b k a l b k a k a l b k a l b k as
s
dis
s
s
dis
s
s
dis
s
s
dis
s
s
dis
)
(
dis
can use any of the equations as mentioned above.B. Determination of the mixture number based on confusion
k ij
m
represents the mixture number which is neededincreasing on kth state of HMM i on decision boundary
ij
B
,m
ik represents the mixture number which is neededincreasing on kth state of HMM i.
Then
=
∑
N=j k ij k i
m
m
1 , and
=
∑
=s N k k i i
m
m
1 ,
N
s isthe state number of HMM.
The equation of
m
ijkis shown as below.∑
==
s N l l j l i k j k i ij k ijs
s
dis
s
s
dis
m
m
1
(
,
)
)
,
(
(13)
It can be seen from the equation (13) that less confusability (i.e. longer distance) between kth state of HMM i and kth state of HMM j, more mixtures are assigned. Equation (14) shows the other way to verify the equation (13).
∑
==
s N l l j l i k j k i ij k ijs
s
dis
s
s
dis
m
m
1
[
1
/
(
,
)]
)
,
(
/
1
(14)The method (DBC3) proposed in 3th part should be modified in order to realized the method proposed in this part, where computing
m
ijk should be inserted aftercomputing
m
ijin the steps mentioned in 3th part.V.EXPERIMENTS
A. Experiment system
This research use an off-line Handwritten Digit Recognition System [8] based on HMM in our
1 − k
X
kX
1S
3S
2S
11a
12a
33a
22a
23a
experiments, which recognizes ten digits (0~9), i.e., the system has ten classes with N=10. In this system, one dimension continuous left-to-right HMM with 8 states is used and training procedures are based on Baum_Welch algorithm. Furthermore the recognition procedures are based on Viterbi algorithm and 18-dimension feature vector is used consists of 12-dimension Directional Element Feature and 6-dimension summation based 1-D FT Feature [9].
The data used in our experiment consists of digits extracted from the area of amount in figures in bank bills. They are divided into two groups, training set S and test set T. Every digit in training set S has 4000 samples, while the number of samples for each digit in test set T is different (3000~9000, the number is accord with the actual times the digit appears, for example, the number for 0 is large and the number for 7 is small).
All the following results are error recognition ratios of the test set. And the EM iteration times are all 25.
B. Experiment using HTK
In HTK, at each stage, one mixture or more mixtures can be split, and then re-estimated after splitting. In figure 7, the experiments results of two conditions are shown. The first condition is One-Step Incrementing, and the second condition is Batch Incrementing. In figure 6, it can be seen that when the mixture number becomes large, Batch Incrementing is better than One-Step Incrementing.
C. Experiments for Mixture splitting algorithm based on DBC.
The comparison between different methods is shown in table 1, where HTK represents largest mixture weight splitting method, and VAR represents largest variance splitting method [3]. In table 1, when the mixture number is 1, error recognition rate is the same because the initial value and training method are the same. But when there are 2 mixtures, error recognition rates of HTK and VAR are lower and VAR is the best. In contrast, DBC1~4 are the same from the perspective of realization, so they also have the same error recognition rate which is inferior
because there are too little mixtures, the model can not be described accurately, and boundary information contributes little. But when the mixture number becomes 4,8,16, our proposed algorithm performs well. And these conditions are shown as below.
For convenience,eDBCi represents error recognition rate of DBCi, where i is from 1 to 4. Compared among DBC1~4, when the mixture number is 4,e DBC1< e DBC3,e DBC2< e DBC4,but when the mixtures are incremented and the number becomes 8 or 16, the result is reversed which is e DBC1> e DBC3,e DBC2> e DBC4. These results show that when there are little mixtures, One-Step Incrementing is better than Batch Incrementing. But when the mixtures are incremented (more than 4 in our experiments), One-Step Incrementing is inferior.
It can be seen from the results that e DBC1< e DBC2, e DBC3< e DBC4 in that in table 1, splitting method 1 is better than splitting method 2 because both boundary direction information and opposite direction are added splitting method 1 which can improve description of the patterns in pattern classification.
Finally, performance of HTK, VAR, and DBC are compared. In table 1, VAR performs better than HTK, but the whole performance of DBC3 is the best, whose error recognition rate is reduced by about 0.3% (absolute value) compared with HTK under the condition of every mixture number in the experiments. Compared with VAR, error recognition rate is not reduced so much, which are 0.16%, 0.12%, 0.13% corresponding to the mixture number 4,8,16. Meanwhile DBC4 is also better than HTK, only worse than VAR when the mixture number is 16.All the experiments show that our proposed algorithm is more effective.
D. Experiments for mixture number of states
The results which adopt equation (13) are shown in table 2. The results show that the method adopting ED is better than others, for convenience, DBC5 is used to represent the method adopting ED. Compared with DBC3, the recognition error rate of DBC5 evidently decreases only when mixture number is small (e.g. 2, 4) .So DBC3 and DBC5 can complement each other greatly.
TABLE I.
ERROR RECOGNITION RATE (%)UNDER DIFFERENT METHODS AND MIXTURES
Mixture Number 1 2 4 8 16
HTK 12.22 9.69 8.08 7.02 6.13
VAR 12.22 9.64 7. 93 6.91 5.93
DBC1 12.22 9.87 7.71 6.84 6.07
DBC2 12.22 9.87 7.80 6.85 6.18
DBC3 12.22 9.87 7.77 6.79 5.80
DBC4 12.22 9.87 7.82 6.77 6.04
4 6 8 10 12
Error Rate
(%)
1 2 4 8 16 32 64
Mixture Number
One-Step Batch
The results which adopt equation (14) are shown in table 3. Combined with table2, equation (13) is better than equation (14), so it is proved that more mixture number should be assigned over those with less confusability.
The underperformance of the DBC5 method in higher mixture number (e.g. 8, 16) is on account of excessive iterations which resulted in great discrepant mixture number of states. Table 4 shows that mixture number of different states and mean mixture number of states is 16.
Therefore, the following experiment associated DBC3 with DBC5, it adopted DBC3 in the training period and adopted DBC5 in the last step. For example, while training HMM with 8 mixtures, DBC3 is used firstly to get the model for 4 mixtures and then the model with 8 mixtures is trained using DBC5. Table 5 shows the results which are not ideal and need further research in future.
In conclusion, when using the method proposed in current paper, DBC5 should be adopted if mixture number is small (e.g. 2 or 4), and DBC3 should be adopted if mixture number is more than 4. The final comparative results are shown in table6.
VI.CONCLUSIONS
This paper proposes a mixture splitting algorithm based on DBC. Experiments show that the proposed method can achieve better performance.And theproblem of mixture number assignment in different states needs further research in the future.
REFERENCES
[1] L.R.Rabiner, “A Tutorial on Hidden Markov Models and Selected Applications in Speech Recognition”, In Proc. IEEE, Vol.77, No. 2, February, 1989.
[2] A. Dempster, N. Laird, and D.Rubin, “Maximum Likelihood from Incomplete Data via the EM Algorithm”,
Journal of the Royal Statistical Society, vol. 39, no. 1, pp. 1–38, 1977.
[3] A. Sankar, "Experiments with a Gaussian Merging-Splitting Algorithm for HMM training for Speech Recognition", in Proceedings of DARPA Speech Recognition Workshop, (Lansdowne, VA), February 1998. [4] S. Young et al., The HTK Book (for HTK Version 3.2),
Speech Vision and Robotics Group, Cambridge University Engineering Department, Jul. 2002.
[5] Vertanen, K. (2004), “An Overview of Discriminative Training For Speech Recognition”, University of Cambridge, Cambridge, U.K.
[6] Hakkani-Tur, D., G. Ricarrdi, and A. Gorin (2002). “Active learning for automatic speech recognition”, In Proc. ICASSP, pp. 3904-07.
[7] Liu Shuquang, Research on A Small Data Set Based Acoustic Modeling for Dialectal Chinese Speech Recognition, Ph.D. Thesis, Tsinghua University, China, April, 2007
[8] Liu Gang, Zhang Honggang, Guo Jun, “Application of HMM in Handwritten Digit OCR”, Journal of computer research and development, Vol. 40, No.8, pp. 1252-1257, Aug. 2003.
[9] Liu Gang, Zhang Honggang, Guo Jun, “Feature Extracting in the off-line handwritten digits recognition based on HMM”, Pattern Recognition and Artificial Intelligence, Vol. 15, No.3, pp. 343-347, Sept. 2002.
TABLE VI. DBC5 OR DBC3
Mixture Number
1 2 4 8 16
HTK 12.22 9.69 8.08 7.02 6.13
VAR 12.22 9.64 7. 93 6.91 5.93
DBC5 or DBC3
12.22 9.63 7.64 6.79 5.80
TABLE V. DBC3+DBC5
Mixture Number
1 2 4 8 16
DBC3 12.22 9.87 7.77 6.79 5.80
DBC5 12.22 9.63 7.64 6.97 6.08
DBC3+DBC5 12.22 9.63 8.11 7.11 6.10 TABLE IV.
MIXTURE NUMBER OF DIFFERENT STATES
Model Mixture number of different states
Error rate
0 12/8/12/26/26/12 5.91 1 8/7/39/20/12/10 10.09 4 13/8/19/17/26/13 3.74
TABLE III.
THE RESULTS OF EQUATION (14)
Mixture Number 1 2 4 8 16
DBC3 12.22 9.87 7.77 6.79 5.80
MD 12.22 10.15 8.43 7.12 6.12
DD(MD) 12.22 10.15 8.91 7.88 6.75
TABLE II.
THE RESULTS OF EQUATION (13)
Mixture Number 1 2 4 8 16
DBC3 12.22 9.87 7.77 6.79 5.80
ED 12.22 9.79 8.12 7.03 6.09
MD 12.22 9.63 7.64 6.97 6.08
BD 12.22 9.69 7.63 6.90 6.33
KLD 12.22 9.83 8.22 7.36 6.76
DD(ED) 12.22 9.79 7.95 6.81 6.52
DD(MD) 12.22 9.63 7.99 7.22 6.22
DD(BD) 12.22 9.69 7.56 6.90 6.12
DD(KLD) 12.22 9.83 8.41 7.58 6.85
Liu Gang received his PHD degree in the school of information engineering, in 2003, Beijing University of Posts and Telecommunications (BUPT), China. He is currently an associate Professor in the school of information and communication engineering at BUPT. His research interests include pattern recognition, speech signal processing and audio information retrieval.
Chen Wei is currently PHD candidate in the school of information and communication engineering at BUPT. His research interests include pattern recognition, machine learning.