Copyright © The Author(s). All Rights Reserved. Published by American Research Institute for Policy Development DOI: 10.15640/jeds.v5n3a3 URL: https://doi.org/10.15640/jeds.v5n3a3
Characteristics that Influence Technical Efficiency of Corn Production in Mexico
Luis A. Becerra-Perez
1, Luis F. Lopez-Reyes
2, Wallace E. Tyner
3Abstract
This study examines the extent to which technical efficiency is related to certain corn producers’ characteristics. With data gathered by survey, 229 farms in the Sinaloa valley, Mexico are used to estimate a stochastic frontier model in 2016. The main finding of this work is that membership in a farmers’ association has a positive effect on efficiency. There is also a positive relationship between efficiency and formal education, age, land ownership, and soil analysis. The prevailing level of efficiency among maize producers is 0.84, implying there is room for improvement with the current technology.
Keywords: Characteristics of Technical Efficiency, Corn production, Stochastic Frontier Model. Introduction
The variation in technical efficiency in agriculture has been estimated in Asian countries like India (Batesse and Coelli, 1995; Ali and Gupta, 2011; Bhattacharyya and Pal, 2011) and China (Chen and Song, 2008; Wang and Rungsuriyawiboon, 2010), and in African countries like South Africa (Pauw and Punt, 2007) and Kenya (Anderson et al., 2008; Kibaara and Kavoi, 2012). However, measurements of agricultural technical efficiency in Latin-American countries and especially in Mexico have received notably less attention. For the purpose of this paper, efficiency is defined as the firm’s ability to produce the maximum amount of output given a set of inputs and technology. To the best of our knowledge, no empirical investigation of efficiency of Mexican farmers has been conducted. In addition, there is no literature currently available particularly concerned with evaluating farm specific factors that might be associated with the ability of Mexican farmers to reach the technically efficient frontier in corn production. Therefore, this work estimates the level of technical efficiency/inefficiency of corn producers in the Sinaloa valley.Fig. 1 presents the geographical location of the state of Sinaloa.The estimation is done through the analysis of data that contains farm specific input quantities and demographics, using the Stochastic Frontier Model (SFM). Such a model allows us to identify the impact of social, economic, and management practices.
Corn is a symbol of the Mexican culture, and the most important agricultural product in the country. When we speak about corn, we are referring to white corn. White corn has been grown since the pre-colonial era. It is the base product of the Mexican diet, and it is grown all around the country in a variety of agricultural practices embracing subsistence agriculture and irrigated, highly efficient lands. Tortilla, a product elaborated from white corn, supplies more than half of the calories and one third of the protein consumed by the population (Trigo and Lechuga, 2001).
1 Visiting Scholar at Agricultural Economics Department, Purdue University, West Lafayette, IN 47907, USA; and Professor of
the Economics and Social Sciences Faculty, Autonomous University of Sinaloa, Culiacan, Sin, Mex. C.P. 80010.Tel.:+52 (667) 716-1128. E-mail address: [email protected]
2 PhD Student at the Economics and Social Sciences Faculty, Autonomous University of Sinaloa, Culiacan, Sin, Mex. C.P. 80010
Mexico is the fifth largest consumer of corn in the world (253 kg/per capita). According to Becerra (2014) for the year 2010, apparent consumption amounted to 30.5 million tons, of which 25% was imported.
The high levels of productivity of farmers from Sinaloa relative to nationwide average are particularly interesting.According to official data from the Department of Agriculture (SIAP-SAGARPA, 2017) in 2016 Sinaloa was the main corn producer with a total production of 6.4 milliontons, which allows it to obtain the first place in the national ranking of corn production, with a 23% share. Sinaloa’s productivity is remarkable.
On average it produces 10.6 tons per hectare which is more than 2.8 times of the country’s average yield (3.7 ton/ha), and very high compared to the world’s average productivity (4.6 ton/ha).Some local farmers have been able to achieve 14 ton/ha, which implies that there is within the state of Sinaloa a potential to increase the productivity of corn. It is therefore necessary to estimate the prevailing level of technical efficiency/inefficiency, as well as demographics, socio-economics, and management specific characteristics that impact corn production.If we assume all farmers face the same technology and have access to the same inputs, we can ask, what drives efficiency? What are the farm specific characteristics that allow some farmers to achieve the best performance? To address these questions, we test a set of farm specific characteristics using the Stochastic Frontier Model (SFM) first developed by Aigner, Lovell, and Schmidt (1977). Although we considered a number of such characteristics, we are particularly interested in determining whether belonging to the Confederation of Agricultural Associations of the State of Sinaloa (CAADES, for its acronym in Spanish) increases farm efficiency.Founded in 1932, CAADES is an agency aimed at increasing farmers’ competitiveness independent of farm type (fruits, grains, vegetables, etc.) and size. Some of its main functions include: giving farmers support and guidance to get access into new-international markets.It also negotiates with input suppliers to get lower input prices for its associates. In addition, it helps farmers in the process of getting financial loans from domestic and international institutions. Finally, CAADES promotes extension and research and agricultural development. These are just some of the main functions and certainly, one might think that farmers are better off being members of such agency. However, many farmers in Sinaloa decide not to associate with CAADES. In fact, in the data we use for this study, around 48% of surveyed farmers reported to have links with the agency. This raises the next questions: why do some farmers decide not to belong to CAADES? And, does CAADES really drive farmers’ technical efficiency in the Sinaloa valley? To address these research questions we analyze primary data through the estimation of a stochastic frontier efficiency model. Specifically, this study intends to determine if CAADES membership alters the level of technical inefficiency of corn producers in the Sinaloa valley. Thus, we set the null hypothesis, H0: CAADES membership helps to decrease the level of technical inefficiency of corn producers
in the Sinaloa valley. Methods
Empirical Model
In the SFM model, Technical Efficiency (TE) is defined as the firm’s ability to produce the maximum amount of output given a set of inputs and technology. Stated in a different way, Technical Inefficiency (TI) refers to the gap between the benchmark firms, which maximize operating characteristics and thus lies over the efficient frontier and firms that lie below the efficient frontier.See fig.3 for a visual illustration of this analysis. Thus, in contrast to a regular production function, SFM allows for inefficiency as it does not assume that all farmers are producing the best possible outcome. The models for estimating the TE or TI can be classified into two basic categories: parametric and non-parametric. The models of the first category are commonly called Stochastic Frontier Models (SFM), while the second Data Envelopment Analysis (DEA). The main difference between the two categories is that parametric frontier model relies on a specific functional form, whereas non-parametric frontier models do not (Amor and Muller, 2010). In this study, we use the parametric approach because of data limitations.
Source: Adapted from Luo and Homburg, 2008.
The main advantage of SFM over the traditional Ordinary Least Squares (OLS) is that the latter yields estimation just on the average firm; whereas the estimation of a SFM will be most heavily influenced by the best performing firms and hence reflect the technology they are using. Also, the frontier function represents a best-practice technology against which the efficiency of firms within an industry can be measured (Coelli, 1995). Following Chavez et al. (2012), the essential form of the model is:
𝑦𝑖 = 𝑓 𝛽′𝑋
𝑖 + 𝑒𝑖 (1).
Where 𝑦𝑖 is the output of the ith farmer in the sample (i=1,2,…, I), 𝑋𝑖is a (1×k) vector of input quantities
used by the ith farmer, βis a (k×1) vector of parameters to be estimated, 𝑓 𝛽′𝑋
1 is a parametric form of underlying
technology, 𝑒𝑖is a stochastic error term as denoted by Batesse and Coelli (1995). 𝑒𝑖 = 𝑣𝑖− 𝑢𝑖(2)
Where𝑣𝑖 is the symmetric component, it accounts for random variation in output due to factors outside the
farmer’s control (rainfall, extreme weather), 𝑣𝑖is two-sided statistical noise component and it is assumed to be
independently and identically distributed as𝑁 0, 𝜎𝑣2 independent of 𝑢
𝑖. And𝑢𝑖 is a non-parametric random variable,
associated with technical inefficiency. The asymmetric component 𝑢𝑖is a non-negative random variable and it is assumed to be independently distributed with truncations (at zero) of the normal distribution with mean 𝜇𝑖and variance,𝜎𝑢2 𝑁 𝜇𝑖, 𝜎𝑢2 (Kumbhakar and Lovell, 2002). Following this logic, the mean of technical inefficiency
effects,𝜇𝑖, can be specified as: 𝜇𝑖− 𝛿𝑘𝑍𝑘(3)
Where𝑍𝑘 is a (1×m) vector of farm-specific variables associated with technical inefficiency, and𝛿𝑘 is a (m×1)
vector of unknown parameters to be estimated.
Thus, the variance of𝑒𝑖 is𝜎2 = 𝜎
𝑢2+ 𝜎𝑣2, and the standard error is calculated as: 𝛾 =𝜎𝑢
2
𝜎𝑣2, the parameter gamma determines whether a SFM is preferred as opposed to a traditional production function model (Kalirajan, 1981). If we fail to reject the null𝐻0: 𝛾 = 0implies the absence of a stochastic frontier in terms of production. Under
this horizon, TE could be written as:
𝑇𝐸𝑖 =𝑓 𝑋 𝑦𝑖
𝑖𝛽 𝑒𝑥𝑝 𝑣𝑖 (4)
This is the ratio of observed output to the maximum possible output given technology characterized by exp 𝑣1 . And𝑦𝑖 reaches its maximum of 𝑓 𝑋𝑖,𝛽 𝑒𝑥𝑝 𝑣𝑖 only when 𝑇𝐸𝑖 = 1. If𝑇𝐸𝑖 < 1 then we have a gap
between the observed output of farmer ith and the maximum possible output characterized by 𝑣1 . We can reframe
equation (1) as:
𝑦𝑖 = 𝑓 𝛽𝑋𝑖 𝑒𝑥𝑝 𝑣𝑖 𝑒𝑥𝑝 −𝑢𝑖 (5)
In equation (3)𝑇𝐸𝑖 = 𝑒𝑥𝑝 −𝑢𝑖 for simplification of the analysis this is the structural form used in this work.
Assuming𝑓 𝛽𝑋𝑖 behaves as a Cobb-Douglas function, the SFM transforms to
𝐿𝑜𝑔𝑦𝑖 = 𝛽0+ 𝛽𝑛𝐿𝑜𝑔𝑋𝑛𝑖 + 𝑣𝑖− 𝑢𝑖 (6) For our purposes, the empirical model takes the form
Where 𝑌𝑖is the observed output of the ith farm, 𝑥1is labor, 𝑥2is money spent on water per hectare,𝑥3 is quantity of
fertilizer, 𝑥4is capital and𝑥5is money spent per hectare during the planting cycle in order to capture those
administrative expenditures such as communications and other office duties. And𝛽′𝑠 are parameters to be estimated. We use the Battese and Coelli (1996) inefficiency model to estimate TI. The model is specified as:
𝑢 = 𝛿0+ 𝛿1𝑧1+ 𝛿2𝑧2+ 𝛿3𝑧3+ 𝛿4𝑧4+ 𝛿5𝑧5+ 𝑒1 (8)
Here,𝑢 is the inefficiency effect,𝑧1 is a dummy variable =1 when the ith farmer is a member of CAADES, 0 otherwise, 𝑧2is farmers’ level of education, 𝑧3is age of farmer, 𝑧4is a dummy variable =1 when the farmers owns the planting area, 0 otherwise; 𝑧5is a dummy variable to differentiate farmers that conducted a soil analysis prior to the production process, all variables are fully described in table 1.
2.2 Data collection method
The data collected for this project are primary data. They were obtained through a personal interview with farmers located in the Sinaloa region of interest through a survey. The interviews were held during the "Expo-Agro Sinaloa 2016", the largest technology exhibition in Mexico, held annually in Culiacan, Sinaloa.
This event conglomerates buyers and sellers of the agricultural industry. It is a popular event for the farmers of the region.Expo-Agro Sinaloa is organized to promote economic transactions between farm input suppliers and farmers. Numerous companies utilize this event to introduce their innovations and gain a larger customer base. The event is also recognized as a good forum where agricultural researchers present their work. In early February 2016 we attended the event and asked farmers to complete our survey.Two hundred and thirty-three farmers were randomly selected and surveyed. They were asked to quantify a full set of inputs in order to capture the production function, as well as some personal characteristics needed to assess the notion of efficiency on the second stage of the SFM. Of the original 233 surveys, 4 questionnaires were eliminated due to unrealistic responses. Thus, we were able to get 229 responses during the field-work. The estimations were conducted using the econometric software LIMDEP 10, and the currency is Mexican Pesos (MXP).
Results and discussion
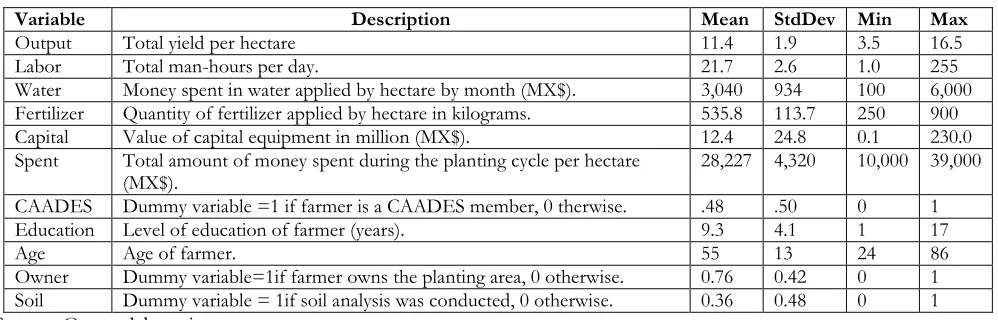
The results regarding characteristics that are influencing the technical efficiency of corn production were very exciting and robust. Table 1 presents descriptive statistics for variablesincluding names, units, means, standard deviations, and minimum and maximum values. It shows that the average yield per hectare is around 11tons using 22 hours of labor per day, 536 kilograms of fertilizer, spending around 3,000 MXPon water per hectare, with an average capital of 12 millions of MXP. In addition, the average total cost of the planting cycle equals 28,200 MXP per hectare.We find that only 48% of farmers belong to CAADES,which is consistent with other studies that show that the ratio of membership in agricultural groups is 40% (Viengpasith, Yabo, and Sato, 2012). Further, we found that the average age of farmer is 55. Farmers in the sample are well educated compared with farmers from other developing countries. On average they have completed 9 years of formal education. Seventy six percent are property owners and 64% completed the planting cycle without conducting any soil analysis.
Table 1Variable descriptions and summary statistics.
Variable Description Mean StdDev Min Max
Output Total yield per hectare 11.4 1.9 3.5 16.5
Labor Total man-hours per day. 21.7 2.6 1.0 255
Water Money spent in water applied by hectare by month (MX$). 3,040 934 100 6,000
Fertilizer Quantity of fertilizer applied by hectare in kilograms. 535.8 113.7 250 900
Capital Value of capital equipment in million (MX$). 12.4 24.8 0.1 230.0
Spent Total amount of money spent during the planting cycle per hectare
(MX$). 28,227 4,320 10,000 39,000
CAADES Dummy variable =1 if farmer is a CAADES member, 0 therwise. .48 .50 0 1
Education Level of education of farmer (years). 9.3 4.1 1 17
Age Age of farmer. 55 13 24 86
Owner Dummy variable=1if farmer owns the planting area, 0 otherwise. 0.76 0.42 0 1
Soil Dummy variable = 1if soil analysis was conducted, 0 otherwise. 0.36 0.48 0 1
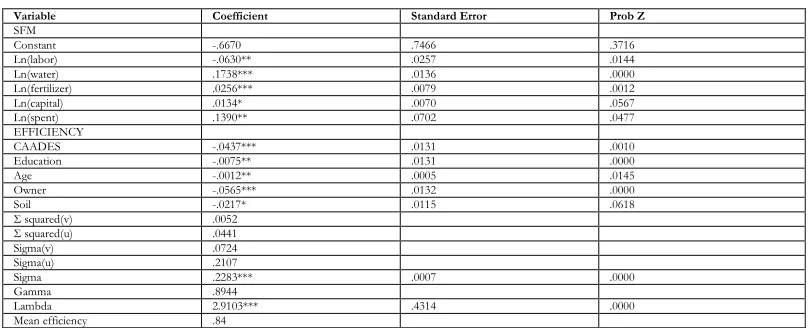
Regarding SFM and efficiency estimates we found a sigma-squared coefficient (0.2283) significant at the 1% level, indicating a good fit of the model and that the assumption of the compound error term is correct. The gamma (γ), parameter is close to one, suggesting that differences in corn production in the Sinaloa valley are due to technical inefficiency.As Batesse and Coelli (1996) noted, it indicates that the random component of the inefficiency effects does make a significant contribution in the analysis of agricultural production. This result confirms the presence of the one-sided error component in the specified model and thus, the traditional OLS model is an inadequate representation of the data. The mean technical efficiency level prevailing in the region is 84%(0.84) indicating that there is room for farmers to increase their efficiency by 16% with the available inputs and current technology.
The minimum level of TE= 0.67 and the maximum TE= 0.98Before analyzing the results of the inefficiency parameters, it is interesting to notice that a negative sign on an inefficiency parameter implies that the associated variable has a positive impact on technical efficiency or a decrease in inefficiency; whereas a positive sign on the inefficiency parameters means the associated variable negatively impacts technical efficiency. In support of our prediction, the results suggest that CAADES has negative value of -0.0437 and it is significant at the 1% level, indicating that farmers that are CAADES members tend to be slightly more productive that their counterpart non-CADES members. Thus, we failed to reject the null hypothesis. The reason underlying this interpretation is that CAADES helps its members to access new markets, increasing the chance to get better sale prices. CAADES members also have more access to information about technology and how apply it to farm practices. CAADES also provides some technical assistance.Moreover, it also gives associates better opportunities to access financial loans.
Hence membership to CAADES is a crucial factor for farmers accessing agricultural information and enhancing their ability to apply agricultural technology.The coefficient of education has a negative sign and is statistically significant at the 5% level, indicating that farmers with higher level of education tend to have higher level of efficiency. Education is very important in agriculture.Educated farmers have the opportunity of make better decisions through more access to information on production systems, technology, input prices, and overall, they are better able to interpret the market signals. In addition, educated farmers tend to be more innovative and are more willing to use hybrid seeds, machinery, and pesticides.
Results show that capital is also a variable that reduces technical inefficiency of farmers.Although it is not significant, it has the expected sign. It should be noted that the capital variable includes different items, as tractors, trucks, warehouses, etc. Thus, farmers with higher levels of capital are assumed to implement better agricultural practices.Age coefficient is negative, suggesting that older farmers tend to be more efficient than younger farmers. We attribute this relationship to experience that farmers acquirewith age.As we expected, the coefficient of land ownership was important. It was significant at 1%, which implies that it is a characteristic important that is influencing the technical efficiency of the corn producer.Table 2 presents the results.
Table 2 Stochastic frontier model and efficiency estimates.
Variable Coefficient Standard Error Prob Z
SFM
Constant -.6670 .7466 .3716
Ln(labor) -.0630** .0257 .0144
Ln(water) .1738*** .0136 .0000
Ln(fertilizer) .0256*** .0079 .0012
Ln(capital) .0134* .0070 .0567
Ln(spent) .1390** .0702 .0477
EFFICIENCY
CAADES -.0437*** .0131 .0010
Education -.0075** .0131 .0000
Age -.0012** .0005 .0145
Owner -.0565*** .0132 .0000
Soil -.0217* .0115 .0618
Σ squared(v) .0052 Σ squared(u) .0441 Sigma(v) .0724 Sigma(u) .2107
Sigma .2283*** .0007 .0000
Gamma .8944
Lambda 2.9103*** .4314 .0000
Mean efficiency .84
Conclusions
The present study has estimated the level of technical efficiency of corn producers in Sinaloa, Mexico, and identifies farm-specific characteristics influencing efficiency. The data were obtained directly from farmers located in the interest region of Sinaloa via a survey. A Stochastic Frontier Model was used to examine technical efficiency using the computer software LIMDEP 10.The key findings were that the estimated coefficients for labor, water, fertilizer, level of capital and total amount of money spent per hectare were positive for corn production. Indicating that if any of these inputs were increased, there could be an increase in crop yields, and increase of returns of capital.The technical efficiency of farmers in the region of interest was 84%. The implication is that technical efficiency in corn production in Sinaloa could be improved by 16% through a better use of available resources and current technology.Also significantly related to technical efficiency were farmer’s level of education, farmer’s age, land ownership, soil analysis, and CAADES membership.
Higher level of education and experience gained through time imply that farmers are more likely to obtain higher technical efficiency. Thus, age and level of education enhance agricultural production development as well as decisions to improve its productivity. Farmers who own the planting area tend to be more efficient than their counterparts, farmers who rent the land. In addition, producers who conduct soil analysis are also more efficient. Finally, farmers that are CAADES members are more likely to be technically efficient than those who are not. It could be said that CAADES membership played a critical role in farming productivity. This is important in terms of policy development. Policy makers could encourage farmers to become CAADES members. In addition, government could decide to foster CAADES participation in the agriculture industry through subsidies aimed to enhance the benefits of being a CAADES member.
This study could be replicated in other productive areas of the country, like Jalisco and Michoacan, other top producing agricultural states. It might be the case that the main producer (Sinaloa) is not the most efficient. Furthermore, the methodology could be useful to address the relative importance of farmers’ associations around the world, which aim to improve farmers’ performance.To the best of our knowledge, this is the first study that addresses the level of technical efficiency in the region, and the first one in determining if membership to an agricultural association or group impacts farmers’ productivity in the state of Sinaloa, Mexico. However, this study is not without limitations.First, the study might be improved with a larger sample size. A larger sample size would probably show more variation in output and thus the level of technical efficiency could vary. In addition, the study could be conducted using different specifications of Stochastic Frontier Model like the truncated-normal, exponential, and/or normal-gamma specifications, with the objective of comparing the results to determine if a different specification would be preferable. Furthermore, a non-parametric model could be considered, like Data Envelopment Analysis.Finally, more research should be conducted in order to absolutely determine if CAADES membership is really making a significant difference in the agricultural field. Efforts should be made to test if CAADES also makes a significant contribution for other farm types, like tomatogrowers, and others. Because one of the main benefits of CAADES membership is the opportunity to access international markets, produce oriented to exportation should be considered as the predicted variables.
References
Aigner, Dennis, C.A.K. Lovell, & Peter Schmidt (1977). Formulation and Estimation of Stochastic Frontier Production Function Models, Journal of Econometrics, 6 (1), 21–37.
Ali Jabir & Gupta Bardhan (2011). Efficiency in Agricultural Commodity Futures Markets in India. Evidence from Cointegration and Causality Tests. Agricultural Finance Review. Vol. 71 No. 2 pp. 162-178.
Amor, Tawfik Ben, & Christophe Muller (2010). Application of Stochastic Production Frontier in the Estimation of Technical Efficiency of Irrigated Agriculture in Tunisia. Agricultural Journal 5.2 50-56.
Anderson KiprutoKipkoech, Dagmar Mithöfer, Wilson K. Yabann, Henry K. Maritim, & Fritz Schulthess (2008). Assessing yield and efficiency implications of relying on parasitoids for control of cereal stemborers: The case of small-scale maize farmers in Kenya, Crop Protection, Volume 27, Issue 10, (October), Pages 1318-1326, ISSN 0261-2194, 10.1016/j.cropro.2008.04.005.
Batesse, G. & Coelli T. A. (1996). Identification of Factors Which Influence the Technical Inefficiency of Indian Farmers. Australian Journal of Agricultural Economics. Vol. 40, N0. 2(August), pp. 103-128.
Becerra, L. A. (2014). La producción de etanol en México: insumos, procesos y oxigenación de gasolina. Universidad Autonoma de Sinaloa. ISBN: 978-607-737-027-7. Pp. 217.
Bhattacharyya Aditi, & Pal Sudeshna (2011). Financial Reforms and Technical Efficiency in Indian Commercial Banking: A generalized Stochastic Frontier Analysis. Journal of Economic Literature, Vol. 49.No. 4, November.
Chavez, Holcer, Denis A. Nadolnyak, & Joseph Kloepper (2012). Stochastic Frontier Analysis of Biological Agents (Microbial Inoculants) Input Usage in Apple Production. Annual Meeting, February 4-7, Birmingham, Alabama. No. 119796. Southern Agricultural Economics Association, 2012.
Chen, Z., & Song, S. (2008). Efficiency and Technology Gap in China's Agriculture: A Regional Meta-Frontier Analysis. China Economic Review, 19(2), 287-296.
INEGI, Geographic Information System(2017). [Online] http://www.inegi.org.mx/geo/contenidos/mapadigital/ (June 5, 2017).
Kalirajan, K.P (1981).An Econometric Analysis of Yield Variability in Paddy Production. Canadian Journal of Agricultural Economics, 29,283-294.
Kibaara B. W., &Kavoi M. (2012).Application of Stochastic Frontier Approach Model to Assess Technical Efficiency in Kenya’s Maize Production.JAGST, Vol. 14. No. 1
Kumbhakar C. Lovell C. A. (2002). Stochastic Frontier Analysys. The Economy Journal Vol. 112, No. 477, pp. F156-F158.
Luo, X., & Homburg C. (2008). Satispaction, Complaint, and the Stock Value Gap. Journal of Marketing. (July): 72:29-43. Available from: Communication & Mass Media Complete, Ipswich, MA.
Pauw K., McDodald S., &Punt C. (2007). Agricultural Efficiency and Welfare and South Africa.Development Southern Africa. (June) 24(2)309-333. Available from: EconLit with Full Text, Ipswich, MA. Accessed December 1, 2016.
Trigo, Massieu, & Lechuga Yolanda Jesús (2002). El Maíz en México: Biodiversidad y Cambios en el Consumo. Análisis Económico, XVII, segundo semestre, 281-303.
Viengpasith, V., Yabe, M., & Sato, G. (2012). Analysis of Technical Efficiency of Smallholder Maize Farmers in Northern Lao PDR: Case Study of Paklay District, Sayaboury Province 57(1), 309-315.
SAGARPA-SIAP (2016). Atlas Agroalimentario 2016, p.102.
SIACON-SAGARPA (2017). [datebase, Online] Available: https://www.gob.mx/siap/acciones-y-programas/produccion-agricola-33119 (May 15, 2017).