ISSN: 2334-2382 (Print), 2334-2390 (Online) Copyright © The Author(s). 2014. All Rights Reserved. Published by American Research Institute for Policy Development
Geographic Statistical Analysis of the Relationship between
Foreign Aid and Foreign Investment
Dr. Michael Nicholson1
Abstract
Global demarcations exist between development aid and foreign direct investment. In some core areas, however, certain cross-regional patterns are quite strong relative to trends in other regions. Rigorous statistical analysis that contrasts the relative influences of time-series panel data clusters “super-regions” with otherwise widely varying characteristics, classified as either “aid-oriented” or “investment-oriented” regions. As stated explicitly when setting out the identification strategy below, this paper is agnostic as to whether “aid causes growth” or “investment causes growth.” We are quite vigorous, however, in analyzing whether and when aid might “cause” investment. A series of Granger causality tests that incorporate recent innovations in the analysis of heterogeneous panel data demonstrate that global demarcations exist between foreign aid and foreign investment that differ substantially among various regions. Evidence-based support for international development policy should appropriately account for these cross-region similarities when developing policies on the incentives for foreign investment and market-based economic growth.
Keywords: foreign aid, foreign direct investment, panel data, cointegration
JEL Classification: F35, C23, O24
1. Introduction
Regional demarcations exist between development aid and foreign direct investment. In some core areas, however, certain cross-regional patterns are quite strong relative to trends in other regions.
Rigorous statistical analysis that contrasts the relative influences of time-series panel data clusters countries into “super-regions” with otherwise widely varying characteristics, classified as either aid-oriented or investment-oriented regions.
The basis of analysis for the present paper is foreign aid and foreign direct investment in the context of economic growth in developing countries. Foreign aid, referred to in this paper as official development aid (ODA), has been the subject of significant controversy in recent years in reference to the question of whether aid causes growth.2 Tangential to this question is whether foreign aid causes foreign direct investment (FDI), with an answer common to both that “it depends.” As stated explicitly when setting out the identification strategy below, this paper is agnostic as to whether “aid causes growth” or “FDI causes growth.” We are quite vigorous, however, in analyzing whether and when aid might “cause” investment.
A series of Granger causality tests that incorporate recent innovations in the analysis of heterogeneous panel data demonstrate that global demarcations exist between foreign aid and FDI that differ substantially among various regions.3 The tests allow for regions and sub-groups to self-identify: that is, the data defines the regions. In this case, the data reveals regional geographies, which we label aid-oriented regions, including South Asia, Middle East/North Africa, and sub-Saharan Africa, as compared with investment-oriented regions, including East Asia/Pacific, Latin America/Caribbean, and Europe/Central Asia.
This analysis incorporates the OECD definition of official development assistance as the “flows of official financing administered with the promotion of the economic development and welfare of developing countries as the main objective, and which are concessional in character with a grant element of at least 25 percent (using a fixed 10 percent rate of discount).”4 We define FDI as net inflows of investment to acquire a lasting management interest (10 percent or more of voting stock) in an enterprise operating in an economy other than that of the investor. It is the sum of equity capital, reinvestment of earnings, other long-term capital, and short-term capital as shown in the balance of payments.5As our focus is on capital flows to the developing world, for expedition we refer herein specifically to FDI flows to lower and middle income countries as defined by the World Bank.
2 Most relevant discussions begin with Easterly (2006), Sachs (2006), and Banerjee and Duflo (2011).
See also Burnside and Dollar (2000), Hansen and Tarp (2000, 2001).
3Hurlin and Venet (2001), Hurlin (2005), Hood, Kidd and Morris (2008), Fowowe (2011). 4 http://stats.oecd.org/glossary/detail.asp?ID=6043
This paper is not directly concerned with “aid effectiveness”, nor does it address popular, controversial questions about whether “aid causes growth” or whether “FDI causes growth.”
We ask the specific statistical question whether ODA “Granger-causes” FDI, a concept defined in the empirical section below and based on techniques developed by Hurlin and Venet (2001).Section 2 reviews literature that places this question in a more general context of whether foreign aid and foreign direct investment are substitutes or complements.
Section 3 outlines the identification strategy and clarifies the underlying identifying assumptions. The empirical ansalysis begins in Section 4 with a comparison of ODA and FDI trends across regions. Basic statistical correlations suggest similar relationships in Middle East/North Africa and South Asia that may be more similar than different to those of sub-Saharan Africa. We therefore refer to these three regions as aid-oriented.
Section 5 subjects these statistical indicators to rigorous econometric analysis. Arellano (2003) provides a comprehensive description of the value in exploring heterogeneity across different time-series panels, which for present purposes we aggregate to regions of countries. By implementing unit root and cointegration tests at the regional level, we find preliminary support for the hypothesis that South Asia, Middle East/North Africa, and sub-Saharan Africa exhibit distinct characteristics among the relationships of their ODA and FDI flows.
Section 6 concludes with a review of the results, which support the initial statistical review that draws the global demarcation in the relationship of foreign aid and foreign direct investment between aid-oriented and investment-oriented regions.
2. Literature Review
One prominent strand of the relevant literature suggests that foreign aid is most effective in “good policy environments.”6Alesina and Dollar (2000) find that ODA responds to political variables, such as rule of law, while FDI responds to good economic policy, but no statistical evidence that a mutual dependence between FDI and ODA exists. The strategic considerations accompanying aid allocations do not appear to impact FDI. Private capital flows go to relatively higher income countries, which the authors conclude is due to their market size. Presumably, therefore, even with good rule of law and sound economic policies, low-income countries cannot expect to receive FDI.
Harms and Lutz (2006), nevertheless, find “stubbornly robust” indications that foreign aid has a positive, significant impact on foreign investment in countries with a substantial regulatory burden: under these circumstances, aid works in poor policy environments. In contrast, countries with average institutional characteristics yield a marginal effect of aid on investment close to zero. Kimura and Todo (2010) identify no statistical relationship between foreign aid and foreign investment at the aggregate level but do find a “vanguard effect” in the relationship between Japanese aid and Japanese foreign investment.
Asiedu and Villamil (2002) suggest that foreign direct investment could be a substitute for development aid, citing Rodrik (1995) in that private capital flows could substitute completely for multilateral development assistance, while ODA can also be a complement to FDI by affecting incentives for investment. As we show below, in many parts of the world FDI has not just substituted for ODA, but has very dramatically overtaken it as a source of capital flows. Asiedu, Nandwa, and Jin (2009) demonstrate in an empirical analysis that ODA can mitigate the negative impact of country risk on inward FDI, but estimate that the amount of ODA would need to double (an “implausibly high” level) for ODA to completely offset risks based on contract modifications, restrictions on profit repatriation, and payment delays.
6 See, among others, Burnside and Dollar (2000), Hansen and Tarp (2001), Dalgaard and Hansen
Bruner and Oxoby (2009) analyze the role of property right institutions, finding that deficient institutions impair the ability for ODA to stimulate investment.
Similarly, Bezuidenhout (2009) uses panel estimates on Southern Africa to find a negative relationship between FDI and growth, but no statistical relationship between ODA and growth; he does not compare the relationship between foreign aid and foreign direct investment.
Karakaplan, Neyapti, and Sayek(2005) investigate the hypothesis that countries receiving ODA create direct or indirect (signaling) effects in an economy that attracts FDI. Their results suggest that ODA and FDI flow together in the presence of good governance and financial market development. In a side point, the authors provide a control for sub-Saharan Africa in their regressions, and find that relatively higher GDP per capita appears to be related to less FDI in Africa. We discuss the implications below with specific attention to whether Africa is, indeed, different.
3. Identification
Foreign direct investment, however, has been shown to go to good economic environments. Alesina and Dollar (2000) identify political and economic determinants of ODA and FDI.
They find that ODA responds more to political variables, such as democratization, while FDI responds to economic incentives, which include good policy environments, trade liberalization, and property right protection. Asiedu,Nandwa, and Jin (2009) discuss how FDI and ODA might be jointly determined by general conditions in the country. Foreign assistance might be provided by altruism or for strategic reasons, with the former including: lowering poverty; helping a country meet its debt obligations; or restoring internal balance in a country. They find that the multilateral and bilateral donors are both interested in helping reduce poverty or heavily indebted countries, but bilateral aid is not as well motivated on macroeconomic instability as on multilateral aid.
For a proper econometric specification, the key identifying assumption is that FDI may respond to policy environments but does not, itself, “create” a good policy environment. We further assume that FDI does not “cause” ODA, although remain open to the possibility of multinational firms affecting domestic political economy decisions. The analysis herein remains agnostic as to whether ODA or FDI can “cause” GDP growth.
4. Data
We collected GDP, FDI, and ODA data in both current and constant 2008 U.S. dollars for developing countries in six regions as classified by the World Bank: East Asia/Pacific (EAP), Europe/Central Asia (ECA), Latin America/Caribbean (LAC), Middle East/North Africa (MENA), South Asia (SAS), and sub-Saharan Africa (SSA). Table A-1 in the Appendix provides a list of countries in each region.
After 1990, however, the amount of FDI to developing countries grew over 26 times to $597 billion in 2008, before dropping off to $359 billion in 2009. At the same time, ODA simply doubled to $126 billion in 2008, rising again to $127 billion in 2009, in current U.S. dollars.
In constant U.S. dollars, foreign aid rose from $84 billion in 1990 to $130 billion in 2009, less than doubling in size. The ratios have reversed, and now FDI to the developing world is two to four times the size of ODA flows. Such contrasting trends call into question whether the now-swamped ODA flows can “cause” such a massive FDI surge. An alternative hypothesis might argue that the ODA prior to 1990 “set up” the necessary conditions for subsequent FDI flows.
Figure 1: FDI and ODA for Lower/Middle Income Countries
Source: World Development Indicators
As shown in Figure 2, FDI flows to different regions appear to be more correlated than similar ODA flows. FDI tends to move in synch across regions to a greater extent than ODA in a manner that suggests FDI is determined more by market forces and ODA by relatively non-economic concerns. FDI is also more volatile than ODA, as the coefficients of variation, in Figure 1 are 1.43 for FDI and 0.67 for foreign aid. (Coefficients of variation are a normalized measure of probability distribution, the standard deviation divided by the mean.) Development assistance flows, unlike FDI, did not fall with the globalrecession, and in fact rose in every region but Middle East/North Africa.
0.0 2.0 4.0 6.0 8.0 10.0
$0 $100 $200 $300 $400 $500 $600 $700
R
at
io
s
o
f
O
D
A
a
n
d
F
D
I
B
ill
io
n
s
o
f
U
S$
Note also the substantial difference in scale: sub-Saharan Africa and Middle East/North Africa receive far more ODA relative to FDI than the other regions. As Asiedu, Nandwa, and Jin (2009) point out, determinants of FDI in sub-Saharan Africa may be different than in other regions.
Figure 2: FDI and ODA since 1990 (billions of US$)
Source: World Development Indicators
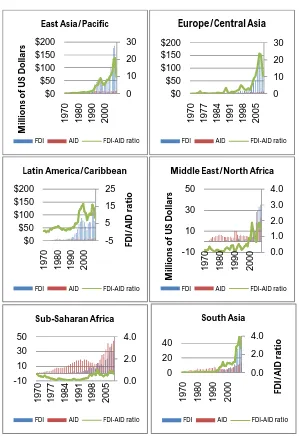
Figure 3 disaggregates the data on FDI and ODA flows into specific regions. Note the dramatic difference in scales between the two rows of diagrams. For the top row, FDI flows approached $200 million in the late 2000’s, while the bottom row never topped $50 million.
$0 $50 $100 $150 $200 1 9 7 0 1 9 7 4 1 9 7 8 1 9 8 2 1 9 8 6 1 9 9 0 1 9 9 4 1 9 9 8 2 0 0 2 2 0 0 6
FDI
EAP ECA LAC
MNA SAS SSA
$0 $10 $20 $30 $40 $50 19 7 0 19 7 4 19 7 8 19 8 2 19 8 6 19 9 0 19 9 4 19 9 8 20 0 2 20 0 6
ODA
EAP ECA LAC
Moreover, the FDI/ODA ratio for the first set of regions (investment-oriented) approaches 25, while the same ratio for the second set (aid-(investment-oriented) never tops 4.0.
Figure 3: Regional FDI/ODA Comparison
Source: World Development Indicators
0 10 20 30 $0 $50 $100 $150 $200 1 9 7 0 1 9 8 0 1 9 9 0 2 0 0 0 M ill io n s o f U S D o lla rs East Asia/Pacific
FDI AID FDI-AID ratio
0 10 20 30 $0 $50 $100 $150 $200 1 9 7 0 1 9 7 7 1 9 8 4 1 9 9 1 1 9 9 8 2 0 0 5 Europe/Central Asia
FDI AID FDI-AID ratio
-5 5 15 25 $0 $50 $100 $150 $200 1 9 7 0 1 9 8 0 1 9 9 0 2 0 0 0 FD I/ A ID r a ti o Latin America/Caribbean
FDI AID FDI-AID ratio
0.0 1.0 2.0 3.0 4.0 -10 10 30 50 1 9 7 0 1 9 8 0 1 9 9 0 2 0 0 0 M ill io n s o f U S D o lla rs
Middle East/North Africa
FDI AID FDI-AID ratio
0.0 2.0 4.0 -10 10 30 50 19 7 0 19 7 7 19 8 4 19 9 1 19 9 8 20 0 5 Sub-Saharan Africa
FDI AID FDI-AID ratio
0.0 2.0 4.0 0 20 40 1 97 0 1 98 0 1 99 0 2 00 0 FD I/ A ID r at io South Asia
One implication could be that FDI moves in synch for the investment-oriented regions, while ODA does so for aid-investment-oriented regions.
Table 1 provides some scattered support for these predictions, showing that correlations across regions are much stronger for FDI than for ODA but with no obviously discernible pattern.
Table 1: Correlations FDI_ODA by Region
FDI ODA
EAP ECA LAC MNA SAS SSA EAP ECA LAC MNA SAS SSA
EAP 1 0.93 0.92 0.91 0.89 0.95 1 0.79 0.92 0.54 0.73 0.79
ECA 0.93 1 0.79 0.98 0.97 0.95 0.79 1 0.87 0.65 0.79 0.88
LAC 0.92 0.79 1 0.77 0.78 0.88 0.92 0.87 1 0.67 0.86 0.92
MNA 0.91 0.98 0.77 1 0.96 0.95 0.54 0.65 0.67 1 0.80 0.82
SAS 0.89 0.97 0.78 0.96 1 0.96 0.73 0.79 0.86 0.80 1 0.94
SSA 0.95 0.95 0.88 0.95 0.96 1 0.79 0.88 0.92 0.82 0.94 1
Source: Author’s Calculations
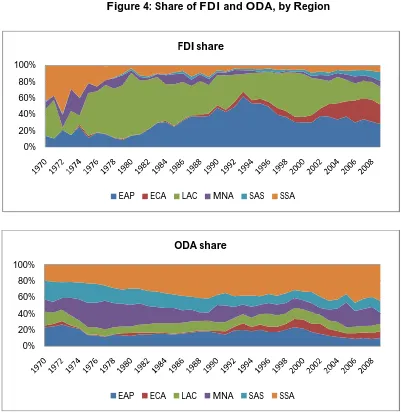
By this reckoning, a global demarcation can be drawn within the geo-economies of developing countries. As shown in Figure 2 above, over the past 40 years, and into 2009, sub-Saharan Africa received the lowest amount of inward FDI while receiving the highest amount of total official development assistance. The FDI flows are driven by multiple factors, including market size, natural resources and political uncertainty. UNCTAD (2011) shows that eight of the ten largest greenfield FDI projects in least-developed countries were in “coal, oil, and natural gas” and another was in “metals.” Five of the ten largest acquisitions in LDCs were in “crude petroleum and natural gas” with another in “ferroalloy ores, except vanadium.”
Figure 4: Share of FDI and ODA, by Region
Source: World Development Indicators
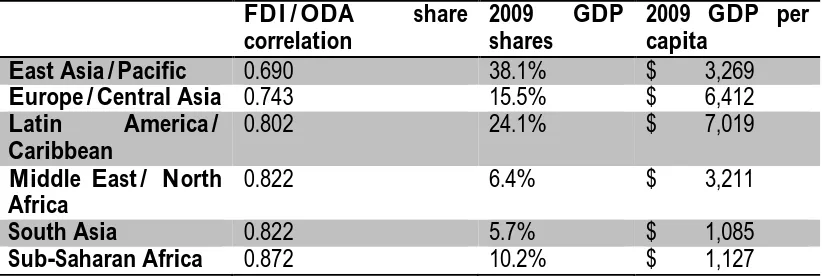
Table 2 displays the correlations of FDI and ODA share for these six regions, along with 2009 GDP shares, and 2009 GDP per capita. The three investment-oriented regions have the lowest correlations between FDI share and ODA share, the lowest shares of GDP, as well as – by slim margins – the highest GDP per capita. We conclude that this first glance at the data suggests a simple, but non-trivial pattern: foreign direct investment follows wealth, while foreign aid does not.
0% 20% 40% 60% 80% 100%
FDI share
EAP ECA LAC MNA SAS SSA
0% 20% 40% 60% 80% 100%
ODA share
Table 2: FDI and ODA Share Correlations
FDI/ODA share
correlation
2009 GDP
shares
2009 GDP per capita
East Asia/Pacific 0.690 38.1% $ 3,269
Europe/Central Asia 0.743 15.5% $ 6,412
Latin America/
Caribbean
0.802 24.1% $ 7,019
Middle East/ North Africa
0.822 6.4% $ 3,211
South Asia 0.822 5.7% $ 1,085
Sub-Saharan Africa 0.872 10.2% $ 1,127
Source: World Development Indicators
5. Panel Cointegration and Causality Tests
Recent innovations in the statistical analysis of longitudinal panel data allow for tests of regional variations in the impact of development on foreign direct investment. The nature of country or regional data over time allows for differing relationships among the different units, but empirical analysis may reveal patterns of commonalities. For example, although Canada and the United States are separate political entities, information about one country can often help predict information about the other. Sometimes, Australia may prove a better predictor of information about Canada than the United States, while there may be situations in which nothing can predict Canadian responses except information about Canada itself. The tests employed in this section help identify the extent that different regions may provide information with regard to the relationship between ODA and FDI.
The results suggest that aid-oriented regions exhibit clear differences in comparison to investment-oriented regions: with regard to the statistical relationship between ODA and FDI, these regions are more similar than they are different.
5.1 Regional Unit Root and Cointegration Tests
We begin by considering the stationarity of the ODA and FDI time series, and whether they may prove co-integrated. A non-stationary time series is one that contains a “unit root”, in the sense that external shocks have persistent effects – that is, in the equation yit= αit+ βitXit+ ρiyi,t-1+ εit, the parameter |ρi|=1. Something that affects last year’s resultant will also affect this year’s resultant and, by extension, next year’s resultant. If |ρi|<1, then the shock will dissipate. As discussed in Banerjee, Dolado, Galbraith, and Hendry (1993), the short run impacts of the disturbance have no tendency to grow systematically over time.
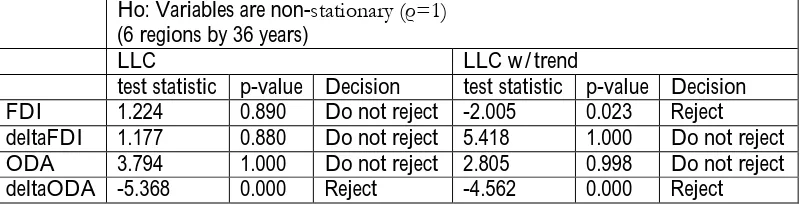
Table 3: Unit Root Analysis for Regional Data
Ho: Variables are non-stationary (ρ=1)
(6 regions by 36 years)
LLC LLC w/trend
test statistic p-value Decision test statistic p-value Decision FDI 1.224 0.890 Do not reject -2.005 0.023 Reject deltaFDI 1.177 0.880 Do not reject 5.418 1.000 Do not reject ODA 3.794 1.000 Do not reject 2.805 0.998 Do not reject deltaODA -5.368 0.000 Reject -4.562 0.000 Reject
If both series are non-stationary, then we consider the possibility of cointegration and the introduction of an error-correction mechanism in the analysis. If two series are co-integrated, then the shocks to one series will persist in the other, and the partial difference would be stable around a fixed mean. In this case the series are drifting together (“correcting”) at roughly the same rate; the error correction mechanism preserves information about both forms of covariation. Murray (1994) has famously illustrated this concept through the story of “the drunk and her dog”, in which a drunkard stumbles out of a bar into a statistical random walk. Her dog would normally follow a random walk as well, but instead is drawn by the error-correction mechanism of its master’s voice, and the drunkard is in turn drawn to the barking of the dog. The two series are then statistically co-integrated. We use the panel cointegration tests of Pedroni (1999) and Westerlund (2007), which account for a potential integrated relationship for cross-sectional panels. Persyn and Westerlund (2008) offer the Stata code “xtwest” for the latter, which we thus incorporate below.
Table 4: Regional Cointegration Tests7
Results for Ho: No Cointegration
xtwest w/trend xtwest w/out trend
Statistics Coeff. p-value Decision Coeff. p-value Decision Group
Statistics
Gt -1.291 0.999 Do not reject 0.083 1.000 Do not reject Ga -7.289 0.955 Do not reject 0.619 1.000 Do not reject Panel
Statistics
Pt -10.277 0.000 Reject -2.659 0.827 Do not reject Pa -40.145 0.000 Reject -6.31 0.148 Reject
Table 5 provides results from a cointegration test for individual regions. The three regions that reject the null of no cointegration are Europe/Central Asia, Middle East/North Africa, and sub-Saharan Africa, which also happen to be the proposed aid-oriented regions.
Table 5: Individual Region Cointegration tests
H0: FDI and ODA are not cointegrated
Region Test Statistic Decision
East Asia/Pacific 11.02 No not reject
Europe/Central Asia 30.14** Reject
Latin America/Caribbean 6.35 Do not reject
Middle East/North Africa 24.52** Reject
South Asia 8.50 Do not reject
Sub-Saharan Africa 18.59** Reject
**significant at 95%
5.2 Regional Causality Tests
A useful test of Granger-causality for panel data has been introduced by Hurlin and Venet (2001) and Hurlin (2005). Hood, Kidd, and Morris (2008) used the test to investigate political party developments in the American South and by Fowowe (2011) on the relationship between financial development and economic growth in sub-Saharan Africa. The basic concept involves a four-step procedure to identify the presence of “homogeneous” causality, in which the independent variables on whole may Granger-cause the dependent variables, or “heterogeneous” causality, in which individual elements are assessed regarding the presence of Granger-causality. The Hurlin and Venet methodology incorporates information from the entire panel for the assessment of individual patterns and develops F test statistics based on specific restrictions.
The basic process involves three specific tests.Test I: Homogeneous Non-Causality (FI)tests against the null hypothesis that ODA does not cause FDI in any manner within the panel. If this hypothesis cannot be rejected then the analysis of the two time series can be safely concluded on this point. Test II: Homogeneous Causality (FII)is built around the hypothesis that ODA causes FDI in a homogeneous fashion throughout the panel. If this hypothesis cannot be rejected, then we can safely conclude that ODA “Granger-causes” FDI in a homogenous fashion across countries. Test III: Heterogeneous Non-Causality (FIII)analyzes the causality of individual panel members, based on information from the full panel of data. As FI indicates the existence of some kind of Granger causality, and FII indicates that the statistical causality is heterogeneous, then FIII tests against the null hypothesis that ODA does not “cause” FDI for specific members of the panel.
For the present model, Table 6 opens with the first two tests of the Hurlin approach: homogeneous non-causality and homogeneous causality. For Test I, the null hypothesis that ODA does not Granger-cause FDI can be rejected for up to two lags in the data. These results suggest that, on the whole, there is no homogeneous non-causality between foreign aid and foreign direct investment. Therefore, there exists causality for at least one member of the panel. Test II investigates whether this relationship holds for the panel as a whole; specifically does a homogeneous causality flow from ODA to FDI? The results suggest that it does not, with homogeneous causality rejected for, again, two lags.
Table 6: Regional Homogeneous Causality and Non-Causality
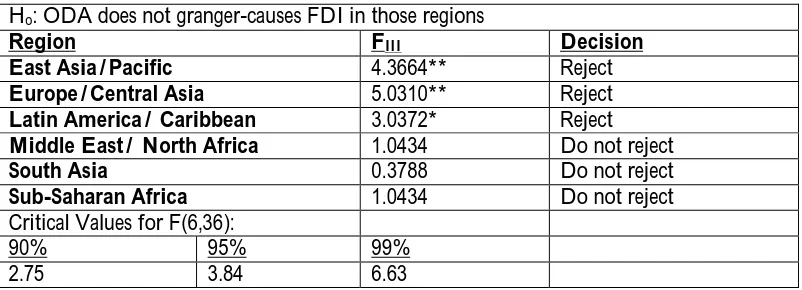
Test III then tests for heterogeneous non-causality, which investigates each individual panel member while incorporating information from the panel as a whole. The results of this analysis are displayed in Table 7. As can be seen, the null hypothesis can be rejected at 95 percent for East Asia/Pacific and Europe/Central Asia and 90 percent for Latin America/Carribean, suggesting that for these regions, ODA Granger-causes FDI.
Table 7: Heterogeneous Non-Causality
Test I: Homogeneous Non-Causality Test II: Homogeneous Causality Ho: ODA does not granger-cause FDI Ho: ODA granger-causes FDI
Lags FI Decision Lags FII Decision
1 1.6463 Reject 1 1.1943 Reject
2 1.4129 Reject 2 1.0738 Reject
3 0.9878 Do Not Reject 3 0.8049 Do Not Reject
Ho: ODA does not granger-causes FDI in those regions
Region FIII Decision
East Asia/Pacific 4.3664** Reject
Europe/Central Asia 5.0310** Reject
Latin America/ Caribbean 3.0372* Reject
Middle East/ North Africa 1.0434 Do not reject
South Asia 0.3788 Do not reject
Sub-Saharan Africa 1.0434 Do not reject
Critical Values for F(6,36):
90% 95% 99%
To further confirm the relationship of our proposed aid-oriented regions, we aggregate individual panel members into supra-regions in order to identify the elements of causation. The results are shown in Table 8 and support the implications of the chart analysis above: ODA interacts differently with FDI in the investment-oriented regions. We conclude that if Africa is different, then western and southern Asia are also different.
Table 8: Supra-Regions
6. Conclusions
Regional demarcations exist between development aid and foreign direct investment.The answer to whether development aid creates incentives for foreign direct investment appears to depend on where the activities occur. We employ innovative techniques for panel cointegration tests and heterogeneous panel causality, and the data shows that the relationship between the capital flows demarcates a clearly defined geo-political marker that tends to trace the Indian Ocean: from sub-Saharan Africa, through North Africa and the Middle East, and into South Asia. Rigorous statistical analysis supports the classification of an aid-oriented region in the sense that for this part of the developing world, foreign aid facilitates foreign direct investment.
One fundamental question not addressed is why this line exists. The question “why doesn’t capital flow to poor countries?” could be properly restated as “why doesn’t capital flow to these specific poor countries?” Development issues are often framed either globally or regionally, with very studies focused on broader cross-regional trends. For example, Asiedu (2002) asks, “Is Africa Different?” and investigates whether drivers of FDI in the developing countries may not have similar force in sub-Saharan Africa. However, the very differences between Africa and the other aid-oriented regions, or even between sub-Saharan Africa and Northern Africa, can help illustrate why they also exhibit similar trends in their aid and investment data that distinguish them from trends in Latin America or East Asia.
If Reject, ODA granger-causes FDI in those regions
Country FIII Decision
FDI-oriented 2.7287 Reject
ODA-oriented 0.7750 Do not reject
Critical Values for F(2, 36):
90% 95% 99%
Evidence-based support for international development, as well as appropriate U.S. foreign policy activities, may benefit greatly by accounting appropriately for these cross-regions similarities when developing policies on the incentives for foreign investment and market-based growth.
References
Alesina A, Dollar D. 2000.Who Gives Foreign Aid to Whom and Why?Journal of Economic Growth5(1): 33-63.
Arellano M. 2003. Panel Data Econometrics.United States; Oxford University Press, Inc. Asiedu E. 2002. On the Determinants of Foreign Direct Investment to Developing
Countries: Is Africa Different? World Development30(1): 107-119.
Asiedu E, Villamil AP. 2002. Imperfect Enforcement, Foreign Investment, and Foreign Aid.Macroeconomic Dynamics6: 476-495.
Asiedu E, Nandwa B, Jin Y. 2009. Does Foreign Aid Mitigate the Adverse Effect of Expropriation Risk on Foreign Direct Investment? Journal of International Economics78(2): 268-275.
Banerjee A, Dolado J, Galbraith JW, Hendry DF. 1993. Co-Integration, Error-Correction, and the Econometric Analysis of Non-Stationary Data. United States: Oxford University Press, Inc.
Bezuidenhout H. 2009. A Regional Perspective on Aid and FDI in Southern Africa.International Advanced Economic Research15:310-321.
Bruner DM. Oxoby RJ. 2009. Can Foreign Aid Buy Investment? Appropriation Through Conflict. Working Paper 09-06, Department of Economics, Appalachian State University.
Clemens M, Radelet S, Bhavnani R, Bazzi S. 2012. Counting Chickens When They Hatch: The Short Term Effect of Aid on Growth. Economic Journal122 (561): 590-617. Fowowe B. 2011. The Finance-Growth Nexus in Sub-Saharan Africa: Panel Cointegration
and Causality Tests. Journal of International Development 23: 220-239.
Hansen H, Tarp F. 2000. Aid Effectiveness Disputed. Journal of International Development12(3): 375-398.
Hansen H, Tarp F. 2001. Aid and Growth Regressions.Journal of Development Economics64: 547-570.
Hood MV, Kidd W, Morris IL. 2008. Two Sides of the Same Coin? Employing Granger Causality Tests in a Panel Framework.Political Analysis 16(3): 324-344.
Hurlin C. 2005.Testing for Granger Causality in Heterogeneous Panel Data Models.Revue Economique56: 1-11.
Hurlin C, Venet B. 2001.Granger Causality Tests in Panel Data Models with Fixed Coefficients. Working Paper Eurisco 2001-09, University of Paris Dauphine.
ImKS,Pesaran MH, Shin Y. 2003. Testing for Unit Roots in Heterogeneous Panels.Journal of Econometrics115(1): 53-74.
Levin A, Lin C-F, Chu C-SJ. 2002. Unit root tests in panel data: asymptotic and finite-sample properties. Journal of Econometrics108: 1-24.
Murray MP. 1994. A Drunk and Her Dog: An Illustration of Cointegration and Error Correction. The American Statistician48(1): 37-39.
Pedroni, P. 1999. Critical values for cointegration tests in heterogeneous panels with multiple regressors.Oxford Bulletin of Economics and Statistics 61: 653-670.
Persyn D, Westerlund J. 2008. Error-correction-based cointegration tests for panel data. The Stata Journal8(2): 232-241.
Rodrik D. 1995.Why is There Multilateral Lending? NBER Working Paper No. 5160.
Rodrik D. 2005.Why We Learn Nothing from Regressing Economic Growth on Policies. Mimeo, Harvard University.
Paper downloaded from http://www.hks.harvard.edu/fs/drodrik/research.html.
UNCTAD.2011. Foreign Direct Investment in LDCs: Lessons Learned from the Decade 2001-2010 and the Way Forward. New York and Geneva: United Nations.
Table A-1: Regional Classifications (World Bank, developing only)
East Asia/ Pacific (EAP)
Europe/ Central Asia (ECA)
Latin America/ Caribbean (LAC)Middle East/
North Africa (MENA)
Sub-Saharan Africa (SSA)
American Samoa
Albania Antigua and BarbudaAlgeria Angola Malawi
Cambodia Armenia Argentina Djibouti Benin Mali China Azerbaijan Belize Egypt Botswana Mauritania Fiji Belarus Bolivia Iran Burkina Faso Mauritius Indonesia Bosnia and HerzegovinaBrazil Iraq Burundi Mayotte Kiribati Bulgaria Chile Jordan Cameroon Mozambique Korea, DR Georgia Colombia Lebanon Cape Verde Namibia Lao PDR Kazakhstan Costa Rica Libya CAR Niger
Malaysia Kosovo Cuba Morocco Chad Nigeria
Marshall Is. Kyrgyz Rep. Dominica Syria Comoros Rwanda Micronesia Lithuania Dominican Rep. Tunisia Congo, DR São Tomé and
Principe Mongolia Macedonia, FYR Ecuador West Bank/Gaza Congo, Rep Senegal Myanmar Moldova El Salvador Yemen, Rep. Côte d'Ivoire Seychelles
Palau Montenegro Grenada Eritrea Sierra Leone
Papua New Guinea
Romania Guatemala Ethiopia Somalia
Philippines Russia Guyana South Asia (SAS) Gabon South Africa Samoa Serbia Haiti Afghanistan Gambia, The Sudan Solomon Is. Tajikistan Honduras Bangladesh Ghana Swaziland Thailand Turkey Jamaica Bhutan Guinea Tanzania Timor-Leste Turkmenistan Mexico India Guinea-Bissau Togo Tuvalu Ukraine Nicaragua Maldives Kenya Uganda
Tonga Uzbekistan Panama Nepal Lesotho Zambia
Vanuatu Paraguay Pakistan Liberia Zimbabwe
Vietnam Peru Sri Lanka Madagascar Zimbabwe
St. Kitts & Nevis St. Lucia
St. Vincent & Grenadines Suriname
Table A-2 Construction of the F statistics
Test Statistic Null hypothesis
Test I (FI) Homogenous Non-Causality
= ( − )/
/[ − ( + )− ]
ODA does not granger-cause FDI for any of the panel members
Test II (FII) Homogenous Causality
= ( − )/[ ( − )]
/[ − ( + )− ]
ODA granger-causes FDI for all panel members Test III (FIII)
Heterogeneous
Non-Causality =
( , − )/
/[ − ( + ) + ]
ODA does not granger-cause FDI for specific panel members
Statistics based on Hood, Kidd, and Morris (2008)
RSS1: Sum of squared residuals from unrestricted model
RSS2: Sum of squared residuals with restriction that all slope terms are set to zero RSS3: Sum of squared residuals with restriction that all slope terms are set equal to each other
RSS2,i: Sum of squared residuals with restriction that slope terms for element i are equal to zero