R E S E A R C H
Open Access
Genome reorganization in different cancer
types: detection of cancer specific
breakpoint regions
Christoph Standfuß
1,2, Jonas Parczyk
1, Jerome Ruhnau
1and Andreas Klein
1*Abstract
Background:Tumorigenesis is a multi-step process which is accompanied by substantial changes in genome
organization. The development of these changes is not only a random process, but rather comprise specific DNA regions that are prone to the reorganization process.
Results:We have analyzed previously published SNP arrays from three different cancer types (pancreatic
adenocarcinoma, breast cancer and metastatic melanoma) and from non-malignant control samples. We calculated segmental copy number variations as well as breakpoint regions. Some of these regions were not randomly involved in genome reorganization since we detected fifteen of them in at least 20% of all tumor samples and one region on chromosome 9 where 43% of tumors have a breakpoint. Further, the top-15 breakpoint regions show an association to known fragile sites. The relevance of these common breakpoint regions was further confirmed by analyzing SNP arrays from 917 cancer cell lines.
Conclusion:Our analyses suggest that genome reorganization is common in tumorigenesis and that some
breakpoint regions can be found across all cancer types, while others exclusively occur in specific entities.
Keywords:Pancreatic ductal adenocarcinoma, Breast cancer, Melanoma, Copy number variation, Cancer genomics,
Breakpoint and genome reorganization
Background
Tumorigenesis is a stepwise process, which involves multiple genetic, epigenetic and genomic events to transform a normal cell into a tumor cell [1–6].Genomic changes like copy number variations (CNVs) or segmen-tal copy number variations (segCNVs) increase through-out tumorigenesis [7–9] and are caused by various mechanisms, like fork stalling during replication or non-allelic homologous recombination [10–12].
These changes can affect the chromatin structure and therefore the spatial localization of specific genes, the DNA sequence like single nucleotide mutations, amplifi-cations, deletions or translocations as well as changes of karyotypes like aneuploidies [1,13–16].
It is also speculated that DNA regions exist which are prone for reorganization. Pevzner and Tesler stated in their seminal work “that mammalian genomes are mo-saics of fragile regions with high propensity for rear-rangements and solid regions with low propensity for rearrangements [17].”
Their thesis stands in contrast to the established the-ory of the random breakage model. The latter is based on the following two assumptions: Chromosomal seg-ments are conserved among different species and chromosomal rearrangements are randomly distributed within the genome [18]. Indeed, it is well established that chromosomal segments exist in different species where orthologous genes are located in the same ar-rangement. On the other hand, it is now also established that specific DNA regions throughout the genome are prone to breakage and reorganization [17, 19–21]. Ruiz-Herrera et al stated that “certain chromosomal re-gions in the human genome have been repeatedly used in the evolutionary process. As a consequence, the
© The Author(s). 2019Open AccessThis article is distributed under the terms of the Creative Commons Attribution 4.0 International License (http://creativecommons.org/licenses/by/4.0/), which permits unrestricted use, distribution, and reproduction in any medium, provided you give appropriate credit to the original author(s) and the source, provide a link to the Creative Commons license, and indicate if changes were made. The Creative Commons Public Domain Dedication waiver (http://creativecommons.org/publicdomain/zero/1.0/) applies to the data made available in this article, unless otherwise stated.
* Correspondence:andreas.klein@charite.de
1Institute of Biochemistry, Charité–Universitätsmedizin Berlin, Corporate Member of Freie Universität Berlin, Humboldt-Universität zu Berlin, and Berlin Institute of Health, Charitéplatz 1, 10117 Berlin, Germany
genome is a composite of fragile regions prone to reorganization…” Well known regions exhibiting chromosomal instability are fragile sites, which were firstly described by Magenis et al 1970 [22, 23].“Fragile sites are specific loci that form gaps, constrictions, and breaks on chromosomes exposed to partial replication stress and are rearranged in tumors [24].” Fragile sites can be divided in rare and common fragile sites (CFSs). Rare fragile sites are only expressed in a few individuals. They are associated with the expansion of micro- or minisatellite repeats and inheritable diseases like fragile X syndrome. CFSs are regular parts of chromosomes and therefore found in all humans. CFSs are hotspots for metaphase chromosomal gaps and breaks and chromosomal rearrangements. CFS instability is an early step in tumorigenesis and could be responsible for gen-ome reorganization in cancer [23,25–29].
In 2012, Standfuß et al observed the stepwise increase in genome reorganization in a simian virus 40 (SVT/t) transformed mouse breast cancer model. The number of genomic changes increased from non-malignant, to hy-perplastic and to tumor samples of mammary glands. Moreover, distinct breakpoint regions, where genome reorganization events take place, could be detected. They argued that unique and common breakpoint re-gions exist in breast cancer. However, due to the small sample size, the final proof was missing [9].
In this study, we analyzed DNA SNP arrays from 20 healthy controls and 111 cancer samples as well as 917 cancer cell lines. We found unique and common break-point regions in different cancer entities and more strik-ingly, we found a breakpoint region which was common in more than one third of all tumors and cancer cell lines tested.
Thus, we addressed the questions, whether genome reorganization is a random process, and whether specific DNA regions are prone to this reorganization procedure.
Material and methods SNP array data
We reanalyzed 131 single-nucleotide polymorphism (SNP) microarrays, produced using the Genome-Wide Human SNP Array 6.0 platform ( https://tools.thermo-fisher.com/content/sfs/brochures/genomewide_snp6_ datasheet.pdf). The 111 tumor samples compromise 25 pancreatic adenocarcinomas (PDAC) from Donahue et al [30] [GSE32688], 22 PDAC derived cell lines from Barretina et al [31] [GSE36139], 16 metastatic melano-mas from Marzese et al [32] [GSE44019] and 48 breast cancer samples from [GSE26232]. The 20 non-malignant control experiments (NMCE) compromise 15 samples derived from B cells isolated from peripheral blood of healthy donors from Xie et al [33] [GSE49045] and 5 samples derived from peripheral blood cells of breast
cancer patients [GSE48377]. The 15 blood samples from healthy donors were further termed as “reference” and the five peripheral blood cells from breast cancer pa-tients were termed as“control”.
Further, we analyzed 917 cancer cell line samples from the Cancer Cell Line Encyclopedia (CCLE) [31] [GSE36139]. All samples are publicly available.
Copy-number variation
Raw SNP microarray data was processed using the Affy-metrix Power Tools 1.15.0 (now Oncomine™ Power Tools, Thermo Fisher Scientific) and the BRLMM-P al-gorithm to extract the normalized SNP signal intensities. To compare the total signal intensity distributions of all samples, intensities of both alleles for each SNP were added up. CNVs for each SNP was computed as log2-ratios of each tumor sample and the reference data-set comprising 15 blood samples from healthy donors. The reference for each SNP was calculated as the aver-age signal intensity of the 15 reference samples.
SegCNVs for each sample were computed with the DNAcopy package (1.36.0) of Bioconductor (2.13) [34] with the following parameters: alpha = 0.001, undo.splits =“sdundo”, undo.SD = 0.5, min.width = 4. The DNAcopy package implements the circular binary segmentation al-gorithm introduced by Olshen et al [35]. The number of segCNVs were counted for each experiment and set in relation to the number of base pairs for each chromo-some. We excluded Chromosome Y (860 SNPs) and MT (411 SNPs) from our analyses. The heat map was gener-ated using ggplot2 package of R. Hg19, provided by the University of California, Santa Cruz (UCSC), was used for human genome assembly.
Common breakpoints
The genome was divided into 30,951 bins of 100 kb size or less, if the bin represents a chromosomal end region. The occurrence of each breakpoint was counted in all 1048 analyzed samples to find regions of predisposed al-terations. To enhance stringency, a breakpoint between two segCNVs was defined as follows: 1) the log2-ratio difference between both segments has to be greater than 0.5. 2) at least one segment has to include a minimum of 10 and the other of 4 SNPs.
Odds ratio
To decide whether a breakpoint event (BP) is more fre-quent in cancer samples than in the NMCE, we calcu-lated the odds ratios.
oddsNMCE = (number of NMCE with BP)/(total num-ber of NMCE - numnum-ber of NMCE with BP).
oddsTumor = (number of tumors with BP)/(total num-ber of tumors - numnum-ber of tumors with BP).
Since some of the breakpoints were not found in the NMCE but had a high count in the tumor group odds ratio, calculations were not trivial. In accordance with the Cochrane Handbook for Systematic Reviews of In-terventions we added 0.5 in those cases:
oddsNMCE = (number of NMCE with BP + 0.5)/ (total number of NMCE + 0.5 - number of NMCE with BP + 0.5).
oddsTumor = (number of tumors with BP + 0.5)/(total number of tumors + 0.5 - number of tumors with B + 0.5).
oddsRatio = (oddsTumors)/(oddsNMCE)
Fragile sites
We used the chromosomal location of the 230 fragile sites published by Mrasek et al [36] and analyzed their occurrence within our breakpoint regions. Therefore, the cytogenetic location was translated into the chromo-somal location with the help of the “Ensemble Genome Browser version GRCh37.p13.”
Results
SNP CNVs in different tumor entities
To study the changes in genome reorganization during tumorigenesis, we analyzed previously published SNP ar-rays from 111 cancer samples: 25 pancreatic ductal adenocarcinoma, 22 PDAC derived cell lines, 16 meta-static melanoma and 48 breast cancer samples. As
NMCE, we used DNA from peripheral blood samples from healthy donors and from breast cancer patients.
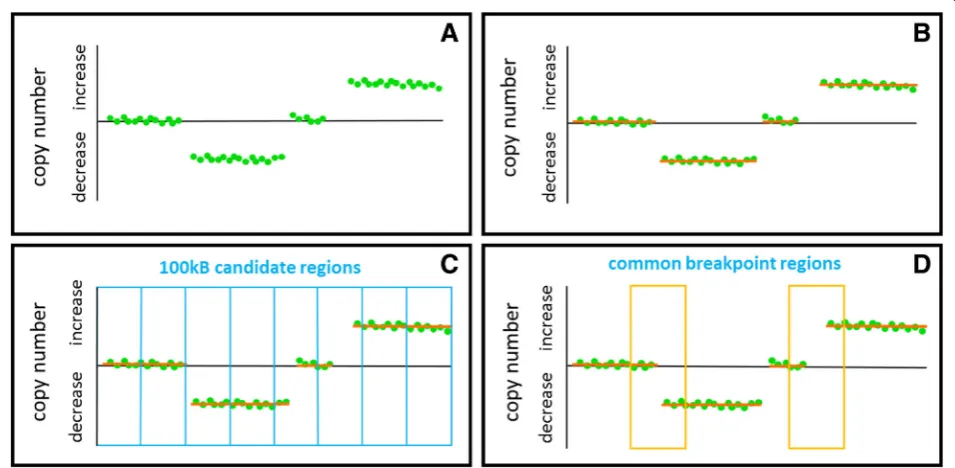
We added up the signal intensities for SNP alleles and further determined continuous SNP CNV regions for all chromosomes using the circular binary segmentation al-gorithm introduced by Olshen and colleagues [35]. In order to define DNA regions with a high probability of genomic reorganization and which were common in multiple cancer samples, we divided the genome into 30,951 bins of 100 kb size and defined a breakpoint re-gion as follows: at least two DNA segments have to dif-fer in their average copy number values of more than a log2-ratio of 0.5 and one segment has to consist of 10 SNPs instead of the minimum of four SNPs. Thus, breakpoint regions were defined as DNA sites where segmental copy number level shifts occur. If a break-point is present in multiple tumor samples, we call it common breakpoint region. This approach is illustrated in Fig.1.
In total, we found 19,687 regions (63.61%) where at least one experiment had a breakpoint. However, since most of the breakpoint regions were present in only one or two tumor samples, we focused on genomic regions in which at least 23 out of the 111 tumors (20%) had a breakpoint (Fig.2, Table1). The heat map shows the fif-teen 100 kb sized breakpoint regions, which appear in at least 20% of all tumor samples. We highlighted break-points more frequent in PDAC tumor samples with
Fig. 2To illustrate the presence (blue line) of common breakpoints within different tumor samples and tumor entities, we created a heat map. The chromosomal location is listed on the y-axis. Here, we present a heat map for all common breakpoints that appear in at least 20% of tumor samples. Breakpoints that were mainly common to PDAC tumor samples are marked by orange rectangles and green rectangles mark breakpoints common to breast cancer samples
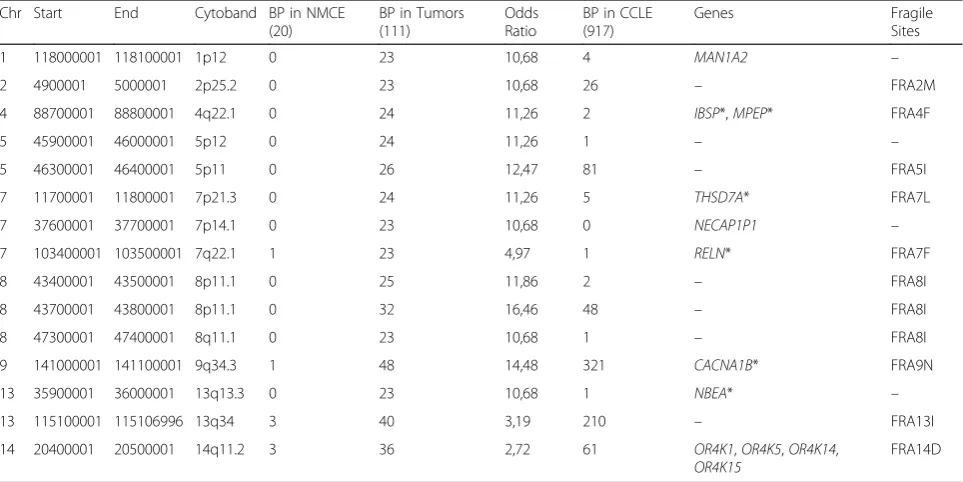
Table 1Chromosomal location, occurrence of breakpoint events (BP), odds ratio, located genes and association to fragile sites of the top-15 breakpoint regions. Genes that are associated with cancer in literature are marked with an asterisk
Chr Start End Cytoband BP in NMCE
(20)
BP in Tumors (111)
Odds Ratio
BP in CCLE (917)
Genes Fragile
Sites
1 118000001 118100001 1p12 0 23 10,68 4 MAN1A2 –
2 4900001 5000001 2p25.2 0 23 10,68 26 – FRA2M
4 88700001 88800001 4q22.1 0 24 11,26 2 IBSP*,MPEP* FRA4F
5 45900001 46000001 5p12 0 24 11,26 1 – –
5 46300001 46400001 5p11 0 26 12,47 81 – FRA5I
7 11700001 11800001 7p21.3 0 24 11,26 5 THSD7A* FRA7L
7 37600001 37700001 7p14.1 0 23 10,68 0 NECAP1P1 –
7 103400001 103500001 7q22.1 1 23 4,97 1 RELN* FRA7F
8 43400001 43500001 8p11.1 0 25 11,86 2 – FRA8I
8 43700001 43800001 8p11.1 0 32 16,46 48 – FRA8I
8 47300001 47400001 8q11.1 0 23 10,68 1 – FRA8I
9 141000001 141100001 9q34.3 1 48 14,48 321 CACNA1B* FRA9N
13 35900001 36000001 13q13.3 0 23 10,68 1 NBEA* –
13 115100001 115106996 13q34 3 40 3,19 210 – FRA13I
14 20400001 20500001 14q11.2 3 36 2,72 61 OR4K1,OR4K5,OR4K14,
orange boxes, and regions more frequent in breast can-cer samples with green boxes. This result indicates that some breakpoints are more frequent in only one tumor entity (like chromosomes 1, 2 and 13) whereas other re-gions are present in all tumor entities (like chromo-somes 9 and 13). The breakpoints on Chromochromo-somes 9 and 13 had 43 and 36% of all tumors in common. Since some breakpoints were also present in the NMCE, we verified the relevance of a breakpoint region by deter-mining the odds ratio for being tumor specific.
Table1 shows the odds ratio for the breakpoints illus-trated in Fig. 2. In all of the top-15 breakpoint regions, we observed that on average, an odds ratio > 10 indicates a high prevalence for these breakpoints to occur in tumor samples. The two highest odds ratio values were calculated for the breakpoint of chromosome 9 present in 48 different tumor samples and one NMCE (odds ra-tio = 14.5) and the breakpoint on chromosome 8 (43,700,001) present only in 32 different tumor samples (odds ratio = 16.5). Twelve genes were located in eight of the top-15 breakpoint regions, and six of these genes are associated with cancer (CACNA1B, IBSP, MEPE, NBEA, RELN and THSD7A) (Table1).
Cancer cell line encyclopedia (CCLE)
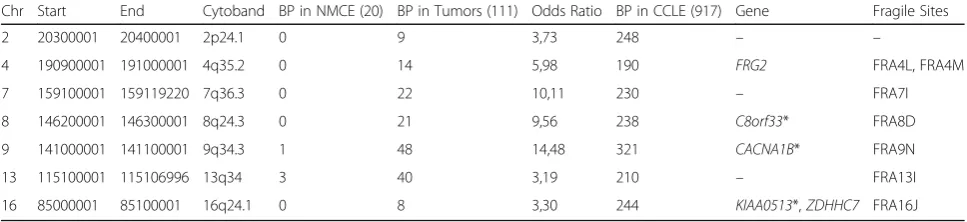
To further validate, the top-15 breakpoint regions, we in-cluded 917 cancer cell line samples in our analyses. We summarized in Table2the seven 100 kb sized breakpoint regions which appear in at least 20% of all CCLE samples The breakpoint regions on Chromosomes 9 (141,000,001) and 13 (115,100,001) which were present in all tumor en-tities, also had the most breakpoints in the analyzed can-cer cell lines. On Chromosome 9, 321 cancan-cer cell lines (34%) and on Chromosome 13, 210 (22%) cancer cell lines had a breakpoint within the aforementioned regions. Five genes were located in four of the seven breakpoint regions and three of these genes (CACNA1B, C8orf33 and KIAA0513) are associated with cancer (Table 2). Interest-ingly, only very few cancer cell lines (< 0.5%) had break-points in the seven breakpoint regions that were associated with PDAC: e.g. the region on chromosome 7
(37,600,001) had no breakpoint in cancer cell lines and the regions on chromosomes 5 (45,900,001), 7 (103,400,001), 8 (47,300,001) and 13 (35,900,001) had only one breakpoint in cancer cell lines (Table 1). The breast cancer associated breakpoint region on chromosome 2 is also only shared by 2.8% of cancer cell lines.
The presented results indicate that we created a set of common breakpoint regions with the help of PDAC, melanoma metastasis and breast cancer samples that were more highly associated with single cancer entities, whereas other breakpoint regions can be found in a var-iety of tumors.
Fragile site
Since fragile sites are well known regions exhibiting chromosome instability, we compared the chromosomal locations of the common breakpoint regions we found with data from chromosomal fragile sites [36]. Eleven thousand three hundred sixty out of the 19,687 break-point regions contained a fragile site (58%).
Since an odds ratio less than one indicates a higher likelihood of a breakpoint region to occur in NMCE, and an odds ratio above one indicates higher odds for occurring in tumor samples, we determined the percent-age of a fragile site to occur in relation to the odds ratio. Out of the 19,687 breakpoint regions, 13,063 had an odds ratio of less than one and 6624 above one. A region with an odds ratio < 1 occurred in 57% (7471 out of 13,063) associated with fragile sites and a region with an odds ratio > 1 occurred in 59% (3889 out of 6624) associ-ated with fragile sites. Thus, we could not determine a crucial difference in the association to fragile sites in the more tumor linked breakpoint regions.
However, 11 of the top-15 breakpoint regions (73%) were associated with fragile sites and 6 of the 7 CCLE related breakpoint region (86%), indicating a strong association of the top-ranked breakpoint regions to known fragile sites.
Targeted investigation
Further, we evaluated important regions known for genome reorganization from literature (e.g. loss-of
Table 2Chromosomal location, occurrence of breakpoint events (BP), odds ratio, located genes and association to fragile sites of the top-ranked CCLE breakpoint regions. Genes that are associated with cancer in literature are marked with an asterisk.
Interestingly, the breakpoint region in chromosome 2 is close to the cancer associatedSDC1gene by about 558 bases
Chr Start End Cytoband BP in NMCE (20) BP in Tumors (111) Odds Ratio BP in CCLE (917) Gene Fragile Sites
2 20300001 20400001 2p24.1 0 9 3,73 248 – –
4 190900001 191000001 4q35.2 0 14 5,98 190 FRG2 FRA4L, FRA4M
7 159100001 159119220 7q36.3 0 22 10,11 230 – FRA7I
8 146200001 146300001 8q24.3 0 21 9,56 238 C8orf33* FRA8D
9 141000001 141100001 9q34.3 1 48 14,48 321 CACNA1B* FRA9N
13 115100001 115106996 13q34 3 40 3,19 210 – FRA13I
heterozygosity or homozygous deletion) and looked for the relevance of those regions in our dataset concerning the occurrence of breakpoints. Fragile site FRA16D (16q23.2) is within a region of frequent loss-of-heterozygosity in breast and prostate cancers. Inter-estingly, we found 64 breakpoints in 13 tumor samples (11.7%) for this fragile site, whereof 61 were found in nine breast cancer samples (18.75% of all breast cancer samples). Another frequently altered chromosomal re-gion is located on chromosome 9 (21,900,001) where the tumor suppressor p16 (official symbol CDKN2A) is present. In the corresponding bins, 104 cancer cell lines had a breakpoint (11.34%) and eight tumor samples (7.2%). Interestingly, this region is part of the fragile site FRA9A. In this CFS 56 tumor samples (50.5%) had at least one breakpoint.
The most commonly known unstable CFS region is FRA3B [37]. In this CFS, spanning over 43 bins, 148 breakpoints were detected in 26 cancer samples (23.4%). It is also noteworthy that 23 out of the 26 cancer sam-ples had a breakpoint in the region of the gene FHIT lying inside of FRA3B. In line with this, 243 cancer cell lines have breakpoints in FRA3B and 223 of those have breakpoints in the 16 bins containingFHIT.
Discussion
In this study, we examined the theory that genome reorganization during tumorigenesis is not a random process but rather a directed process, involving defined DNA regions. Therefore, we have reanalyzed 1.048 DNA SNP arrays from different cancer entities and non-malignant samples. We found an increase of DNA breakpoint regions in tumor samples compared to NMCE. Interestingly, several breakpoint regions were common in several tumor specimen (up to 43%) where as other regions seemed to be more restricted to a spe-cific tumor entity. Surprisingly, breakpoint regions be-tween PDCA and PDCA derived cell lines differ considerably. On the one hand, Kalinina and colleagues established a pancreatic cancer cell line from a primary tumor. Kalinina and colleagues also observed a similar CNV pattern between tumor and cell line after passa-ging the cell line 15–20 times, as well as a considerable number of similar large chromosomal alterations [38]. On the other hand, Burdall and colleagues stated that “Cell lines are prone to genotypic and phenotypic drift during their continual culture. This is particularly com-mon in the more frequently used cell lines, especially those that have been deposited in cell banks for many years [39].” This might be applicable for the used cell lines in our approach, e.g. Capan 1 and 2 were estab-lished 1974 and 1975, respectively [40,41].
It is well known that cancers develop from stem lines in a stepwise process and are characterized by
chromosomal aberrations and chromosomal instability [42,43]. The Mitelman Database of Chromosome Aber-rations and Gene Fusions in Cancer currently lists 69,134 human cancers with individual clonal karyotypes [44]. In 2012, Standfuß et al found a stepwise increase in genome reorganization in a mouse breast cancer model. The number of genomic changes increased from non-malignant, to hyperplastic and to tumor samples of mammary glands [9]. Further, an analysis of 2.737 tumor samples from 8 different tumor entities (including breast cancers) showed that tumor entity-specific breakpoints could be found for all examined tumor entities. The breakpoint regions were equally distributed over all en-tities [45]. Further, colocalization assessment identified 20,077 CNV-affecting genes and 169 of these being known tumor-related genes. In another study, Berou-khim et al looked for somatic CNVs in 3.131 cancer spe-cimen and found 158 regions of focal somatic CNVs of which only 36 can be explained by the presence of known cancer target genes located within this region like FHITand p16 [8]. Meaburn and Misteli also identified several genes specifically repositioned during tumorigen-esis. The alterations of the spatial positioning were unre-lated to gene activity [15]. In our study, genes were located in eight of the top-15 and four of the top-7 CCLE breakpoint regions. Eight of these genes are linked to cancer, but none are well characterized oncogenes or tumor suppressor genes. Interestingly, only C8orf33and NBEA seemed to have tumor suppressor functions [46,
47]. The other six genes are associated with tumor pro-gression.IBSP,MEPE,RELNandTHSD7Aare associated with migration, invasion, infiltration and angiogenesis [48–51]; CACNA1B and KIAA0513 are associated with cell proliferation and apoptosis. CACNA1B overexpres-sion is associated with an unfavorable prognosis in non-small cellular lung cancer [52] and altered expres-sion of KIAA0513, due to an aberrant methylation pat-tern, correlated with non-survivors in Neuroblastoma [53].
chromosomal band 3p14.2 [37]. This chromosomal region is a hot-spot for deletions and other alterations in a variety of different cancers.FHIT,a large tumor suppressor gene spanning over approximately 35% of this fragile site, is also harbored in this region [57]. While 26 tumors and 243 cancer cell lines have a breakpoint in FR3B, the majority of these breakpoints, namely 23 and 223, lay in theFHIT gene. Thus, it is not surprising that estimates designate FHITas the most frequently altered gene in cancer [58]. Inside the CFS, FRA9A thep16gene is located. Cox and Colleagues found in their “survey of homozygous dele-tions in human cancer genomes” that p16 was the most frequent target of homozygous deletions (24.6%) [59]. Fur-ther, they argued that genetic rearrangement in this region might signify less negative selection compared to other re-gions becausep16is located adjacent to one of the largest gene-poor regions of the human genome. When looking at the direct adjacent bins of p16, it stands out that the area of and aroundp16is the area of FRA9A where most of the breakpoints occur. This indicates that those break-points occurring in this CFS might play a role for tumor development, instead of being a random side effect of gen-omic instability.
However, genome rearrangements are not restricted to cancer cells. Rather, they are also present in adaptive processes, such as response to selective pressures from the environment and are associated with various diseases [60–62].
Conclusion
In this study, we found that genome reorganization is more enhanced in tumor samples compared to the non-malignant controls and that some genome regions exist that are prone to rearrangements. We identified re-gions which may play an important role in the tumori-genesis of specific tumor entities and others that occur commonly during tumorigenesis.
For further investigations, genomic profiles could be linked to clinical data in order to produce additional prognostic markers for clinical outcome.
Abbreviations
BP:breakpoint event; CCLE: Cancer Cell Line Encyclopedia; CFS: common fragile site; CNV: copy number variation; NMCE: non-malignant control experiment; PDAC: pancreatic adenocarcinoma; segCNV: segmental copy number variation; SNP: single-nucleotide polymorphism
Acknowledgements
We gratefully acknowledge the support of Cara Reiter-Brennan for editing the English version and critical discussions of this manuscript. We acknow-ledge support from the German Research Foundation (DFG) and the Open Access Publication Fund of Charité–Universitätsmedizin Berlin.
Funding
N/A
Availability of data and materials
All analyzed samples are publicly available.
Authors’contributions
Conceptualization: CS and AK; Analyses and graphic design: CS, JP and JR; Project administration and supervision: AK; Writing and editing: CS, JP, JR and AK. All authors read and approved the manuscript.
Ethics approval and consent to participate
The authors have no ethical conflicts to disclose.
Consent for publication
Not applicable.
Competing interests
The authors declare that they have no competing interests.
Publisher’s Note
Springer Nature remains neutral with regard to jurisdictional claims in published maps and institutional affiliations.
Author details
1
Institute of Biochemistry, Charité–Universitätsmedizin Berlin, Corporate Member of Freie Universität Berlin, Humboldt-Universität zu Berlin, and Berlin Institute of Health, Charitéplatz 1, 10117 Berlin, Germany.2Institute of Biochemistry, Charité–Universitätsmedizin Berlin, corporate member of Freie Universität Berlin, Humboldt-Universität zu Berlin, and Berlin Institute of Health, MTU Aero Engines, 80995 Munic, Germany.
Received: 8 February 2019 Accepted: 15 May 2019
References
1. Vogelstein B, Kinzler KW. The multistep nature of cancer. Trends Genet. 1993;9:138–41.
2. Hanahan D, Weinberg RA. Hallmarks of cancer: the next generation. Cell. 2011;144:646–74.
3. Loeb LA, Loeb KR, Anderson JP. Multiple mutations and cancer. Proc Natl Acad Sci. 2003;100:776–81.
4. Osborne C. Oncogenes and tumor suppressor genes in breast Cancer: potential diagnostic and therapeutic applications. Oncologist. 2004;9:361–77. 5. Klein A, Guhl E, Zollinger R, et al. Gene expression profiling: cell cycle
deregulation and aneuploidy do not cause breast cancer formation in WAP-SVT/t transgenic animals. J Mol Med. 2005;83:362–76.
6. Foulds L. The experimental study of tumor progression: a review. Cancer Res. 1954;14:327–39.
7. Shlien A, Malkin D. Copy number variations and cancer. Genome Med. 2009;1:1–9. 8. Beroukhim R, Mermel CH, Porter D, et al. The landscape of somatic
copy-number alteration across human cancers. Nature. 2010;463:899–905. 9. Standfuß C, Pospisil H, Klein A. SNP microarray analyses reveal copy number
alterations and progressive genome reorganization during tumor development in SVT/t driven mice breast cancer. BMC Cancer. 2012;12:380. 10. Redon R, Ishikawa S, Fitch KR, et al. Global variation in copy number in the
human genome. Nature. 2006;444:444–54.
11. Malhotra D, Sebat J. CNVs: harbingers of a rare variant revolution in psychiatric genetics. Cell. 2012;148:1223–41.
12. Zhang F, Khajavi M, Connolly AM, et al. The DNA replication FoSTeS/MMBIR mechanism can generate genomic, genic and exonic complex
rearrangements in humans. Nat Genet. 2009;41:849–53. 13. Sen S. Aneuploidy and cancer. Curr Opin Oncol. 2000;12:82–8.
14. Mitelman F, Johansson B, Mertens F. The impact of translocations and gene fusions on cancer causation. Nat Rev Cancer. 2007;7:233–45.
15. Meaburn KJ, Misteli T. Locus-specific and activity-independent gene repositioning during early tumorigenesis. J Cell Biol. 2008;180:39–50. 16. Klein A, Li N, Nicholson JM, et al. Transgenic oncogenes induce
oncogene-independent cancers with individual karyotypes and phenotypes. Cancer Genet Cytogenet. 2010;200:79–99.
17. Pevzner P, Tesler G. Human and mouse genomic sequences reveal extensive breakpoint reuse in mammalian evolution. Proc Natl Acad Sci. 2003;100:7672–7.
18. Nadeau JH, Taylor BA. Lengths of chromosomal segments conserved since divergence of man and mouse. Proc Natl Acad Sci. 1984;81:814–8. 19. Zhao S, Shetty J, Hou L, et al. Human, mouse, and rat genome large-scale
20. Murphy WJ, Larkin DM, Everts-Van Der Wind A, et al. Evolution: Dynamics of mammalian chromosome evolution inferred from multispecies comparative maps. Science (80- ) 2005; 309: 613–617.
21. Ruiz-Herrera A, Castresana J, Robinson TJ. Is mammalian chromosomal evolution driven by regions of genome fragility? Genome Biol. 2006;7:R115. 22. Magenis RE, Hecht F, Lovrien EW. Heritable fragile site on chromosome 16: probable localization of haptoglobin locus in man. Science. 1970;170:85–7. 23. Durkin SG, Glover TW. Chromosome fragile sites. Annu Rev Genet. 2007;41:
169–92.
24. Zlotorynski E, Rahat A, Skaug J, et al. Molecular basis for expression of common and rare fragile sites. Mol Cell Biol. 2003;23:7143–51.
25. Hecht F, Sutherland GR. Fragile sites and cancer breakpoints. Cancer Genet Cytogenet. 1984;12:179–81.
26. Yunis JJ, Soreng AL. Constitutive fragile sites and cancer. Science. 1984;226: 1199–204.
27. Bartkova J, Hořejší Z, Koed K, et al. DNA damage response as a candidate anti-cancer barrier in early human tumorigenesis. Nature. 2005;434:864–70. 28. Tsantoulis PK, Kotsinas A, Sfikakis PP, et al. Oncogene-induced replication
stress preferentially targets common fragile sites in preneoplastic lesions. A genome-wide study. Oncogene. 2008;27:3256–64.
29. Debatisse M, Le Tallec B, Letessier A, et al. Common fragile sites: mechanisms of instability revisited. Trends Genet. 2012;28:22–32. 30. Donahue TR, Tran LM, Hill R, et al. Integrative survival-based molecular
profiling of human pancreatic Cancer. Clin Cancer Res. 2012;18:1352–63. 31. Barretina J, Caponigro G, Stransky N, et al. The Cancer cell line encyclopedia
enables predictive modelling of anticancer drug sensitivity. Nature. 2012; 483:603–307.
32. Marzese DM, Scolyer RA, Huynh JL, et al. Epigenome-wide DNA methylation landscape of melanoma progression to brain metastasis reveals aberrations on homeobox D cluster associated with prognosis. Hum Mol Genet. 2013;23:226–38. 33. Xie Z, Nagarajan V, Sturdevant DE, et al. Genome-wide SNP analysis of the
Systemic Capillary Leak Syndrome (Clarkson disease).Rare Dis (Austin, Tex); 1. Epub ahead of print 2013. DOI:https://doi.org/10.4161/rdis.27445. 34. Gentleman RC, Carey VJ, Bates DM, et al. Bioconductor: open software
development for computational biology and bioinformatics. Genome Biol. 2004;5:R80.
35. Olshen AB, Venkatraman ES, Lucito R, et al. Circular binary segmentation for the analysis of array-based DNA copy number data. Biostatistics. 2004;5:557–72. 36. Mrasek K, Schoder C, Teichmann A-C, et al. Global screening and extended
nomenclature for 230 aphidicolin-inducible fragile sites, including 61 yet unreported ones. Int J Oncol. 2010;36:929–40.
37. Smeets DF, Scheres JM, Hustinx TW. The most common fragile site in man is 3p14. Hum Genet. 1986;72:215–20.
38. Kalinina T, Güngör C, Thieltges S, et al. Establishment and characterization of a new human pancreatic adenocarcinoma cell line with high metastatic potential to the lung.BMC Cancer; 10. Epub ahead of print 2010. DOI: https://doi.org/10.1186/1471-2407-10-295.
39. Burdall SE, Hanby AM, Lansdown MRJ, et al. Breast cancer cell lines: friend or foe? Breast Cancer Res. 2003;5:89–95.
40. Kyriazis AP, Kyriazis AA, Scarpelli DG, Fogh J, Rao MSLR. Human pancreatic adenocarcinoma line Capan-1 in tissue culture and the nude mouse: morphologic, biologic, and biochemical characteristics. Am Assoc Pathol. 1982;106:250–60.
41. Kyriazis AA, Kyriazis AP, Sternberg CN, Sloane NHLJ. Morphological, biological, biochemical, and karyotypic characteristics of human pancreatic ductal adenocarcinoma Capan-2 in tissue culture and the nude mouse. Cancer Res. 1986:5810–5.
42. Thompson SL, Compton DA. Chromosomes and cancer cells. Chromosom Res. 2011;19:433–44.
43. Vargas-Rondón N, Villegas VE, Rondón-Lagos M. The role of chromosomal instability in cancer and therapeutic responses. Cancers (Basel). 2018;10:1–21. 44. https://cgap.nci.nih.gov/Chromosomes/Mitelman. Accessed 5 MAY 2019. 45. Marczok S, Bortz B, Wang C, et al. Comprehensive analysis of genome
rearrangements in eight human malignant tumor tissues. PLoS One. 2016; 11:e0158995.
46. Shao P, Sun D, Wang L, et al. Deep sequencing and comprehensive expression analysis identifies several molecules potentially related to human poorly differentiated hepatocellular carcinoma. FEBS Open Bio. 2017;7:1696–706. 47. O’Neal J, Gao F, Hassan A, et al. Neurobeachin (NBEA) is a target of
recurrent interstitial deletions at 13q13 in patients with MGUS and multiple myeloma. Exp Hematol. 2009;37:234–44.
48. Xu T, Qin R, Zhou J, et al. High Bone Sialoprotein (BSP) Expression Correlates with Increased Tumor Grade and Predicts a Poorer Prognosis of High-Grade Glioma Patients. PLoS One; 7. Epub ahead of print 2012. DOI:https://doi. org/10.1371/journal.pone.0048415.
49. Gao Z, Zhao Y, Geng Q, et al. Regulatory roles of miRNA-758 and matrix extracellular phosphoglycoprotein in cervical cancer. Exp Ther Med. 2017;14: 2789–94.
50. Dou A, Wang Z, Zhang N, et al. Loss of reelin suppresses cell survival and mobility in non-Hodgkin lymphoma. Oncol Rep. 2017;37:3572–80. 51. Wiech T, Hoxha E, Schröder C, et al. THSD7A expression in human cancer.
Genes Chromosom Cancer. 2016;56:314–27.
52. Zhou X, Wang W, Zhang S, et al. CACNA1B (cav2.2) overexpression and its
association with Clinicopathologic characteristics and unfavorable prognosis in non-small cell lung Cancer. Dis Markers. 2017;2017:1–8.
53. Olsson M, Beck S, Kogner P, et al. Genome-wide methylation profiling identifies novel methylated genes in neuroblastoma tumors. Epigenetics. 2016;11:74–84.
54. Glover TW, Berger C, Coyle J, et al. DNA polymeraseαinhibition by aphidicolin induces gaps and breaks at common fragile sites in human chromosomes. Hum Genet. 1984;67:136–42.
55. Glover TW, Wilson TE, Arlt MF. Fragile sites in cancer: more than meets the eye. Nat Rev Cancer. 2017;17:489–501.
56. Finnis M, Dayan S, Hobson L, et al. Common chromosomal fragile site FRA16D mutation in cancer cells. Hum Mol Genet. 2005;14:1341–9. 57. Smith DI, Zhu Y, McAvoy S, et al. Common fragile sites, extremely large
genes, neural development and cancer. Cancer Lett. 2006;232:48–57. 58. Saldivar JC, Bene J, Hosseini SA, et al. Characterization of the role of Fhit in
suppression of DNA damage. Adv Biol Regul. 2013;53:77–85.
59. Cox C, Bignell G, Greenman C, et al. A survey of homozygous deletions in human cancer genomes. Proc Natl Acad Sci. 2005;102:4542–7.
60. Dunham MJ, Badrane H, Ferea T, et al. Characteristic genome rearrangements in experimental evolution of Saccharomyces cerevisiae. Proc Natl Acad Sci. 2002;99:16144–9.
61. Tang Y-C, Amon A. Gene copy-number alterations: a cost-benefit analysis. Cell. 2013;152:394–405.