P R I M A R Y R E S E A R C H
Open Access
Development of a cost-effective high-throughput
process of microsatellite analysis involving
miniaturized multiplexed PCR amplification and
automated allele identification
Truc TM Nguyen
1,2, Shaheen E Lakhan
3,4*and Barry A Finette
1Abstract
Background:Microsatellites are nucleotide sequences of tandem repeats occurring throughout the genome, which have been widely used in genetic linkage analysis, studies of loss of heterozygosity, determination of lineage and clonality, and the measurement of genome instability or the emergence of drug resistance reflective of mismatch repair deficiency. Such analyses may involve the parallel evaluation of many microsatellite loci, which are often limited by sample DNA, are labor intensive, and require large data processing.
Results:To overcome these challenges, we developed a cost-effective high-throughput approach of microsatellite analysis, in which the amplifications of microsatellites are performed in miniaturized, multiplexed polymerase chain reaction (PCR) adaptable to 96 or 384 well plates, and accurate automated allele identification has been optimized with a collective reference dataset of 5,508 alleles using the GeneMapper software.
Conclusions:In this investigation, we have documented our experience with the optimization of multiplex PCR conditions and automated allele identification, and have generated a unique body of data that provide a starting point for a cost-effective, high-throughput process of microsatellite analysis using the studied markers.
Keywords:Microsatellite instability, Loss of heterozygosity, Multiplexed PCR
Background
Microsatellites are nucleotide sequences of tandem re-peat units ranging from 1 to 6 nucleotides that occur throughout the genome. Their polymorphisms, primarily exhibited as variations in length from the expansion or contraction of repeat units, reflect the tendency of DNA polymerase to slip during replication of repeat tracts. Al-though polymorphic through evolution, microsatellites are generally stably inherited between closely related in-dividuals [1]. These attributes have led to their wide use in genetic linkage analysis, studies of loss of heterozy-gosity (LOH) in cancer, and in the determination of lineage and clonality [2].
On the other hand, microsatellite instability (MSI) in tumors, first observed in a proportion of sporadic colon cancers [3,4] and most colon cancers of hereditary nonpolyposis colorectal cancer (HNPCC) families [5], may indicate genetic instability as a result of mismatch repair (MMR) deficiency [6,7]. The MMR system cor-rects post-replication base-base mismatches and inser-tion/deletion loops, and has also been implicated in the cytotoxicity of some DNA-damaging agents [8,9]. Mis-match repair deficiency has been observed to exhibit a high mutation rate [10] and confer tolerance to methy-lating agents [11,12], cisplatin [13,14], and 6-thioguanine or 6-mercaptopurine [14,15]. Since the findings of MSI in colon cancer, the measurement of microsatellite in-stability has been extended to other solid tumors [16] and hematological malignancies [17-19], as an indication of the potential contribution of mismatch repair * Correspondence:[email protected]
3
Neurological Institute, Cleveland Clinic, 9500 Euclid Ave, Cleveland, OH S100A, USA
4
Biosciences Department, Global Neuroscience Initiative Foundation, Beverly Hills, CA 91412, USA
Full list of author information is available at the end of the article
deficiency in tumor development, transformation [20-22], and drug resistance.
Depending on the type of analysis, microsatellite markers are selected based on their chromosomal loca-tions and frequency of heterozygosity. In genetic linkage analysis, studies of LOH and the determination of lineage, polymorphic markers are utilized to distinguish and follow alleles on homologous chromosomes, while sensitive and specific measurements of microsatellite in-stability reflective of mismatch repair deficiency in iso-lated colon cancer samples are better achieved with quasimonomorphic mononucleotide markers, including Bat25, Bat26, NR22, and NR24 [23,24].
In some cases, these studies may involve the parallel evaluation of many microsatellite loci that are often lim-ited by sample DNA, can be labor-intensive depending on the number of loci and samples being examined, and require the processing of numerous data. To address these limitations, we demonstrate a cost effective, high-throughput, and reproducible process of microsatellite analysis from polymerase chain reaction (PCR) amplifi-cation to automated data processing using model studies of microsatellite instability and lineage determination. Performed in miniaturized and multiplexed PCR format, our assay evaluates 11 microsatellite loci consisting of the NCI-recommended panel [25,26] of mononucleotide markers, Bat25 and Bat26, and dinucleotide markers (D2S123, D5S2346, and D17S250), and 6 additional
di-nucleotide markers (D3S1262, D3S3623, D6S262,
D7S481, D9S171, and D18S61), that altogether samples 9 chromosomes. We have designed the assay to also simultaneously evaluate for LOH of mismatch repair components commonly associated with HNPCC by in-cluding polymorphic markers, with the exception of Bat26, that are in close proximity to MLH1 (D3S3623),
MSH2 (Bat26), MSH6 (D2S123), and PMS2 (D7S481)
gene regions. For other applications, markers may be re-placed or added to the existing assay format with some optimization. Following the separation of amplified products by capillary electrophoresis, accurate auto-mated allele identification is performed with optimized peak detection algorithm and sizing method using the GeneMapper software.
Results
A quality high-throughput process of microsatellite ana-lysis requires specific high-throughput PCR amplifica-tion of microsatellite regions and automated specific peak detection, and precise sizing of amplified frag-ments. In the following, we present optimized conditions for the amplification of 11 microsatellite loci in two min-iaturized, multiplexed PCR reactions. We also present the optimization of analysis methods and marker param-eters of the GeneMapper software to detect specific
peaks of amplified products from background signals and precisely size microsatellite fragments in order to achieve reproducible automated allele identification.
Performance of multiplex PCR
In silico design and optimization to minimize hairpin
and primer-dimer formation as well as
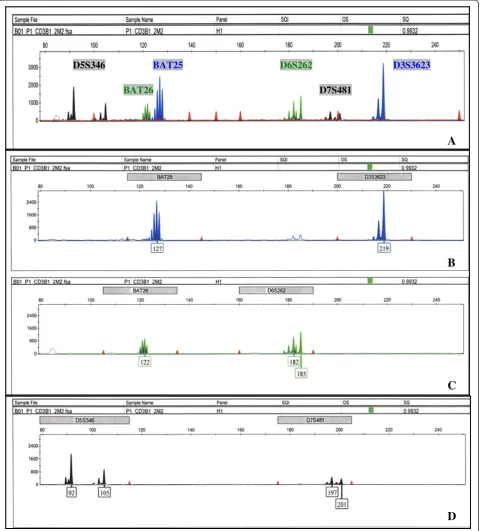
cross-dimerization among possible primer combinations were performed prior toin vitrotesting. Predicted compatible primer sets were tested and evaluated for optimal assay performance of low background signals, high fluores-cence of specific PCR products that fall within the de-tectable dynamic range, and signal and size resolution among amplified products. We found that multiplexing Bat25, Bat26, D3S3623, D5S346, D6S262, and D7S481 into one PCR reaction (group I) and D2S123, D3S1262, D9S171, D17S250, and D18S61 into another (group II) met these criteria. The compatibility of primer sets in our experimental conditions is overall consistent within silico predictions. Figure 1 shows the electropherograms of group I markers amplified with human T-cell lysates
in a 10 μL PCR reaction. Figure 1A displays the
D5S346 BAT25
BAT26
D3S3623
D7S481 D6S262
D
C
B
A
Figure 1Electropherograms of group I markers.Thex-axis represents DNA fragment size in base pairs, and they-axis represents fluorescence units. (A) Complete spectrum of group I markers labeled with specific fluorescent tags. D5S346 and D7S481 labeled with Ned, Bat26 and D6S262 labeled with Hex, and Bat25 and D3S3623 labeled with Fam. Similarly labeled fragments are distally spaced in size by assay design to
D18S61 D2S123 D3S1262
D9S171 D17S250
D
C
B
A
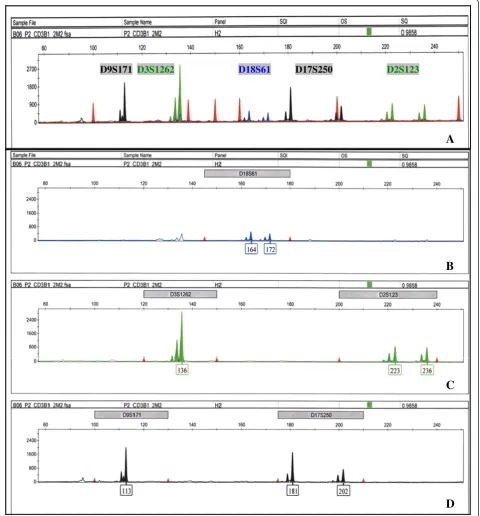
shows the electropherograms of group II markers also amplified with cell lysates in a 10 μL PCR reaction. The complete spectrum of group II markers is shown in Figure 2A, consisting of D18S61 labeled with Fam, D2S123, and D3S1262 labeled with Hex, and D9S171 and D17S250 labeled with Ned; the amplified products of indi-vidual dye are analyzed in Figure 2B (Fam), C (Hex), and D (Ned). Similar to group I, fragments labeled with the same fluorescent tags are distally spaced apart, and back-ground signals from nonspecific priming in multiplex PCR are minimized within the relevant marker size ranges. The spectral overlap of Hex into Fam is again ob-served in Figure 2B as microsatellite fragments with the same stutter patterns and size as D3S1262 and D2S123. Since these background peaks are present outside the size range of D18S61, they will not interfere with the genotyp-ing of D18S61. The nonspecific peak outside of the lower limit of D9S171 size range in Figure 2D can also be ex-cluded from identification with specified marker and ana-lysis parameters. Overall, PCR conditions for groups I and II markers produce data with clear resolution of specific signals and sizes of similarly labeled amplified fragments, which are suitable for high-throughput microsatellite analysis.
Specific peak detection and precise sizing
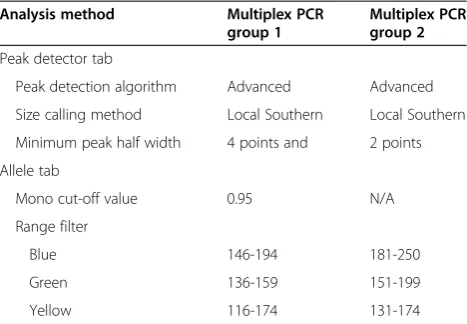
Automated data processing was performed with the GeneMapper software. A reference dataset of 5508 al-leles from 27 subjects and 1 cancer cell line (Additional file 1) was used to optimize parameters for specific peak detection, precise fragment sizing, and accurate allele identification of amplified microsatellites, which mi-nimize the recognition of nonspecific artifacts of PCR amplifications and dye bleed through. Several peak de-tection algorithms and sizing methods were tested. Su-perior genotyping quality was observed using the advanced peak detection algorithm in combination with the Local Southern sizing method (parameters listed in Table 1), which determines the best-fit line fragment size for an unknown fragment from the four nearest sizing standards based on the reciprocal relationship between fragment length and mobility ([27] Applied Biosystems, Part Number 4366831 Rev. A 2005). We also tested dif-ferent sizing methods, including the third-order least squares and Global Southern methods, and did not ob-serve comparable precision as the Local Southern method. This is consistent with what Ghosh and col-leagues had observed with fragment sizing [28]. We fur-ther improved specific peak detection by increasing the minimum peak half width to 4 points for group I markers to minimize the recognition of nonspecific spikes observed in some samples.
Along with peak detection and fragment sizing, pa-rameters were also optimized for accurate allele calling
of amplified microsatellites with unique nucleotide re-peats. Specific allele identification was promoted by spe-cifying the size range for each marker (Table 2), using previously determined values of a population sampling from the GDB human genome database that have been adjusted for primer locations and product size in our assay conditions (Table 3), and also those determined from 27 additional subjects and 1 cell line in our studies (Additional file 1). Nonspecific peaks outside the defined size range for each marker that may interfere with allele identification of similarly labeled marker, including bleed through of Hex into Fam, were additionally filtered out by specified range filters in the analysis method parame-ters (Table 1). Allele identification of quasimonomorphic microsatellites with mononucleotide repeats, including Bat25 and Bat26, was optimized to recognize the highest peak among stutter peaks as allele 1, and peaks that have heights >95% of the maximum peak height or height of allele 1 by setting the mono cut-off value at 0.95 as add-itional alleles (Table 1). This setting reproducibly identi-fied at most two alleles for Bat25 and Bat26 per PCR amplification of a sample without microsatellite instabil-ity in our dataset.
The reference dataset was also utilized to define bins for each marker, which are rounded off to specified inte-ger values that represent different categories of fragment sizes of amplified products for a particular microsatellite, to enable automatic allele identification of detected peaks that fall within the bin settings. The maximum offset of each bin was set at +/−0.5 base pair to allow up to one nucleotide range of experimental variations for each fragment size. Day-to-day inter-experimental and across time variations related to reagent preparations, PCR am-plifications, and electrophoretic mobility differences be-tween experiments resulting in large bin ranges ≥ 1 bp have been observed by others [28]. Some of these varia-tions can be adjusted by applying a correction factor based
Table 1 Analysis method parameters
Analysis method Multiplex PCR group 1
Multiplex PCR group 2
Peak detector tab
Peak detection algorithm Advanced Advanced
Size calling method Local Southern Local Southern
Minimum peak half width 4 points and 2 points
Allele tab
Mono cut-off value 0.95 N/A
Range filter
Blue 146-194 181-250
Green 136-159 151-199
Yellow 116-174 131-174
on differences in performance of control samples included on every run [28], which have been shown to reduce bin ranges (to≤ 0.8 bp) and increase interbin distances that would improve identification of alleles differing in size by 1 bp. We did not perform this correction prior to binning our initial data set to examine the total variation of our experiments, and our initial dataset also did not require 1 bp resolution.
Quality of high-throughput microsatellite analysis
We next assessed the performance of the entire high-throughput process from PCR amplification to auto-mated data analyses for potential sources of variations and process accuracy and reproducibility over the course of 5 months. Subsets of the reference dataset including studies of microsatellite instability among peripheral T cell clones from different subjects and lineage
determin-ation of an unknown family, which have been
automatically analyzed with optimized parameters and bin settings, were utilized in these assessments since the observed outcome from those studies provided the ap-propriate controls for comparison.
In those studies, PCR amplifications were performed in 10 μL reactions with either purified DNA or cell ly-sates prepared from peripheral T cell clones isolated from human subjects, which expressed varying growth rates and were cultured at different times. The inclusion of different conditions captured the potential variation associated with sample preparation, including the contri-bution of background matrix from tissue culture and DNA isolation. Along with every analysis of unknown samples, we included the amplification of a known con-trol sample to distinguish process reproducibility from sample integrity as the source of variation. Not included in our comparisons were PCR amplifications of samples that resulted in no signals or very low signals that do
Table 2 Marker parameters
Multiplex PCR reaction Markers Minimal size Maximum size Marker repeat
1 BAT25 115 145 1
1 BAT26 105 135 1
1 D3S3623 200 230 2
1 D5S346 70 115 2
1 D6S262 160 190 2
1 D7S481 175 205 2
2 D2S123 200 240 2
2 D3S1262 120 150 2
2 D9S171 100 130 2
2 D17S250 175 210 2
2 D18S61 145 180 2
Defined size ranges of markers, which include the GDB human genome database population distribution and additional allele sizes observed in our studies for optimal automatic allele identification.
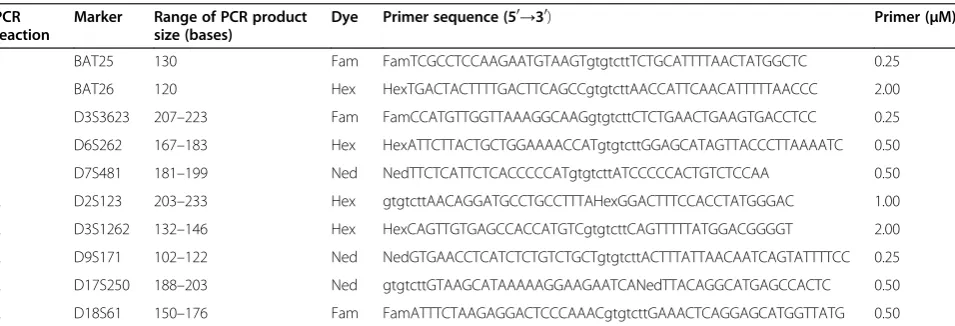
Table 3 Microsatellite markers size ranges and primer design and concentrations in multiplex PCR reactions
PCR reaction
Marker Range of PCR product size (bases)
Dye Primer sequence (50→30) Primer (μM)
1 BAT25 130 Fam FamTCGCCTCCAAGAATGTAAGTgtgtcttTCTGCATTTTAACTATGGCTC 0.25
1 BAT26 120 Hex HexTGACTACTTTTGACTTCAGCCgtgtcttAACCATTCAACATTTTTAACCC 2.00
1 D3S3623 207–223 Fam FamCCATGTTGGTTAAAGGCAAGgtgtcttCTCTGAACTGAAGTGACCTCC 0.25
1 D6S262 167–183 Hex HexATTCTTACTGCTGGAAAACCATgtgtcttGGAGCATAGTTACCCTTAAAATC 0.50
1 D7S481 181–199 Ned NedTTCTCATTCTCACCCCCATgtgtcttATCCCCCACTGTCTCCAA 0.50
2 D2S123 203–233 Hex gtgtcttAACAGGATGCCTGCCTTTAHexGGACTTTCCACCTATGGGAC 1.00
2 D3S1262 132–146 Hex HexCAGTTGTGAGCCACCATGTCgtgtcttCAGTTTTTATGGACGGGGT 2.00
2 D9S171 102–122 Ned NedGTGAACCTCATCTCTGTCTGCTgtgtcttACTTTATTAACAATCAGTATTTTCC 0.25
2 D17S250 188–203 Ned gtgtcttGTAAGCATAAAAAGGAAGAATCANedTTACAGGCATGAGCCACTC 0.50
2 D18S61 150–176 Fam FamATTTCTAAGAGGACTCCCAAACgtgtcttGAAACTCAGGAGCATGGTTATG 0.50
not display distinguishable marker peaks when our con-trols were performing. These may be the result of inter-ferences from sample matrix and/or low DNA content since the use of higher sample volumes resulted in the successful amplifications of some samples.
The reproducibility of each day’s processing as well as over the course of 5 months was assessed by examining the performance of the control samples. Additional files 2 and 3 provide the sizing values for identified alleles of group I and II markers, which have been amplified with cell lysates in 23 and 18 different runs, respectively, and analyzed with optimized parameters using the GeneMapper software. The sizing values of alleles for control samples, which reflect processing from PCR am-plifications of microsatellite regions, fragment separation by capillary electrophoresis, and specific peak detection to sizing of fragments were very reproducible over the course of 5 months showing cumulative %CV ranging from 0.05% to 0.12% among identified alleles. In addition, automatic allele identification with indicated bins was accurate in 360 out 364 alleles analyzed for markers with dinucleotide repeat units. Although peak detection and sizing may be accurate, problems with automatic allele calling of markers with dinucleotide re-peats occur in cases where signals from nonspecific products generated during PCR amplifications have surpassed pre-set threshold values. This was observed on two occasions for D5S346 as highlighted in blue (Additional file 2).
We observed the most ambiguity with allele calling of mononucleotide markers, Bat25 and Bat26 (also shown in Additional file 4). The algorithm for automatic allele identification of markers with mononucleotide repeats was optimized to reproducibly call peaks as alleles by recognizing the tallest peak as allele 1 and peaks that meet the preset cut-off value of 95% of the maximum peak height or allele 1 among stutter peaks as additional alleles. By this algorithm, Bat25 alleles were identified as homozygous for 127 bp in 18 of 23 runs of a pooled control sample and as heterozygous for 127 and 128 nu-cleotides in 5 runs. Bat26 was identified as 122 bp in all 23 runs. The variations in allele calling of mononucleo-tide markers reflect the variability in biochemistry of amplifying regions of mononucleotide repeats due to DNA polymerase slippage, and relative consistency ap-pears to depend on pre-set criteria of tolerance for varia-tions. When these markers were analyzed manually, the variability is similar or may be subject to more inter-observer variation in the estimation of differences in peak heights when compared to automated allele identi-fication. As these variations likely reflect the tendency of slippage of DNA polymerase during the amplification of mononucleotide repeats rather than process variability, we accepted a deviation of +1 nucleotide as normal for
these markers. This tolerance does not negate the use-fulness of these markers and/or our methodology. Other groups considered variations of ≥3 bp for Bat25 and≥4 bp for Bat26 as true polymorphisms or somatic alter-ations of these markers [23].
Process accuracy and reproducibility were further ex-amined in an analysis of 4,440 identified alleles of groups I and II markers from the amplifications of 240 and 156 T cell clones from 13 and 10 subjects, respectively, in a microsatellite instability study. This dataset is unique in that different clones with unique T cell receptor for anti-gen recognition from the same subjects exhibited identi-cal patterns of microsatellite profiles or microsatellite stability, providing the appropriate internal controls for measuring process deviations. Additional files 4 and 5 provide summaries of identified alleles for groups I and II markers, respectively, organized in chronological order by dates of processing, subjects and respective number of clones analyzed, and the percent deviation from expected values. Percent deviation from expected values connotes the percent of alleles that were miscalled, indi-cated by asterisk. All discordant samples were manually analyzed to confirm that deviations were unrelated to microsatellite instability. Misidentifications can represent failure in any part of the process from sample prepar-ation, PCR amplificprepar-ation, fragment separprepar-ation, peak de-tection, fragment sizing to automated allele calling. The analysis of 1,920 alleles of dinucleotide markers in group I (Additional file 4) showed percent deviations from expected values ranging from 0.0% to 4.69% for day to day processing and of 0.63% for all days. When discord-ant samples were analyzed manually, most deviations from expected allele calls were related to the presence of higher nonspecific signals or unequal amplifications of alleles. On the day showing the highest percent devi-ation, three independent amplifications of control sam-ples were performed optimally, indicating that the deviations were likely related to sample integrity. There was no trend of higher deviations among any of the markers. As previously mentioned, mononucleotide markers Bat25 and Bat26 are more difficult to call whether performed manually or automatically even though their fragment sizing is very precise (Additional file 2). We accepted a deviation of +1 nucleotide as nor-mal and did not calculate a percent deviation for these markers since all alleles were automatically called within this range.
On the day showing the highest percent deviation, our control sample performed optimally, suggesting that sample integrity is the cause of poor PCR amplifications. There was also no apparent trend of higher deviations among any of the markers in group II.
Thus far, we have demonstrated the accuracy and re-producibility of our high throughput process with con-trol samples and clones from the same subjects in which deviations from expected patterns of microsatellites were analyzed. The accuracy of our methods was also exam-ined in a lineage determination study of a family of four members unknown to us. Figure 3 shows the microsatel-lite profiles of group I markers in four panels that we have determined as child 1, parent 1, parent 2, and child 2 based on the patterns of segregation of microsatellite alleles. Alleles inherited from each parent have been ap-propriately color coded in each child’s microsatellite pro-files. As previously discussed with the exception of the ambiguity in identification of Bat25 and Bat26, all alleles of dinucleotide markers were accurately automatically identified in Child 1 and Child 2 and can be traced back to Parent 1 and Parent 2. Furthermore, the microsatellite profiles of Child 1 and Child 2 were identical, suggesting that the children are monozygotic twins. The parents later confirmed these determinations.
Discussion
We have developed a reproducible high-throughput process of microsatellite analysis in which the amplifica-tions of microsatellite regions are performed in minia-turized, multiplexed PCR format; automated allele identification has been optimized to overcome many challenges encountered in genetic studies of linkage ana-lysis, LOH, lineage determination, or microsatellite in-stability. Our microsatellite assay minimizes sample requirement using approximately 2–4 ng of DNA in PCR amplifications of 11 microsatellite loci in two 10μL reactions that can be adapted to a 96- or 384-well high-throughput assay format. Our optimized conditions pro-duced clear resolution of specific signals and sizes of amplified microsatellites, allowing for reproducible peak detection and fragment sizing. The current assay is amenable to the incorporation of more markers to in-crease throughput without compromising size resolution of additional amplified products.
Using the Advanced Peak Detection Algorithm with specific optimized parameters in combination with the Local Southern sizing method, our control samples were precisely sized with %CV ranging from 0.05% to 0.12% for all markers in groups I and II in 23 and 18 independ-ent runs, respectively, over the course of 5 months. These values included the variation from sample prepar-ation, PCR amplificprepar-ation, fragment separprepar-ation, peak de-tection to fragment sizing. For dinucleotide markers,
these data also indicate that the addition of the GTGTCTT tail to our primer sets in conjunction with optimized extension time have successfully promoted consistent amplifications of fragment size using a basic PCR protocol. The observed precision demonstrates the reproducibility of this process over time.
From a collective reference dataset of 5,508 alleles from 27 subjects and 1 cell line, we have defined bins or categories representing different fragment sizes for each marker to enable automatic allele identification in future studies with these markers. This dataset is unique in that sufficient replicates of the same allele have been ampli-fied using samples from different T cell isolates that have been cultured and lysed at different times, thus testing a wide spectrum of variation during sample preparation. Allowing a bin offset of +/−0.5 base pairs, the perform-ance of the entire process showed percents deviation from expected values of 0.63% and 0.77% in 1,920 and 1,560 alleles analyzed for groups I and II dinucleotide markers, respectively. Most misidentifications were of nonspecific signals above our preset threshold values or from the unequal amplifications of alleles, which were related to poor sample quality rather than process qual-ity since control samples were performed optimally on the same runs. We actually expected higher deviations since all samples from this dataset were amplified with crude lysates of T cells. In the analysis of control sam-ples, similarly amplified with crude lysates, we had leaned towards a higher estimation of the percent devi-ation by counting both alleles as being miscalled for marker D5S346 when background signals were also identified as alleles. Automated allele identification of quasimonomorphic mononucleotide markers, Bat25 and Bat26, was highly reproducible using the algorithm of >95% of maximum height as the cut-off value for identi-fication of additional alleles and an allowable +1 nucleo-tide deviation due to the variable biochemistry of amplifying these markers. These data support the repro-ducibility and accuracy of this high-throughput process.
D5S346 BAT26 BAT25 D6S262 D7S481 D3S3623
Child 1
Child 2 Parent 1
Parent 2
D5S346 D5S346
BAT26 BAT26
BAT25
BAT25 D6S262
D6S262
D7S481
D7S481 D3S3623
D3S3623
D3S3623
D7S481
D6S262 BAT25
BAT26
D5S346
219
203 227
219
219 227 227 225 201
203 203
193
193 193
203
174 184
180
180 184 184
174 174
94 94
89
103
89 89
92 94
122 126
122 122 122
126
126 127
127
Conclusions
In this investigation, we have documented our experi-ence with the optimization of multiplex PCR conditions and automated allele identification, and have generated a unique body of data that provide a starting point for a cost-effective, high-throughput process of microsatellite analysis using the studied markers. For specific applica-tions, markers may be exchanged or added with some optimization to the existing assay format and analysis methods. For microsatellite instability studies to test the functional deficiency of mismatch repair, the placement of polymorphic markers in proximity to mismatch repair components in this assay may provide additional infor-mation on LOH.
Methods
Study population and sample collection
T-cells were isolated from healthy controls and a subset of study participants with inflammatory bowel disease (n = 12 with Crohn’s disease and n = 7 with ulcerative colitis) and B cell acute lymphoblastic leukemia (n = 4) previously recruited from the pediatric and adult gastro-enterology clinics and pediatric oncology units at Fletcher Allen Health Care, University of Vermont, and other par-ticipating Pediatric Oncology Groups/Children’s Oncology Group institutions [29,30]. Informed consent was ob-tained from all subjects following procedures approved by the Committee on Human Research at the University of Vermont and participating institutions of the cooperative Pediatric Oncology Group/Children’s Oncology Groups.
Microsatellite assay
The amplifications of 11 microsatellite loci are
performed in two multiplex PCR reactions, consisting of 6 and 5 sets of forward and reverse primers that are ei-ther labeled with fluorescent tags Hex, Fam or Ned, or tailed with GTGTCTT nucleotides. Previous research demonstrated that Taq polymerase can catalyze non-templated 30 terminal nucleotide addition, primarily ad-enosine, to amplified DNA fragments. This activity depends on adjacent DNA sequence context [31-33], with preferential adenylation following 30-cytidine or thymidine, resulting in genotyping errors due to tions in the fractions of adenylated products. Such varia-tions were improved by performing PCR reacvaria-tions under conditions that either favored the production of the true allele (two-step PCR protocols) or conditions that pro-duced primarily the adenylated products (three-step PRC protocols with longer extension times up to 90 min; true allele plus A) for consistent genotyping. Brownstein further showed that adding specific generic tails of 6–7 nucleotides to the 50end of reverse primers more consistently promoted the adenylation of amplified DNA products [34]. In our experiments, we have added
a GTGTCTT tail, previously tested by Brownstein, to the 50ends of all unlabeled primers and performed PCR reactions under favorable conditions to promote the adenylation of the majority of PCR products.
To accommodate variations in microsatellite size among individuals (range listed in Table 3) and possible instability, the analyses of multiple loci within the same PCR reaction are made possible by designing primers, when labeled with similar fluorescent dyes to prime products that are at least 40 nucleotides apart in size.
Fi-nally, sample requirement is minimized by the
miniaturization of PCR reactions in 10μL volume.
DNA samples
DNA templates from both purified DNA as well as crude cell lysates have been utilized in PCR reactions. Adequate fluorescence units have been achieved with amplifications of as low as 0.75 ng of purified DNA and 0.5μL of lysates of 10,000 T cell pellets. Cell lysates are prepared by adding 10 μL of lysis reagent containing 80% Qiagen EB buffer (10 mM Tris–HCl pH 8.5; Qiagen, Inc., Valencia, USA), 0.5% Tween 20, 0.5% NP40, and 0.1 mg/mL of proteinase K to cell pellets, followed by incubation at 56°C for 1 h and heat inactiva-tion at 96°C for 10 min.
PCR conditions
PCR reactions are performed with 10 mM Tris–HCl pH 8.3, 50 mM KCl, 1.5 mM MgCl2, 0.25U or 0.025 U/μL of platinum (Invitrogen Corporation, Grand Island, USA) or HotStart-It Taq polymerase (USB Corporation, Cleveland, USA), primers at concentrations listed in Table 3, and DNA templates. Reaction mixtures are heated to 94°C for 2 min for enzyme activation and then for 35 cycles (94°C for 30 s, 55°C for 30 s, and 72°C for 40 s) with a final extension at 72°C for 10 min.
Microsatellite detection and analysis
Amplified products from PCR reactions 1 and 2 are di-luted with water. A volume of 1 μL of diluted products
are mixed with 10 μL of formamide and 0.4 μL of
Additional files
Additional file 1:Summary of all samples and clones that have been amplified with optimized PCR conditions using groups I and II microsatellite markers.Raw data from these samples have been used to optimize marker and method parameters to achieve specific peak detection, precise fragment sizing, and accurate automated allele identification. Sizing values and allele calls for 5,508 alleles have been automatically analyzed with optimized parameters and bin settings, using the Advanced Peak Detection Algorithm in combination with the Local Southern sizing method. Samples or clones with asterisk represent those that have been miscalled by automated allele identification.
Additional file 2:Process reproducibility with group I markers. Summary of sizing values of identified alleles for each marker from the amplification of control samples in 23 independent runs over the course of 5 months. Averages, standard deviations, and %CVs have been calculated for each allele. Process variation includes sample preparation, PCR amplification, fragment separation, peak detection, and fragment sizing.
Additional file 3:Process reproducibility with group II markers. Summary of sizing values of identified alleles for each marker from the amplification of control samples in 18 independent runs over the course of 1 month. Averages, standard deviations, and %CVs have been calculated for each allele. Process variation include sample preparation, PCR amplification, fragment separation, peak detection, and fragment sizing.
Additional file 4:Process accuracy with group I markers.Summary of results from automated allele identification of 1,920 dinucleotide markers and 960 mononucleotide markers from 239 T cell clones from different subjects organized by dates of processing.
Additional file 5:Process accuracy with group II markers.Summary of results from automated allele identification of 1,560 dinucleotide markers from 156 T cell clones from different subjects organized by dates of processing. Percent deviation from expected values connotes the percent of alleles that have been miscalled, indicated by an asterisk. Misidentification can represent failure in any part of the process from sample preparation, PCR amplification, fragment separation, peak detection, fragment sizing, to automated allele calling. We manually analyzed all discordant samples and found failures to be related to either the interferences of nonspecific signals above threshold values or from the unequal amplification of alleles. These failures were likely related to poor sample quality since control samples were performed optimally in the same runs.
Abbreviations
HNPCC: Hereditary nonpolyposis colorectal cancer; LOH: Loss of heterozygosity; MSI: Microsatellite instability.
Competing interests
The authors declare that they have no competing interests.
Authors’contributions
All authors participated in the preparation of the manuscript, and read and approved the final manuscript.
Acknowledgments
This work was supported by the National Cancer Institute (grant no.: CA09094013) and by the Burroughs Wellcome Fund (grant no.: 1003312). Fragment separation was performed in the Vermont Cancer Center DNA Analysis Facility. We thank Dr. Bruce Scott for sharing his experience with the optimization of multiplex PCR reactions and Dr. Heather Kendall for sharing her experience with microsatellite analysis.
Author details
1Department of Pediatrics, Vermont Cancer Center, University of Vermont,
Burlington, VT 05401, USA.2Medicine Institute, Cleveland Clinic, Cleveland, OH 44195, USA.3Neurological Institute, Cleveland Clinic, 9500 Euclid Ave,
Cleveland, OH S100A, USA.4Biosciences Department, Global Neuroscience Initiative Foundation, Beverly Hills, CA 91412, USA.
Received: 29 October 2012 Accepted: 14 January 2013 Published: 5 March 2013
References
1. Ellegren H:Microsatellites: simple sequences with complex evolution.Nat Rev Genet2004,5:435–445.
2. Rubben A, Kempf W, Kadin ME, Zimmermann DR, Burg G:Multilineage progression of genetically unstable tumor subclones in cutaneous T-cell lymphoma.Exp Dermatol2004,13:472–483.
3. Ionov Y, Peinado MA, Malkhosyan S, Shibata D, Perucho M:Ubiquitous somatic mutations in simple repeated sequences reveal a new mechanism for colonic carcinogenesis.Nature1993,363:558–561. 4. Thibodeau SN, Bren G, Schaid D:Microsatellite instability in cancer of the
proximal colon.Science1993,260:816–819.
5. Aaltonen LA, Peltomaki P, Leach FS, Sistonen P, Pylkkanen L, Mecklin JP, Jarvinen H, Powell SM, Jen J, Hamilton SR, Petersen GM, Kinzler KW, Vogelstein B, de la Chapelle A:Clues to the pathogenesis of familial colorectal cancer.Science1993,260:812–816.
6. Lengauer C, Kinzler KW, Vogelstein B:Genetic instabilities in human cancers.Nature1998,396:643–649.
7. Markowitz S:DNA repair defects inactivate tumor suppressor genes and induce hereditary and sporadic colon cancers.J Clin Oncol2000, 18:75S–80S.
8. Li GM:DNA mismatch repair and cancer.Front Biosci2003,8:d997–d1017. 9. Stojic L, Brun R, Jiricny J:Mismatch repair and DNA damage signalling.
DNA Repair (Amst)2004,3:1091–1101.
10. Bhattacharyya NP, Skandalis A, Ganesh A, Groden J, Meuth M:Mutator phenotypes in human colorectal carcinoma cell lines.Proc Natl Acad Sci USA1994,91:6319–6323.
11. Koi M, Umar A, Chauhan DP, Cherian SP, Carethers JM, Kunkel TA, Boland CR:Human chromosome 3 corrects mismatch repair deficiency and microsatellite instability and reduces N-methyl-N’ -nitro-N-nitrosoguanidine tolerance in colon tumor cells with homozygous hMLH1 mutation.Cancer Res1994,54:4308–4312.
12. Umar A, Boland CR, Terdiman JP, Syngal S, de la Chapelle A, Ruschoff J, Fishel R, Lindor NM, Burgart LJ, Hamelin R, Hamilton SR, Hiatt RA, Jass J, Lindblom A, Lynch HT, Peltomaki P, Ramsey SD, Rodriguez-Bigas MA, Vasen HF, Hawk ET, Barrett JC, Freedman AN, Srivastava S:Revised Bethesda Guidelines for hereditary nonpolyposis colorectal cancer (Lynch syndrome) and microsatellite instability.J Natl Cancer Inst2004,96:261–268.
13. Aebi S, Fink D, Gordon R, Kim HK, Zheng H, Fink JL, Howell SB:Resistance to cytotoxic drugs in DNA mismatch repair-deficient cells.Clin Cancer Res
1997,3:1763–1767.
14. Fink D, Nebel S, Norris PS, Aebi S, Kim HK, Haas M, Howell SB:The effect of different chemotherapeutic agents on the enrichment of DNA mismatch repair-deficient tumour cells.Br J Cancer1998,77:703–708.
15. Glaab WE, Risinger JI, Umar A, Barrett JC, Kunkel TA, Tindall KR:Resistance to 6-thioguanine in mismatch repair-deficient human cancer cell lines correlates with an increase in induced mutations at the HPRT locus.
Carcinogenesis1998,19:1931–1937.
16. Peltomaki P:Role of DNA mismatch repair defects in the pathogenesis of human cancer.J Clin Oncol2003,21:1174–1179.
17. Gafanovich A, Ramu N, Krichevsky S, Pe’er J, Amir G, Ben-Yehuda D: Microsatellite instability and p53 mutations in pediatric secondary malignant neoplasms.Cancer1999,85:504–510.
18. Gartenhaus RB:Microsatellite instability in hematologic malignancies.
Leuk Lymphoma1997,25:455–461.
19. Olipitz W, Hopfinger G, Aguiar RC, Gunsilius E, Girschikofsky M, Bodner C, Hiden K, Linkesch W, Hoefler G, Sill H:Defective DNA-mismatch repair: a potential mediator of leukemogenic susceptibility in therapy-related myelodysplasia and leukemia.Genes Chromosom Canc2002,34:243–248. 20. Fulop Z, Csernus B, Timar B, Szepesi A, Matolcsy A:Microsatellite instability
and hMLH1 promoter hypermethylation in Richter’s transformation of chronic lymphocytic leukemia.Leukemia2003,17:411–415.
21. Ohyashiki JH, Ohyashiki K, Aizawa S, Kawakubo K, Shimamoto T, Iwama H, Hayashi S, Toyama K:Replication errors in hematological neoplasias: genomic instability in progression of disease is different among different types of leukemia.Clin Cancer Res1996,2:1583–1589.
23. Suraweera N, Duval A, Reperant M, Vaury C, Furlan D, Leroy K, Seruca R, Iacopetta B, Hamelin R:Evaluation of tumor microsatellite instability using five quasimonomorphic mononucleotide repeats and pentaplex PCR.
Gastroenterology2002,123:1804–1811.
24. Xicola RM, Llor X, Pons E, Castells A, Alenda C, Pinol V, Andreu M, Castellvi-Bel S, Paya A, Jover R, Bessa X, Girós A, Duque JM, Nicolás-Pérez D, Garcia AM, Rigau J, Gassull MA, Gastrointestinal Oncology Group of the Spanish Gastroenterological Association:Performance of different microsatellite marker panels for detection of mismatch repair-deficient colorectal tumors.J Natl Cancer Inst2007,99:244–252.
25. Boland CR, Thibodeau SN, Hamilton SR, Sidransky D, Eshleman JR, Burt RW, Meltzer SJ, Rodriguez-Bigas MA, Fodde R, Ranzani GN, Srivastava S:A National Cancer Institute Workshop on Microsatellite Instability for cancer detection and familial predisposition: development of international criteria for the determination of microsatellite instability in colorectal cancer.Cancer Res1998,58:5248–5257.
26. Umar A, Koi M, Risinger JI, Glaab WE, Tindall KR, Kolodner RD, Boland CR, Barrett JC, Kunkel TA:Correction of hypermutability, N-methyl-N’ -nitro-N-nitrosoguanidine resistance, and defective DNA mismatch repair by introducing chromosome 2 into human tumor cells with mutations in MSH2 and MSH6.Cancer Res1997,57:3949–3955.
27. Southern EM:Measurement of DNA length by gel electrophoresis.Anal Biochem1979,100:319–323.
28. Ghosh S, Karanjawala ZE, Hauser ER, Ally D, Knapp JI, Rayman JB, Musick A, Tannenbaum J, Te C, Shapiro S, Eldridge W, Musick T, Martin C, Smith JR, Carpten JD, Brownstein MJ, Powell JI, Whiten R, Chines P, Nylund SJ, Magnuson VL, Boehnke M, Collins FS:Methods for precise sizing, automated binning of alleles, and reduction of error rates in large-scale genotyping using fluorescently labeled dinucleotide markers. FUSION (Finland-U.S. Investigation of NIDDM Genetics) Study Group.Genome Res
1997,7:165–178.
29. Nguyen T, Vacek PM, O’Neill P, Colletti RB, Finette BA:Mutagenicity and potential carcinogenicity of thiopurine treatment in patients with inflammatory bowel disease.Cancer Res2009,1:7004–7012.
30. Kendall HE, Vacek PM, Rivers JL, Rice SC, Messier TL, Finette BA:Analysis of genetic alterations and clonal proliferation in children treated for acute lymphocytic leukemia.Cancer Res2006,66:8455–8461.
31. Clark JM:Novel non-templated nucleotide addition reactions catalyzed by procaryotic and eucaryotic DNA polymerases.Nucleic Acids Res1988, 16:9677–9686.
32. Hu G:DNA polymerase-catalyzed addition of nontemplated extra nucleotides to the 30end of a DNA fragment.DNA Cell Biol1993, 12:763–770.
33. Smith JR, Carpten JD, Brownstein MJ, Ghosh S, Magnuson VL, Gilbert DA, Trent JM, Collins FS:Approach to genotyping errors caused by nontemplated nucleotide addition by Taq DNA polymerase.Genome Res
1995,5:312–317.
34. Brownstein MJ, Carpten JD, Smith JR:Modulation of non-templated nucleotide addition by Taq DNA polymerase: primer modifications that facilitate genotyping.Biotechniques1996,20:1004-6–1008-10.
doi:10.1186/1479-7364-7-6
Cite this article as:Nguyenet al.:Development of a cost-effective
high-throughput process of microsatellite analysis involving miniaturized multiplexed PCR amplification and automated allele identification.
Human Genomics20137:6.
Submit your next manuscript to BioMed Central and take full advantage of:
• Convenient online submission
• Thorough peer review
• No space constraints or color figure charges
• Immediate publication on acceptance
• Inclusion in PubMed, CAS, Scopus and Google Scholar
• Research which is freely available for redistribution