R E S E A R C H
Open Access
A comparative study of
k
-spectrum-based
error correction methods for
next-generation sequencing data analysis
Isaac Akogwu
1, Nan Wang
1, Chaoyang Zhang
1and Ping Gong
2*Abstract
Background:Innumerable opportunities for new genomic research have been stimulated by advancement in high-throughput next-generation sequencing (NGS). However, the pitfall of NGS data abundance is the complication of distinction between true biological variants and sequence error alterations during downstream analysis. Many error correction methods have been developed to correct erroneous NGS reads before further analysis, but independent evaluation of the impact of such dataset features as read length, genome size, and coverage depth on their performance is lacking. This comparative study aims to investigate the strength and weakness as well as limitations of some newest k-spectrum-based methods and to provide recommendations for users in selecting suitable methods with respect to specific NGS datasets.
Methods: Sixk-spectrum-based methods, i.e., Reptile, Musket, Bless, Bloocoo, Lighter, and Trowel, were compared using six simulated sets of paired-end Illumina sequencing data. These NGS datasets varied in coverage depth (10× to 120×), read length (36 to 100 bp), and genome size (4.6 to 143 MB). Error Correction Evaluation Toolkit (ECET) was employed to derive a suite of metrics (i.e., true positives, false positive, false negative, recall, precision, gain, and F-score) for assessing the correction quality of each method.
Results:Results from computational experiments indicate that Musket had the best overall performance across the spectra of examined variants reflected in the six datasets. The lowest accuracy of Musket (F-score = 0.81) occurred to a dataset with a medium read length (56 bp), a medium coverage (50×), and a small-sized genome (5.4 MB). The other five methods underperformed (F-score < 0.80) and/or failed to process one or more datasets. Conclusions:This study demonstrates that various factors such as coverage depth, read length, and genome size may influence performance of individualk-spectrum-based error correction methods. Thus, efforts have to be paid in choosing appropriate methods for error correction of specific NGS datasets. Based on our comparative study, we recommend Musket as the top choice because of its consistently superior performance across all six testing datasets. Further extensive studies are warranted to assess these methods using experimental datasets generated by NGS platforms (e.g., 454, SOLiD, and Ion Torrent) under more diversified parameter settings (k-mer values and edit distances) and to compare them against other non-k-spectrum-based classes of error correction methods.
Keywords:Next-generation sequencing (NGS),k-mer,k-spectrum, Error correction, Sequence analysis, Bloom filter
* Correspondence:[email protected]
2Environmental Laboratory, U.S. Army Engineer Research and Development
Center, Vicksburg, MS 39180, USA
Full list of author information is available at the end of the article
Background
Rapid generation and availability of massive amounts of DNA sequence data generated using next-generation sequencing (NGS) technologies at lower cost in com-parison to traditional Sanger sequencing has led to a genuine ability to decipher genomes and perform ground-breaking biological research [1]. Some instances of the far reaching applications of NGS data include human genome profiling [2], microbiome research [3], de novo genome assembly [4], meta-genomics, and uncommon genetic variants identification [5]. In practice, NGS data has its challenges due to its relatively shorter read length and higher error rates in comparison to traditional Sanger sequencing [6], consequently constituting an undesirable property for downstream investigation.
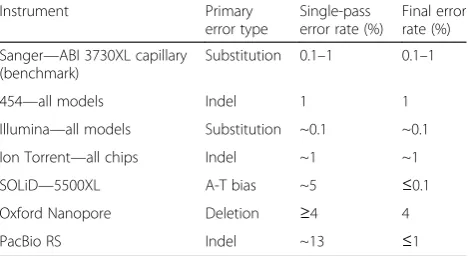
The rates and types of sequencing error vary among different NGS technologies (Table 1) [7]. It is critically important to correct erroneous sequencing data before further downstream analysis. There exist multiple lines of evidence for negative effects of sequence errors on population-genetic studies [5] and output of alignment algorithms [8]. It has also been shown that correcting these errors has positive impact on downstream analysis such as improved genome assembly [4] and identifica-tion of single nucleotide polymorphism (SNP) [9].
The general idea for correcting sequencing errors is that erroneous bases (i.e., nucleotides) in a DNA sequence read can be corrected using the majority of reads that have these bases correctly since errors occur infrequently and independently. Many error correction methods have been developed, some implemented as an integral part of a computational tool for de novo genome assembly [10, 11], while others as standalone tools [12–14]. Based on the type of data structure applied, these methods can be cate-gorized into four main classes [15, 16]: k-mer spectrum-based (ork-spectrum-based) (e.g., Quake [17], Reptile [13]
and Hammer [18]), suffix t-ree/array-based (HiTEC [19], SHREC [14] and Hybrid-SHREC [20]), multiple sequence alignment (MSA)-based (ECHO [12] and Coral [21]) and hidden Markov model (HMM)-based (PREMIER [22] and SEECER [23]).
Since Yang et al. [15] last reviewed error correction methods available as of December 2011, many new algorithms have been developed, especially in the fast-growing category of k-spectrum-based methods. In the past 2 years, at least five new k-spectrum-based methods have emerged, including Musket [24], Bless [16], Trowel [25], Lighter [26], and Bloocoo [27]. These new tools have made significant improvements in either memory usage, speed, or correction quality over previously existing tools. Authors of these new tools carried out a varying degree of comparison with other tools on synthetic and/or experi-mental datasets in order to demonstrate the superiority of their own tools. However, these authors chose different competitors for comparison and used different datasets and metrics for evaluation, making it hard to tell the rela-tive strength and weakness between themselves.
The goal of this comparative study is to conduct an independent and unbiased assessment of the newly developed k-spectrum-based error correctors and to provide some guidance concerning how to choose a suitable error correction tool from the long list of existing methods. In particular, there is a lack of available studies that comprehensively investigate such factors as reference genome size, read length, and genome coverage depth that may differentially influence the performance of individual algorithm. Here, we first introduce the basics of k -spectrum error correction algorithms, and briefly review six sequence error correctors chosen for this study with an emphasis on distinctive features of each tool. Then, we present analytical results of method evaluation using sim-ulated NGS datasets and make suggestions on which method is more suitable for a specific sequencing dataset. Finally, we discuss future perspectives and further studies required for assessing the performance of existing and newly developed error correction programs.
Methods
General framework ofk-spectrum-based error correction methods
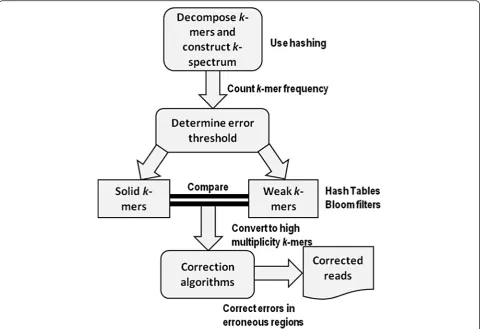
Error correction methods based onk-spectrum originate from earlier implementation of de Bruijn graph assem-blers using spectral alignment [28] and follow a general-ized framework as shown in Fig. 1. A k-spectrum is the distribution of a set of decomposed distinct substring of length k (i.e., k-mer) observed in a group of reads. It counts the occurrence of all k-length contiguous strings represented as a vector within the spectrum feature space. The expectation is that errors in a sequence will result in a strong divergence at low k-mer frequencies
Table 1Sequence error rates for different NGS platforms in comparison with the traditional Sanger technology (updated as of 2012 at http://www.molecularecologist.com/next-gen-table-3c-2014/). See Glenn (2011) [41] for more details. Single-pass reads are those raw sequences that have not been subject to consensus adjustment incorporated in final base calling
Instrument Primary
error type
Single-pass error rate (%)
Final error rate (%)
Sanger—ABI 3730XL capillary (benchmark)
Substitution 0.1–1 0.1–1
454—all models Indel 1 1
Illumina—all models Substitution ~0.1 ~0.1
Ion Torrent—all chips Indel ~1 ~1
SOLiD—5500XL A-T bias ~5 ≤0.1
Oxford Nanopore Deletion ≥4 4
compared to a sequence without errors. One challenge in error correction is that inconsistent genome sampling and genomic repeats may occur at high frequencies and consequently result in numerous equally susceptible cor-rection possibilities. Owing to this, a frequently explored property of the k-mer spectra is the distribution com-position of the spectra representing motif groups with varying sequence and bias frequencies [29]. This implies that based on their frequencies of occurrences, k-mers having small hamming distances are presumably of the same genomic locus and have to be corrected. K -spectrum-based correction starts by assigning a weighted value to each k-mer after extraction from sequencing reads. The value is assigned based on sorted count frequencies or base quality scores. By determining and selecting an acceptable error threshold [30, 31], weak
(insolid or untrusted) k-mers with low frequencies are separated from solid (trusted) k-mers (with high fre-quencies). The reads with weak k-mers are considered for error correction by repeatedly converting them into solid k-mers until there are no more weak k-mers in the sequence. Hence, only solid k-mers will be kept after correction.
Bloom filter
The majority of the methods investigated in this study apply Bloom filters as their data structure. As a space-efficient probabilistic data structure, a Bloom filter is used to test whether an element is a member of a set using binary array and multiple hash functions [32]. It can accurately determine a non-member element of the set. A query may return false positives but no false neg-atives, thus a bloom filter has a 100 % recall rate. A Bloom filter does not store the elements themselves but allows testing whether an object is certainly absent in the filter or has been probably added to the Bloom filter. For sequence error correction purposes, most methods implement the counting Bloom filter variant where array positions are not single bits but an n-bit counter. The efficiency of Bloom filters relies upon the number of bits in the array, the number of hash func-tions, and most importantly the quality of the hash functions.
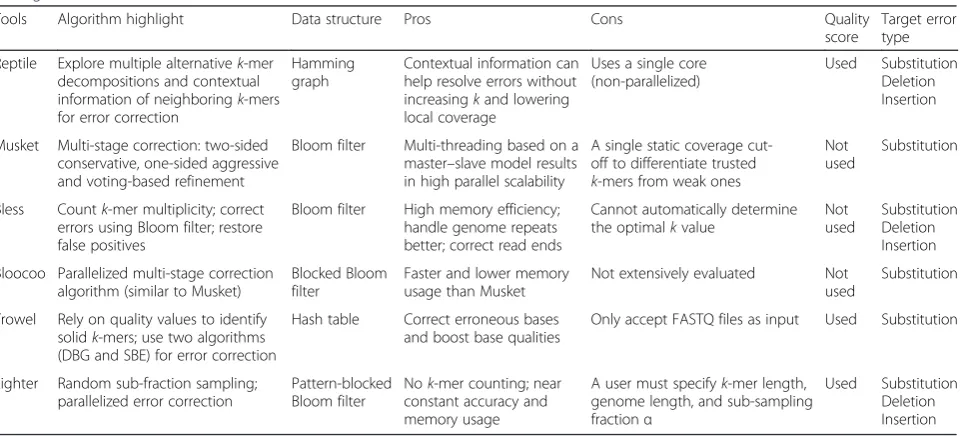
Trowel [25], and Lighter [26], in addition to a relatively old program called Reptile [13] (published in 2010), were chosen for this comparative study. Reptile was chosen because it has been extensively evaluated and consist-ently proved to be an upper-scale performer in compari-son with many other major error correction programs [13, 15, 16]. As summarized in Table 2, these methods differ greatly in error correction algorithms as well as in how hash tables and Bloom filters are implemented. The evaluated version is as follows: Reptile version 1.1, Musket version 1.1, Bless v0p23 for 64× Linux, Bloocoo 1.0.4-linux, Lighter version 1.1, and Trowel version 0.1.4.2.
Reptile [13] explores multiple alternativek-mer decom-positions of an erroneous read and corrects errors by simultaneously examining Hamming (the number of posi-tions at which two strings differ) distance-based correc-tion possibilities for potentially erroneous k-mers using neighboring k-mers from the same read for correct con-textual information. It also incorporates quality score in-formation when available and has functionality to deal with ambiguous bases labeled as N’s. Reptile achieved a significant reduction in run time and memory usage and improvement in correction quality when compared with such existing methods as SHREC, Coral, Hybrid-SHREC, Quake, HiTEC, and ECHO [13, 15].
Musket [24] uses a multi-stage workflow including two-sided conservative correction, one-sided aggressive correction, and voting-based refinement. It computes the multiplicity of each k-mer in the hash table in order to filter out the stored uniquek-mers using Bloom filter. A parallelized slave-masterk-mer counting method is im-plemented to sort out unique k-mers and then generates
k-mer coverage histograms to determine a cut-off for ak -mer spectrum for the coverage of likely correct and erro-neous k-mers. The error correction stage initially uses a two-sided correction that conservatively corrects one sub-stitution error, at most, in any k-mer of a read with the intention of finding a unique alternative base that makes all k-mers covering the position trusted. Significant im-provement in speed can be achieved by evaluating only the leftmost and rightmostk-mers that cover the position. It then applies a one-sided correction to aggressively cor-rect errors in the case of more than one error occurring in a single k-mer. Furthermore, to confine the number of false positives, error correction is conducted for each inte-ger value from 1 to the maximal allowable number of corrections. The drawback is its reliance on alternative selection in the event that ak-mer is wrongly called to be trusted even though it contains sequencing errors or incorrect corrections. To overcome this drawback, look-ahead validation and voting-based refinement are imple-mented to assess the trustiness of a predefined maximal number (default = 2) of neighboringk-mers that cover the base position at which a sequencing error likely occurs. If all evaluated k-mers are trusted for a certain alter-native on that position, this alteralter-native is reserved as one potential correction.
Bless [16] uses a single minimum-sized Bloom filter and disk-based k-mer counting algorithm like disk streaming of k-mers (DSK) [33] and k-mer counter (KMC) [34] to achieve high memory efficiency for error correction, sequence repeat handling, and read end correction by read extension. Briefly, it counts k-mer multiplicity to sort out solid k-mers from weak k-mers, creates a k-mer
Table 2Characteristic features of the sixk-spectrum-based methods investigated in the present comparative study which distinguish one method from others
Tools Algorithm highlight Data structure Pros Cons Quality
score
Target error type
Reptile Explore multiple alternativek-mer decompositions and contextual information of neighboringk-mers for error correction
Hamming graph
Contextual information can help resolve errors without increasingkand lowering local coverage
Uses a single core (non-parallelized)
Used Substitution Deletion Insertion
Musket Multi-stage correction: two-sided conservative, one-sided aggressive and voting-based refinement
Bloom filter Multi-threading based on a master–slave model results in high parallel scalability
A single static coverage cut-off to differentiate trusted
k-mers from weak ones
Not used
Substitution
Bless Countk-mer multiplicity; correct errors using Bloom filter; restore false positives
Bloom filter High memory efficiency; handle genome repeats better; correct read ends
Cannot automatically determine the optimalkvalue
Not used
Substitution Deletion Insertion
Bloocoo Parallelized multi-stage correction algorithm (similar to Musket)
Blocked Bloom filter
Faster and lower memory usage than Musket
Not extensively evaluated Not used
Substitution
Trowel Rely on quality values to identify solidk-mers; use two algorithms (DBG and SBE) for error correction
Hash table Correct erroneous bases and boost base qualities
Only accept FASTQ files as input Used Substitution
Lighter Random sub-fraction sampling; parallelized error correction
Pattern-blocked Bloom filter
Nok-mer counting; near constant accuracy and memory usage
A user must specifyk-mer length, genome length, and sub-sampling fractionα
multiplicity histogram to determine the multiplicity threshold M, and programs those solid k-mers into a Bloom filter. Weak k-mers are converted to their ca-nonical forms using consecutive solid k-mers (known as k-mer islands) in their neighborhood or read end through Bloom filter querying. Bases in a weak k-mer that do not overlap with solid k-mers are modified. For instance, weak k-mers that exist between two consecutive solidk-mer islandsS1andS2are corrected by using the rightmostk-mer ofS1and the leftmostk-mer of
S2. Bless has three distinctive features: high memory effi-ciency, better handling of genome repeats, and more accurate error correction at read ends.
As part of the Genome Assembly & Analysis Took Box (GATB) [27], Bloocoo was developed to correct large datasets with low memory footprints by using DSK [33], a counting algorithm that requires a user to define a fixed amount of memory and disk space. Its error correction process is similar to CUSHAW [35], a pro-cedure also used by Musket. In Bloocoo, the multi-set of all k-mers present in the reads is partitioned, and parti-tions are saved to disk. Then, each partition is separately loaded into memory in a temporary hash table. The k -mer counts are returned by traversing each hash table. Low-abundance k-mers are optionally filtered and solid
k-mers are inserted in the Bloom filter based on a given threshold. With a multi-stage correction approach simi-lar to Musket [24], correction is performed by scanning
k-mers of a read, trying the other three different possible nucleotides at the error site, and checking if correspond-ing k-mers are in the set of solid k-mers. When several close errors occur, the pattern is more complex, and errors are corrected via a voting algorithm. Bloocoo distinguishes itself from other error correctors in the k -mer counting stage and the way that solid k-mers are stored in memory. By using only 11 bits of memory per solid k-mers, Bloocoo requires only 4-GB memory for the entire human genome re-sequencing read correction at 70× coverage.
Different from other tools, Lighter [26] samplesk-mers randomly, i.e., sub-sampling fractionαrather than count-ingk-mers. It uses a pattern-blocked Bloom filter [36] to decrease the overall number of cache misses and improve memory efficiency. Lighter populates Bloom filter A with a k-mer subsample, followed by a simple test applied to each position of each read to compile a set of solidk-mers, and then stores the solid k-mers in Bloom filter B. A sequenced k-mer survives sub-sampling with probability ofα, a user determined sub-sampling fraction that is set to be 0.10(70/C) with C being average coverage. For error correction, Lighter applies a greedy approach like that used in Bless [16] and extends a read when an error is located near the end of the read. Error correction is parallelized by using concurrent threads to handle
subsets of the reads. Lighter maintains near constant accuracy and Bloom filter size as long as the sampling fraction is adjusted in inverse proportion to the coverage depth. However, a user has to specify k-mer length, genome length, and sub-sampling fractionα.
Trowel [25] is a highly parallelized and efficient error correction module for Illumina sequencing reads. The key difference to other tools is that Trowel relies on con-tiguity of high quality values instead of a k-mer coverage distribution to differentiate between solid and weak k -mers. The algorithm not only improves low quality bases but also iteratively expands the trusted k-mer set by including corrected k-mers. Trowel applies two different algorithms, Double Bricks & Gap (DBG) and Single Brick & Edges (SBE), to increase the likelihood that a correction can be made and to boost quality values. TheDBG algo-rithm exploits an asymmetrick1-gap-k2structure, where a gap is a single base, k=k1+k2. The quality of the gap is boosted to the maximum quality value when the index relevant to gap-enclosingbrickscontains the gap with high quality. The SBE algorithm is used because bases at read ends cannot be accessed by thebrickindex. Hence, a new edge-k-edge index is used to correct edges, where an edge is a single base, or increase their quality values as in the DBG algorithm.
Dataset simulation
Reference genome sequences were downloaded from ftp://ftp.ncbi.nih/gov/genomes/refseq, including two bac-teria genomes (Escherichia coli (EC) strain K-12 and
Evaluation tools
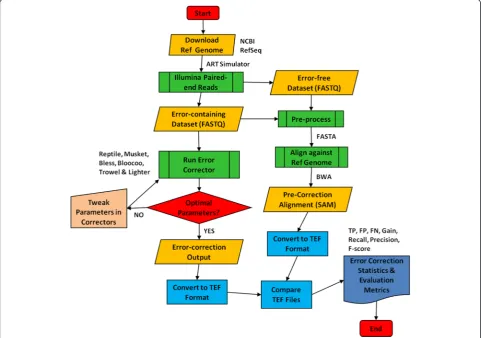
Error Correction Evaluation Toolkit (ECET) version 1.1 [15] was used for performance analysis in order to take advantage of its neutral format known as target error format (TEF), which ensures that all methods are evalu-ated equally (Fig. 2). Furthermore, ECET produces error correction statistics and measures that can be directly used for performance evaluation. Burrows-Wheeler Aligner (BWA) version 0.6.1-r104 [38] was used for short read mapping with default settings except for the edit distance
parameter set to 2 and 4 for short (36/56 bp) and long (100 bp) read length, respectively. Read alignment was performed so as to identify the difference between the reference genome and the erroneous sequence. SamTo-Fastq, one of the Picard command line tools (Release 1.119, http://broadinstitute.github.io/picard), was used to validate the conversion of SAM (sequence alignment/ mapping)-formatted files to FASTQ files [39] imple-mented by the sam-analysis.py script in ECET. KmerGenie version 1.6476 [40] was used to determine the optimalk Table 3Synthetic paired-end Illumina sequencing datasets simulated using ART
Organism (dataset ID) Accession number of reference genome assembly
ART simulation parameter Genome
size (MB) Read length (bp) Genome coverage Fragment/insert size Error rate (%)
Escherichia coli(EC-1) GCF_000005845.2 (ASM584v2) 36 70× 200 0.866 4.6
Escherichia coli(EC-2) GCF_000005845.2 (ASM584v2) 36 20× 200 0.866 4.6
Escherichia coli(EC-3) GCF_000005845.2 (ASM584v2) 100 20× 200 0.952 4.6
Bacillus cereus(BC-1) GCF_000007825.1 (ASM782v1) 56 50× 200 0.175 5.4
Bacillus cereus(BC-2) GCF_000007825.1 (ASM782v1) 100 120× 300 0.109 5.4
Drosophila melanogaster(DM) GCF_000001215.4 (Release 6) 100 10× 300 0.854 143
to be selected for correction. DSK version 2.0.2-Linux [33] was used for counting k-mers for proper estimation of valid k-mers given an optimal k-mer length before error correction.
Evaluation workflow and metrics
As shown in Fig. 2, the workflow consists of the follow-ing steps: sequencfollow-ing dataset simulation, pre- and post-correction alignment to reference genome, parameter optimization for error correctors, and derivation of evaluation statistics and metrics (see http://aluru-sun. ece.iastate.edu/doku.php?id=ecr for more details). Briefly, both error-free and error-containing paired-end sequences were generated in FASTQ format by ART simulation. The error-free data served for the QA/QC purpose throughout the workflow. After converting FASTQ to FASTA (pre-process due to ECET’s header requirements before align-ment), simulated sequences were aligned to a reference genome using BWA. The SAM alignment files produced by BWA were then converted to TEF format using ECET [15]. Error-containing datasets were corrected using error correction tools. The error correction outputs from these tools were converted to TEF files in ECET. The TEF files that generated pre- and post-correction were compared using the Comp2PCAlign script provided in ECET to pro-duce statistics and metrics for performance assessment. Since the quality and accuracy of error correction tools are highly dependent on parameter (particularly k-mer) settings, we introduced an iterative optimization loop to select an optimalkvalue by implementing KmerGenie. In this loop, we also tweaked other parameters while main-taining the same optimal k-mer selected for a specific dataset. For instance, α is a user-defined parameter in Lighter and its default value is set by the formula 0.1(70/C), where C is the coverage depth.
We chose the following widely used metrics to evalu-ate correction quality [13, 15, 16, 24–27]: true positives (TP)—an erroneous base correctly changed to its true base; false positives (FP)—a true base incorrectly changed; false negative (FN)—incorrect base left un-changed; true negative (TN)—true base left unchanged; recall or sensitivity = TP/(TP + FN), precision = TP/(TP + FP), gain = (TP−FP)/(TP + FN), and F-score = 2 × ((preci-sion × recall)/(preci((preci-sion + recall)).
Operating systems
Computational experiments were conducted using mul-tiple machines due to specific requirements of individual tools and varied sizes of synthetic testing datasets; hence, consideration was not given to the performance in terms of run time and memory usage but rather effectiveness and accuracy of read error correction. Due to require-ment of Message Passing Interface (MPI), Bless was run on a Red Hat Enterprise Linux MPI cluster with 12
nodes, and each node had 12-GB memory and 8 cores running at a core speed of 2.93 GHz. For all other tools, datasets with a genome size >5 MB were run on a 64-bit Ubuntu 12.04 LTS Intel Core i7-3770 CPU@ 3.40 GHz machine with 8 cores and 8-GB memory. The
E. coli datasets (genome size <5 MB) were run on a CentOS—64-bit Intel(R) Xeon(R) CPU E5630@ 2.53 GHz machine with 16 processors and a total memory of 296 GB.
Results
The derived performance metrics are presented in Table 4. Bless and Bloocoo each failed to process one dataset, i.e., BC-2 and DM, respectively. A negative gain value means that more errors are introduced into the data than cor-rected. Five methods (Reptile, Bless, Bloocoo, Trowel, and Lighter) produced negative gains, mostly in processing EC-3. F-score is the most comprehensive measure of error correction performance. If setting F-score = 0.8 as the threshold for good performance, all methods ex-cept Musket underperformed with at least one data-set. Therefore, Musket was the best overall performer whereas Trowel was the worst one with five instances of underperformance.
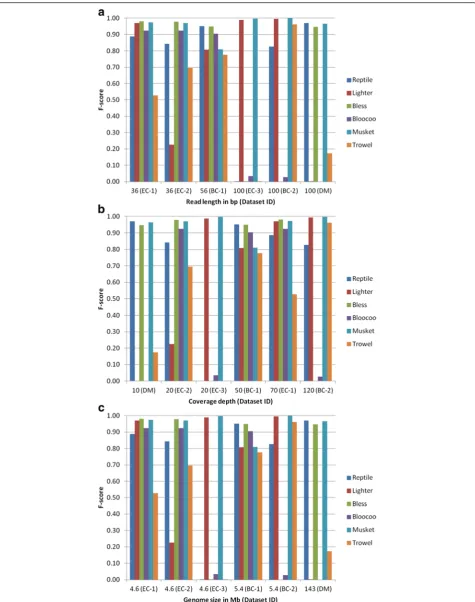
Influence of read length on performance
Three datasets with a short read length of either 36 or 56 bp were processed by four to five methods to a satis-factory degree (F-score > 0.8, Fig. 3a). Only two, three, and four methods generated satisfactory results with the other three 100-bp datasets EC-3, DM, and BC-2, re-spectively. In general, read length has an adverse impact on tool performance, i.e., the longer the read length, the less superior a tool performs. This impact was the most pronounced on Bloocoo, which underperformed in all three long-read datasets. Musket was the most resistant tool because it performed well across all six datasets. For the other four tools, there appeared to exist interactive effects among read length, coverage depth and genome size because no clear-cut relationship between read length and performance was observable.
showed the strongest resistance to variation in coverage depth.
Influence of genome size on performance
Genome size is most likely a covariant that interacts with the other two factors (read length and coverage
depth) because instances of underperformance occurred across the full spectrum of genome size (Fig. 3c). For small genomes (EC and BC), Musket was the best method, followed by Lighter and Reptile (both performed well in four of five datasets), then Bless and Bloocoo (three of five datasets), and Trowel ranked the last. For the
Table 4Performance analysis of sixk-spectrum-based error correctors as evaluated using six synthetic Illumina datasets
Dataset Method TP FP FN Recall Gain Precision F-score
EC-1 Reptile 2335361 144751 451889 0.8378 0.7859 0.9416 0.8867
36 bp Lighter 2695425 72843 91825 0.9671 0.9409 0.9737 0.9704
70× Bless 2624659 48342 56279 0.9790 0.9610 0.9819 0.9805
k= 19 Bloocoo 2411701 22259 375549 0.8653 0.8573 0.9908 0.9238
Musket 2701885 61096 85365 0.9694 0.9474 0.9779 0.9736
Trowel 1246340 705438 1539825 0.4473 0.1941 0.6386 0.5261
EC-2 Reptile 681551 140039 114910 0.8557 0.6799 0.8296 0.8424
36 bp Lighter 108241 58579 688220 0.1359 0.0624 0.6488 0.2247
20× Bless 779824 18095 16637 0.9791 0.9564 0.9773 0.9782
k= 17 Bloocoo 689322 6454 107139 0.8655 0.8574 0.9907 0.9239
Musket 767087 18182 29374 0.9631 0.9403 0.9768 0.9699
Trowel 434885 19167 361576 0.5460 0.5220 0.9578 0.6955
EC-3 Reptile 105 461 876053 0.0001 -0.0004 0.1855 0.0002
100 bp Lighter 858125 2446 18033 0.9794 0.9766 0.9972 0.9882
20× Bless 746 872860 875412 0.0008 -0.9954 0.0009 0.0009
k= 24 Bloocoo 79790 3644539 796368 0.0911 -4.0686 0.0214 0.0347
Musket 873592 1645 2566 0.9971 0.9952 0.9981 0.9976
Trowel 155 178354 876003 0.0002 -0.2034 0.0009 0.0003
BC-1 Reptile 382043 22303 16602 0.9584 0.9024 0.9448 0.9515
56 bp Lighter 331759 15470 141618 0.7008 0.6682 0.9554 0.8086
50× Bless 429017 34018 11943 0.9729 0.8958 0.9265 0.9492
k= 27 Bloocoo 410156 24127 63221 0.8664 0.8155 0.9444 0.9038
Musket 355015 47460 118362 0.7500 0.6497 0.8821 0.8107
Trowel 55277 4976 26744 0.6739 0.6133 0.9174 0.7770
BC-2 Reptile 497425 116 208081 0.7051 0.7049 0.9998 0.8269
100 bp Lighter 698089 159 7417 0.9895 0.9893 0.9998 0.9946
120× Bless – – – – – – –
k= 31 Bloocoo 27409 1278837 678097 0.0389 -1.7738 0.0210 0.0272
Musket 703882 68 1624 0.9977 0.9976 0.9999 0.9988
Trowel 652845 108 52661 0.9254 0.9252 0.9998 0.9612
DM Reptile 11702183 187733 517322 0.9577 0.9423 0.9842 0.9708
100 bp Lighter 42 23055867 12224293 0.0000 -1.8861 0.0000 0.0000
10× Bless 11122683 126388 1101652 0.9099 0.8995 0.9888 0.9477
k= 21 Bloocoo – – – – – – –
Musket 11550483 163838 673852 0.9449 0.9315 0.9860 0.9650
Trowel 1197127 384403 11027208 0.0979 0.0665 0.7569 0.1734
large genome (DM), only three methods (Reptile, Bless and Musket) performed well.
Discussion
Different Bloom filter variants were implemented in four of the six investigated methods to allow compression of the filter, storage of count data, and representation of maps in addition to sets [26] (also see Table 2). The other two methods (Reptile and Trowel) used hash tables, which do not yield false positive. Although Bloom filter’s space efficiency comes at the cost of false posi-tives, all major error correction programs have reduced or minimized false positive rate by implementing various algorithms. Authors who developed these six tools had put lots of efforts in increasing speed and reducing mem-ory footprint while maintaining or improving their correc-tion quality. In the present study, we chose to focus solely on correction quality because speed and memory are no longer bottlenecking factors that limit the application of these tools.
Simulated datasets were used because correction accur-acy could be directly measured. When real experimental datasets are used, only indirect evaluation metrics (e.g., N50 contig size and genome coverage of de novo assem-blies and percentage of mapped reads in genome align-ment) can be derived for performance assessment. We believe that the usage of real datasets in tool evaluation can provide insights that cannot be obtained from simula-tion studies. Nevertheless, extensive evaluasimula-tions should be conducted using simulated datasets before moving on to real datasets. Authors of the six tools investigated in our study have performed evaluations using both synthetic and real datasets. In general, tools that perform well with synthetic datasets also work well with real datasets (see publications featuring Bless [16], Trowel [25], and Lighter [26]). There is a good correlation between performance metrics for simulated and real datasets.
Previous evaluations showed that Musket was consist-ently one of the top performing correctors for both sim-ulated and real datasets when it was compared with several well-regarded programs: HiTEC, SHREC, Coral, Quake, Reptile, DecGPU, and SGA [24]. Here, we also demonstrated that Musket yielded better performance metrics than Reptile. When authors of Bless [16], Trowel [25], and Lighter [26] performed their comparative eval-uations, they claimed that their own tools slightly out-performed Musket. However, if looking more specifically into simulated datasets, Musket performed equally well as the other three tools did (e.g., the synthetic 40× human chromosome 1 dataset used in [16]). Bloocoo shares a great deal of similarity with Musket, especially in the multi-stage error correction algorithm [24, 27]. They reportedly achieved similar correction accuracy as mea-sured by recall and precision on a simulated dataset with
1 % error rate from human chromosome 1 at 70× cover-age (see“Supplementary Material”in [27]). In the current study, these two programs did perform equally well on three datasets (EC-1, EC-2, and BC-1 with read length of 36 or 56 bp). However, Bloocoo underperformed or failed on the remaining three datasets with longer reads (100 bp), suggesting the existence of potential bottleneck factors in the scripts of Bloocoo that limit its application to longer reads.
An inherent difficulty in using any corrector is the challenge of choosing optimal parameters [13]. Very few tools have implemented automated choice of parameters sensitive to datasets being processed. Although Bless [16] can automatically choose an appropriate value for
M, k-mer multiplicity threshold, it cannot select an optimalkand nor can other tools evaluated in this study (except for Reptile [13], which choosesk= log4|G|, where
G is the genome length). We used KmerGenie [40] to de-termine an optimalkfor each dataset. While it is possible that the kpicked by KmerGenie may not be the optimal value for all six evaluated tools, we performed limited tests in tweakingkand other user-defined, tool-specific param-eters but did not observe significant deviations in terms of performance metrics (data not shown). For similar rea-sons, we set edit distance to 2 (36/56-bp reads) or 4 (100-bp reads) for read alignment based on the recommen-dation of 4 % read length (see http://bio-bwa.sourceforge. net/bwa.shtml). Therefore, we only reported in Table 4 the results obtained under default settings for tool-specific pa-rameters, the chosenkvalues (determined by KmerGenie), and the fixed edit distances.
Conclusions
454, SOLiD, and Ion Torrent), a wider spectrum of genome size and complexity (e.g., human and mouse genomes), and longer reads (e.g., 300 to 500 bp). More in-depth evaluation is also warranted to investigate other factors like real datasets generated from a wide range of applications (e.g., transcriptome mapping, SNP genotyping, and de novo genome assembly) as well as data structure (e.g., Cucoo filter vs. Bloom filter) on error correction outcomes.
Competing interests
The authors declare that they have no competing interests.
Authors’contributions
PG and CZ conceived the project. IA conducted the computational experiments. CZ and NW supervised the experiments. IA and PG drafted the manuscript. All authors read and approved the final manuscript.
Acknowledgements
This work was supported by a National Science Foundation award (EPS 0903787) to CZ and NW and an intramural grant from the US Army Environmental Quality/Installation (EQI) Basic Research Program to PG. Permission was granted by the Chief of Engineer to publish this paper.
Declarations
Funding for publication of the article came from the US Army EQI Basic Research Program.
This article has been published as part ofHuman GenomicsVolume 10 Supplement 2, 2016: From genes to systems genomics: human genomics. The full contents of the supplement are available online at http:// humgenomics.biomedcentral.com/articles/supplements/volume-10-supplement-2.
Author details
1School of Computing, University of Southern Mississippi, Hattiesburg, MS
39406, USA.2Environmental Laboratory, U.S. Army Engineer Research and
Development Center, Vicksburg, MS 39180, USA.
Published: 25 July 2016
References
1. Metzker ML. Sequencing technologies—the next generation. Nat Rev Genet. 2010;11:31–46.
2. Lupski JR, Reid JG, Gonzaga-Jauregui C, Rio DD, Chen DC, Nazareth L, et al. Whole-genome sequencing in a patient with Charcot-Marie-Tooth neuropathy. N Engl J Med. 2010;362:1181–91.
3. Peterson J, Garges S, Giovanni M, McInnes P, Wang L, Schloss JA, et al. The NIH Human Microbiome Project. Genome Res. 2009;19:2317–23. 4. Salzberg SL, Phillippy AM, Zimin A, Puiu D, Magoc T, Koren S, et al. GAGE:
a critical evaluation of genome assemblies and assembly algorithms. Genome Res. 2012;22:557–67.
5. Nielsen R, Paul JS, Albrechtsen A, Song YS. Genotype and SNP calling from next-generation sequencing data. Nat Rev Genet. 2011;12:443–51. 6. Lam HY, Clark MJ, Chen R, Chen R, Natsoulis G, O’Huallachain M, et al.
Performance comparison of whole-genome sequencing platforms. Nat Biotechnol. 2012;30:78–82.
7. Suzuki S, Ono N, Furusawa C, Ying BW, Yomo T. Comparison of sequence reads obtained from three next-generation sequencing platforms. PLoS One. 2011;6, e19534.
8. Pearson WR. Searching protein sequence libraries: comparison of the sensitivity and selectivity of the Smith-Waterman and FASTA algorithms. Genomics. 1991;11:635–50.
9. Brockman W, Alvarez P, Young S, Garber M, Giannoukos G, Lee WL, et al. Quality scores and SNP detection in sequencing-by-synthesis systems. Genome Res. 2008;18:763–70.
10. Li R, Zhu H, Ruan J, Qian W, Fang X, Shi Z, et al. De novo assembly of human genomes with massively parallel short read sequencing. Genome Res. 2010;20:265–72.
11. Maccallum I, Przybylski D, Gnerre S, Burton J, Shlyakhter I, Gnirke A, et al. ALLPATHS 2: small genomes assembled accurately and with high continuity from short paired reads. Genome Biol. 2009;10:R103.
12. Kao WC, Chan AH, Song YS. ECHO: a reference-free short-read error correction algorithm. Genome Res. 2011;21:1181–92.
13. Yang X, Dorman KS, Aluru S. Reptile: representative tiling for short read error correction. Bioinformatics. 2010;26:2526–33.
14. Schroder J, Schroder H, Puglisi SJ, Sinha R, Schmidt B. SHREC: a short-read error correction method. Bioinformatics. 2009;25:2157–63.
15. Yang X, Chockalingam SP, Aluru S. A survey of error-correction methods for next-generation sequencing. Brief Bioinform. 2013;14:56–66.
16. Heo Y, Wu XL, Chen D, Ma J, Hwu WM. BLESS: bloom filter-based error correction solution for high-throughput sequencing reads. Bioinformatics. 2014;30:1354–62.
17. Kelley DR, Schatz MC, Salzberg SL. Quake: quality-aware detection and correction of sequencing errors. Genome Biol. 2010;11:R116. 18. Medvedev P, Scott E, Kakaradov B, Pevzner P. Error correction of
high-throughput sequencing datasets with non-uniform coverage. Bioinformatics. 2011;27:i137–41.
19. Ilie L, Fazayeli F, Ilie S. HiTEC: accurate error correction in high-throughput sequencing data. Bioinformatics. 2011;27:295–302.
20. Salmela L. Correction of sequencing errors in a mixed set of reads. Bioinformatics. 2010;26:1284–90.
21. Salmela L, Schroder J. Correcting errors in short reads by multiple alignments. Bioinformatics. 2011;27:1455–61.
22. Yin X, Song Z, Dorman K, Ramamoorthy A. PREMIER—PRobabilistic Error-correction using Markov Inference in Errored Reads.arXiv. 2013; 1302.0212.
23. Le HS, Schulz MH, McCauley BM, Hinman VF, Bar-Joseph Z. Probabilistic error correction for RNA sequencing. Nucleic Acids Res. 2013;41, e109. 24. Liu Y, Schroder J, Schmidt B. Musket: a multistage k-mer spectrum-based
error corrector for Illumina sequence data. Bioinformatics. 2013;29:308–15. 25. Lim EC, Muller J, Hagmann J, Henz SR, Kim ST, Weigel D. Trowel: a fast and
accurate error correction module for Illumina sequencing reads. Bioinformatics. 2014;30:3264–5.
26. Song L, Florea L, Langmead B. Lighter: fast and memory-efficient sequencing error correction without counting. Genome Biol. 2014;15:509. 27. Drezen E, Rizk G, Chikhi R, Deltel C, Lemaitre C, Peterlongo P, et al. GATB: Genome Assembly & Analysis Tool Box. Bioinformatics. 2014;30:2959–61. 28. Pevzner PA, Tang H, Waterman MS. An Eulerian path approach to DNA
fragment assembly. Proc Natl Acad Sci U S A. 2001;98:9748–53. 29. Clavijo BJ, Mapleson D. Kmer Analysis Toolkit: a short walkthrough. 1-21.
10-3-2013. Ref Type: Report
30. Chaisson MJ, Brinza D, Pevzner PA. De novo fragment assembly with short mate-paired reads: does the read length matter? Genome Res. 2009;19:336–46.
31. Zhao X, Palmer LE, Bolanos R, Mircean C, Fasulo D, Wittenberg GM. EDAR: an efficient error detection and removal algorithm for next generation sequencing data. J Comput Biol. 2010;17:1549–60.
32. Bloom BH. Space/time trade-offs in hash coding with allowable errors. Commun ACM. 1970;13:422–6.
33. Rizk G, Lavenier D, Chikhi R. DSK: k-mer counting with very low memory usage. Bioinformatics. 2013;29:652–3.
34. Deorowicz S, Kokot M, Grabowski S, Budaj-Grabysz A. KMC 2: fast and resource-frugal k-mer counting. Bioinformatics. 2015;31:1569–76. 35. Liu Y, Schmidt B, Maskell DL. CUSHAW: a CUDA compatible short read
aligner to large genomes based on the Burrows-Wheeler transform. Bioinformatics. 2012;28:1830–7.
36. Putze F, Sanders P, Singler J. Cache-, hash-, and space-efficient bloom filters. J Exp Algorithmics. 2010;14:4–18.
37. Huang W, Li L, Myers JR, Marth GT. ART: a next-generation sequencing read simulator. Bioinformatics. 2012;28:593–4.
38. Li H, Durbin R. Fast and accurate short read alignment with Burrows-Wheeler transform. Bioinformatics. 2009;25:1754–60.
39. Li H, Handsaker B, Wysoker A, Fennell T, Ruan J, Homer N, et al. The sequence alignment/map format and SAMtools. Bioinformatics. 2009;25:2078–9.
40. Chikhi R, Medvedev P. Informed and automated k-mer size selection for genome assembly. Bioinformatics. 2014;30:31–7.