Open Access
Research
Protein sequence and structure alignments within one framework
Gundolf Schenk, Thomas Margraf and Andrew E Torda*
Address: Centre for Bioinformatics, University of Hamburg, Bundesstr. 43, D-20146 Hamburg, Germany
Email: Gundolf Schenk - [email protected]; Thomas Margraf - [email protected]; Andrew E Torda* - [email protected]
* Corresponding author
Abstract
Background: Protein structure alignments are usually based on very different techniques to sequence alignments. We propose a method which treats sequence, structure and even combined sequence + structure in a single framework. Using a probabilistic approach, we calculate a similarity measure which can be applied to fragments containing only protein sequence, structure or both simultaneously.
Results: Proof-of-concept results are given for the different problems. For sequence alignments, the methodology is no better than conventional methods. For structure alignments, the techniques are very fast, reliable and tolerant of a range of alignment parameters. Combined sequence and structure alignments may provide a more reliable alignment for pairs of proteins where pure structural alignments can be misled by repetitive elements or apparent symmetries.
Conclusion: The probabilistic framework has an elegance in principle, merging sequence and structure descriptors into a single framework. It has a practical use in fast structural alignments and a potential use in finding those examples where sequence and structural similarities apparently disagree.
Background
Protein sequence alignments usually rely on a substitu-tion matrix. This reflects an evolusubstitu-tionary model and the probability that one type of residue has mutated to another [1,2]. Protein structures can also be aligned, but using a very different set of heuristics. Here, we propose a single framework which estimates the similarity of small protein fragments and can be applied to sequence, struc-ture or both simultaneously. The cost is that one has to discard the evolutionary model and replace it with one based purely on descriptive statistics. The benefit is that after the initial approximations, one has a rather rigorous measure of the similarity of pieces of proteins.
Just considering sequences, there is already a history working with different sized fragments. Firstly, one can think of conventional sequence alignment as working with fragments of length k, where k = 1. There is plenty of data to estimate the log-odds probabilities of 20 × 21/2 = 210 possible mutations [2]. Since sites in a protein are not independent, one could try to build a substitution matrix for k = 2 (dipeptides) [3,4]. Unfortunately, there is simply not enough data to estimate all of the 400 × 401/2 = 80 200 mutation rates [4,5]. The direct parameter estimation requires that all mutations be observed and, for reliable statistics, frequently observed.
Published: 1 April 2008
Algorithms for Molecular Biology 2008, 3:4 doi:10.1186/1748-7188-3-4
Received: 29 January 2008 Accepted: 1 April 2008 This article is available from: http://www.almob.org/content/3/1/4
© 2008 Schenk et al; licensee BioMed Central Ltd.
Proteins can also be aligned on the basis of their struc-tures, but there is no single popular methodology. Struc-ture reflects the arrangement of residues in space and is not a property of a single residue, so fragments with k = 1 will never be a good way to represent structural properties. Furthermore, of the mass of structural alignment methods [6-34], hardly any explicitly try to estimate log-odds prob-abilities as a similarity measure [35].
If one is willing to forget the evolutionary model, it should be possible to statistically measure fragment simi-larity, but based on what is observed, rather than requir-ing that everythrequir-ing possible be observed. Furthermore, one should be able to work with larger fragment lengths. A fragment could be characterised by some vector of prop-erties and the similarity of two such vectors would meas-ure the similarity of the fragments.
This has been done using physical or chemical properties which seem reasonable to a chemist [16,28], but we have aimed for a more objective statistical approach. In this work, long vectors are created, but they come from a prob-abilistic classification procedure. With Nc classes, a
frag-ment has a vector of probabilities that it is in class 1, 2, ...Nc. Given this vector for two such fragments, one can then ask, what is the probability that two fragments are in the same class ? Regardless of which class this is, similar fragments will have similar vectors of probabilities. The classification may not be perfect, so some fragments may have a non-zero probability of being in several classes. Even if one cannot say which class the fragments are in, similar fragments will have similar patterns of probabili-ties. This could be seen by the dot product of class mem-bership probability vectors and is formalised below (eq. 4). In this work, the classification comes from a maxi-mally parsimonious Bayesian classification of fragments. The number of classes is typically of the order of 102, the fragment length k = 6 and the amount of training data of the order of 106 observations.
The classes used here are sets of statistical distributions. These are multinomial Bernoulli distributions for the dis-crete (sequence) properties, Gaussian for the continuous (structural) properties and appropriate mixture models to combine sequence and structure. For example, one may have a pure structure classification based on Iand \ back-bone angles. One class within such a classification would have k pairs of Iand \distributions (one for each of the
k residues). Given some observation (fragment), one can can calculate its probability of being in a class by calculat-ing the probability of each I,\pair within the correspond-ing distributions that define the class and takcorrespond-ing the product of these probabilities.
Exactly the same process can be applied to sequence by using distributions of amino acid probabilities at each of the k sites within a class. Instead of Gaussian distribu-tions, one has 20-way probabilities at each site. Different classes will reflect the different probabilities of finding each amino acid at each position. Class membership of a fragment is simply calculated from the product of the probabilities of each amino acid occurring at each site within the class.
Finally, a classification can combine sequence and struc-ture distributions. Class membership of a fragment is just the product of probabilities of finding its sequence (dis-crete) and structure (continuous) descriptors within some class.
In practice, structure classes were based on bivariate Gaus-sian distributions in order to account for the strong corre-lation of I,\angles within residues.
Describing proteins by fragments is not new, but the phi-losophy here differs from most literature examples [36-39]. Firstly, the classification is probabilistic. A fragment is never a member of just one class. It may have 0.99 proba-bility of being in one class or it may have partial member-ship of a few classes. This is particularly important for robustness in comparison problems as described below. Secondly, the clustering does not rely on an explicit meas-ure of cluster similarity or distance. Instead, a model is constructed for the data and the likelihood of the model is optimised, with no need to explicitly consider distances between clusters. Finally, there are almost no preconcep-tions built into the clustering since we rely on unsuper-vised learning. If D-helices, E-strands or sequence patterns of hydrophobicity and hydrophilicity are found, it is a consequence of fitting a statistical model, not chemical preconceptions.
Methods
Data setsThe training data was a set of protein chains taken from the protein data bank (PDB) [40] such that no two mem-bers of the list had more than 50 % sequence identity [41]. After removing all chains with less than 40 residues and the few with unknown sequence, each possible overlap-ping fragment of length k was extracted. Fragments with any bond longer than 2 Å were discarded, leaving a set of just over 1.5 × 10⁶ fragments of length k d 6.
sequence identity, but were superimposable to 3 Å or less over at least 40 residues.
Classification
For classifications based only on sequence, each of the k
residues in each class was modelled by a 20-way categori-cal (multi-way Bernoulli) distribution. For classifications using backbone angles, I and \ of each residue were shifted into the periods of 0 to 2Sand -S/2 to 3S/2 respec-tively and treated as continuous descriptors. To allow for correlations between Iand \angles, they were modelled as bivariate Gaussian distributions of the form
where Tis the two-dimensional vector for a I, \pair and
PTis the corresponding vector of means. C is the covari-ance matrix, |C| the absolute value of the corresponding determinant and (T-PT)T is the transpose of (T-PT). Classi-fications using both sequence and structure used a mix-ture model with both the discrete and continuous distributions.
Given the distribution types, expectation maximization was used to find the model (parameter set) which maxim-ises the likelihood of the data [46]. One uses an initial guess for the distribution parameters and re-estimates the distribution properties. These estimates are then used to re-calculate the distribution properties and the process iterated until a maximum in terms of likelihood is reached. This is usually a local maximum, so the entire classification process is repeated many times.
Probability calculations were done in wurst [47], but the classifications were constructed using the implementation of Cheeseman and Stutz searching over both the distribu-tion parameters and number of classes [48]. This probabi-listic approach leads to some useful results. There is a formal method for estimating the relative probability of a classification. Firstly, one has to be able to calculate a probability P(fi cj) that a fragment i with its vector of attributes (angles, sequence) fi is a member of class cj. This depends on the product of the probability of seeing each of the m attributes in each of the distributions
where vj is the set of distribution properties describing class j. wj is the weight or probability associated with class j. The product runs over the m attributes and considers the
parameters vj,m which describe the m'th attribute in the j'th class. When calculating the probability of a fragment being in a class, eq 2 is applied to all classes and normal-ised so that the sum of probabilities is one. The class weights, w, reflect the importance of a class and are subject to the normalisation .
There are two more consequences. Firstly, there is a meas-ure for the relative success of a classification. The proba-bility of the database F of fragments depends on the probability of seeing all of the contributing fragments and the set V of all vj,m
and this introduces a strong element of parsimony. Any time new parameters are introduced, one brings in a mul-tiplicative factor less than one. Thus, any time a new class is introduced, the probability of the data set appears to decrease unless the new class is strongly supported by the data. This means the method is not very susceptible to overfitting and there is a tendency to find the minimal number of classes necessary to model the data.
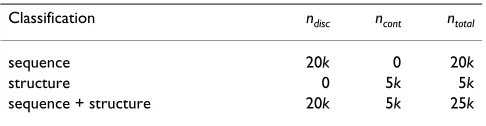
The search over parameters can then be summarised. For a given trial number of classes, distribution parameters were initially chosen randomly, optimized with expecta-tion minimizaexpecta-tion and the process repeated many times. This was then repeated so as to optimise the number of classes. For a fragment length of k, this leads to a number of parameters to optimize as shown in Table 1.
Similarity and alignments
Given a classification, it could then be used for the calcu-lation of alignments. If a classification is based on frag-ments of length k, then a protein with nr residues is broken into nr - k + 1 overlapping fragments. The class member-ship probabilities could then be assigned using eq 2. Given nc classes, a fragment is characterised by an nc -dimensional vector, so a protein can be seen as nr - k + 1 vectors in an nc-dimensional space. Given two such pro-tein fragments i and j, probably from different proteins, one can calculate a similarity measure sij
sij = pi·pj (4)
where pi denotes the vector of class probabilities for frag-ment i. If the two vectors have been normalised to unit
p( ) exp
θθ
= −(
θθ μμ
− θθ)
θθ μμ
θθ−
(
−)
⎛
⎝⎜ ⎞⎠⎟
( )
⎛⎝⎜ ⎞⎠⎟
1
2 1
2 2 1
2 C
C
T
π
(1)
P i j wj P fi m i cj j m
m
f v f v
(
)
=∏
(
, ∈ , ,)
(2)wj
j
∑
=1P F V wj P fi m i cj jm
m j
i
(
)
= ⎛(
∈)
⎝ ⎜ ⎜
⎞
⎠ ⎟ ⎟ ⎛
⎝ ⎜ ⎜
⎞
⎠ ⎟ ⎟
∏
∑
∏
, f ,vvector length, sij offers a rather rigorous measure of simi-larity in the range 0 to 1. These sij scores can be used as the elements of a similarity matrix suitable for calculating optimal pairwise alignments. The procedure can be applied to probabilities calculated from pure sequence or pure structure or combined sequence and structure. Unlike conventional scoring methods, eq. 4 does not relate to single sites or amino acids in a protein. The vector pi reflects k residues. This means that each entry sij in the score matrix reflects the contribution of k overlapping fragments, each of length k, so it is sensitive to an environ-ment of 2k - 1 residues. All alignments were calculated with wurst [47] using the Gotoh version [49] of the Smith and Waterman [50] algorithm and with parameters opti-mized as described below.
In order to optimize alignment parameters or measure the quality of alignments, a cost function was used which does not rely on any reference or ideal alignments. Given a pair of proteins "A" and "B" of known structure, they can be aligned by some method such as sequence alignment. From the alignment, a backbone model for "A" can be cal-culated using the coordinates of "B". The operational def-inition of alignment quality is a geometric measure for how close the model is to the original coordinates for "A". This can be calculated and averaged over the set of 2 902 protein pairs (described above) and done for both AB and BA pairs. The structural measure used is similar to the Q -value common in the folding literature which quantifies how many correct contacts are made within a protein [51,52]. First, one calculates the difference between CD based distance matrices [53,54], sometimes referred to as the distance matrix error (DME) [55,56]
where is the distance between CDi and CDj in the
native structure and is the corresponding distance
in the model and the summation runs over the Nres
aligned residues. Next, one defines a threshold, DMEcut =
4.0 Å, bearing in mind the typical CD- CDdistance between adjacent residues is 3.8 Å. Then one discards the elements where the two distance matrices are most different, until
DMEnat,model is less than or equal to DMEcut. The remaining
fraction of the distance matrix is f({rnat},{rmodel}) where
{rx} is the set of CDcoordinate vectors from molecule x. In
pseudocode, one can describe the process:
while (DMEnat,model >DMEcut) {
remove largest distance difference from CD distance matrix
recalculate DMEnat,model
f({rnat},{rmodel}) = fraction of distance difference
matrix remaining
}
To convert this to a penalty function, one notes that
f({rnat},{rmodel}) near 1 means structures are nearly
identi-cal, but below about 0.5, there is little similarity. This leads to the use of a smooth switching (sigmoidal) func-tion centred at 0.7. The final cost funcfunc-tion C is then
where a = 0.7 and b = 15 (an arbitrary choice for the shape of the sigmoid). The summation ran over all Npair = 2 902 protein pairs.
Given this measure of alignment quality, parameters were optimized with a simplex optimizer as previously described [57]. In this work, gap penalties were optimized as well as a constant zero-offset added to each scoring matrix. This is necessary since the scoring procedure pro-vides only positive numbers. This structure-based cost function was used as the measure of alignment quality (Figure 1) with 90 % of the data used for optimizing and 10 % reserved for testing.
The one psi-blast database search referred to below used a profile built with acceptance parameters orders of magni-tude more careful than default values [58]. 15 iterations were run, accepting homologues from the non-redundant
DME
N res N res r r
nat model ijnat ijmodel
i j Nres
,
( )
=
−
(
−)
⎛
⎝ ⎜ ⎜
⎞
⎠
<
∑
21
2
⎟⎟ ⎟ 1
2
(5)
rijnat
rijmodel
C
N pair e
b a f r r
i N
nati modeli pair
= − ⎛ +
⎝
⎜ ⎞
⎠ ⎟
−
(
)
(
)
−=
∑
11
1
1
G G
,
(6) Table 1: Parameters optimized during clustering
Classification ndisc ncont ntotal
sequence 20k 0 20k
structure 0 5k 5k
sequence + structure 20k 5k 25k
For the three types of classification and for fragments of length k, ndisc
protein sequence database with an e-value < 10-10, 10 iter-ations with the threshold set at 10-8 and 5 iterations with the threshold set at 2 × 10⁻⁵. This profile was then used as a query against sequences derived from protein data bank structures. For comparison, the default acceptance thresh-old is e-value < 5 × 10⁻³.
Results
Classification in general
Fragment classifications were attempted for pure sequence, pure structure and combined sequence+struc-ture and for fragment lengths up to k = 6. Larger values of
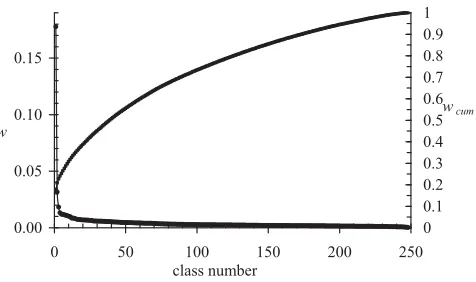
k may be desirable and there may be ample data (1.5 × 10⁶ data points), but the parameter search space becomes intractably large. One should note that one never finds the optimal classification or even the correct number of classes for any realistic problem. The next point is that it is not always meaningful to simply quote the number of classes. For fragment length k = 6 and a pure structural classification, a good classification was found with 248 classes, but this number alone is misleading. One can esti-mate the importance of each class by summing class membership probabilities over all data points and their partial class memberships. Figure 2 shows the importance of each class after ranking them. The first class accounts for nearly 18 % of the data and 80 % of the observations are accounted for by 125 classes. Although the numbers depend on the kind of classification, this property is clear. There may be a large number of classes, but their
impor-tance varies tremendously so the more common classes are well characterized.
Finally, one can see how well a classification reflects the original data. First, the training data was put into bins of 0.4 × 0.4 radians in the Iand \dimensions and treated as a probability distribution which could be compared against probabilities from a classification. The first meas-ure was the Kullback-Leibler divergence, DKL given by
where the superscript H denotes a histogram from the training data, C denotes the classification and pij is the probability for bin i,j. DKL is zero if two distributions are
the same and grows as they differ. Similarly, one can treat the two-dimensional histogram from the training data and probabilities from the classification as vectors and then calculate a dot product. This will equal 1 if the two distributions are the same.
Using the same classification as above, DKL = 0.22, whereas a random distribution gives DKL = 2.01. Labelling
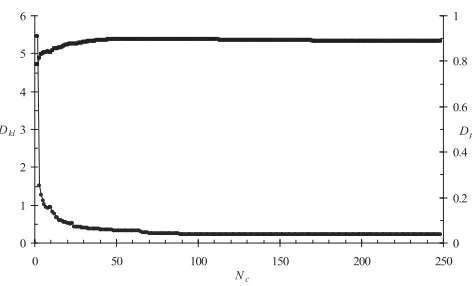
the dot product as Dp, we find Dp = 0.89 for the classifica-tion, but 0.26 for a random distribution. Figure 3 shows how these values depend on the number of classes consid-ered. Most of the information is given by about the 50 most important classes. By eye, the details are different to Figure 2, but the trend is clear. A classification may have 300 classes, but some tens of classes explain the bulk of the data. The rest of the classes reflect less frequent protein
D p pij
H
pijC
KL ijH
i j
=
∑
ln,
(7)
Number of classes
Figure 2
Number of classes. The relative weight, w, or importance of each class is shown as well as the cumulative probability,
wcum accounted for by the classes taken from a pure struc-ture classification with k = 6. Lines connecting the points have no meaning, but are used to guide the eye.
Z
ZFXP
Alignment quality from different methods
Figure 1
Alignment quality from different methods. Each bar shows the value of the cost function (eq. 6) for alignments after optimizing gap penalties and zero-offset added to score matrices. Random: score matrices filled with gaussian distrib-uted random numbers; blosum : a blosum62 matrix, seq frag: fragments from a pure sequence classification, struct frag: fragments from a pure structural classification; seq+struct frag: fragments from a combined sequence and structure classification.
motifs. Numerically, the classification behaves more like one with only tens of classes. The small prior weights (wi
in eq. 2) mean that these classes rarely come into play.
Given these overall properties, one can consider some example results from each type of classification.
Sequence classification and alignment
This type of classification is included as a matter of princi-ple, rather than practical use. There are, however, two rea-sons why it may have been of interest. Firstly, if one believes in the importance of sequence motifs, this could be a method for finding them. Practically all motif finding methods use some form of supervised learning (training from known data) [59-61]. The approach in this classifi-cation is simply to look for statistically significant patterns without any knowledge of function. Secondly, one might hope that patterns of amino acid probabilities are a sequence signal which would be preserved over longer evolutionary time-scales than simple sequence similarity. In this case, one could align protein sequences using the similarity based on eq 4.
First we consider whether there are some statistical pat-terns which are so strong and distinct that they will be found by this kind of unsupervised learning/classifica-tion. The answer is yes, but it is of no practical use. For fragments of length k = 6, the most statistically unusual class, as measured by the cross entropy, is HHHHHH. The second most unusual class was another common sequence tag. The other classes may be interpreted in terms of chemical properties, but it is more sensible to refrain from over-interpretation. This kind of unsuper-vised learning is not the best way to recognise biologically interesting sequence motifs.
Next, we briefly consider the question of sequence align-ment using a score matrix based on similarities of class probability vectors (eq. 4). With the set of 2 902 distantly related protein pairs, alignments were calculated, models constructed and the alignment quality measured as described under Methods. For comparison, the same pro-cedure was done with conventional pair-wise alignments based on a blosum62 substitution matrix [2]. The same optimization of gap penalties and matrix zero level was then calculated after filling score/alignment matrices with gaussian distributed random numbers. Figure 1 compares the results from the different approaches. The cost func-tion (eq. 6) is based on the similarity of distance matrices (eq. 5), so even with random elements in the score matrix, the score will not be zero due to small fragments of similar structure. On this set of remote homologues, the more expensive method does not produce better alignments than those using a conventional substitution matrix. Although it is technically interesting to find a genuinely new scoring scheme for sequence alignments, it is more useful to consider this methodology in a context where it seems to be very effective.
Structure alignment
Unlike a pure sequence-based classification, the pure structure-based classification leads to a directly useful application (structural alignment) and often easily inter-pretable results. We concentrate on results from a classifi-cation with fragment length k = 6 and 248 classes. Not surprisingly, the three most populated classes are recog-nisable classic secondary structure, but soon one reaches classes which may or may not have literature names. The practical application of this classification is more interest-ing than a reinvestigation of protein structural motifs. When the vectors in eq. 4 are based only on structural properties, they form the basis of a swift and robust pro-tein structure alignment method, available as a web serv-ice [62] and fast enough to search a set of 17 000 representative protein folds in minutes.
Firstly, one can look at the very gross average behaviour and compare the quality of the alignments with those from the same methodology using sequences or conven-tional sequence alignment (previous section). Figure 1 shows the value of the testing function from the optimiza-tion described above (2 902 remote protein pairs) and the bar labelled "struct frag" refers to the structure-based alignment with this methodology. As expected, when aligning pairs of proteins with weak sequence homology, a structure based method performs much better. One may also note that the bars never go below -0.7. This reflects the fact that one is working with protein pairs whose structures are often somewhat dissimilar and the function only approaches -1 as structures become identical.
Quality of classification
Figure 3
Quality of classification. Kullbach-Leibler divergence, Dkl
(circles) and dot product Dp (squares) as a function of Nc, the number of classes in a classification. Lines connecting the points have no meaning and are only to guide the eye.
1F
'NO
One can look at average performance, but when compar-ing protein alignments, it may be that there are many methods which perform similarly, even with approaches based on methods ranging from local distance informa-tion mean field methods [6-35,63-66]. In this case, it is more important to look for examples which characterise a method and where the results reflect the peculiarities of a technique.
To make the point, we consider two extreme examples, one of which may suggest a weakness in the implementa-tion here. The first example is 1qys. This was deliberately constructed so as to have a unique topology [67]. By design, it should have no structural homologues. Searches with two example reputable servers [23,44] find some similar structures with alignments of 71 or less residues. Searching with this methodology finds the same hits, but also an interesting candidate similarity ranked fourth in its list. Figure 4 shows the 90 aligned residues from 1qys to 1jtk. The colour coding is such that aligned residues in the two structures have the same colour. The potential problem here is clear. The two left-most (C-terminal) E -strands in protein 1jtk are oriented the wrong way. This alignment only requires a gap of length two. A partisan could argue that this is a significant similarity. One could also argue that since the arrangement of a E-strand is wrong, the result should be thrown away.
Secondly one can consider a protein with little regular sec-ondary structure. The protein data bank was searched for a chain with more than 100 residues, whose structure was
determined by X-ray crystallography and with less than 7 % annotated D-helix or E-strand. The first protein found was 1kct [68], an D-1-antitrypsin at 3.5 Å resolution, par-tially shown on the left of Figure 5. Many homologues of this protein can be found by a simple sequence search, but this structure seems to be so distorted, that a method based on recognising regular secondary structure finds no similar structures in the protein data bank [23]. Even a method based on distance matrix similarities does not find any significant structural homologues [8]. Scanning the protein data bank with 1kct and this probabilistic
Putative homologue of 1qys
Figure 4
Putative homologue of 1qys. Aligned residues from 1qys and 1jtk superimposed. Aligned residues have the same col-our. Drawn with molscript [83].
1qys
1jtk
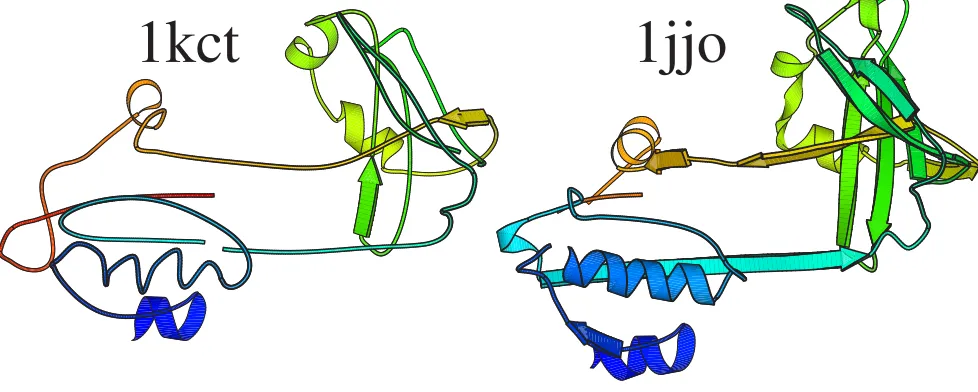
Structural alignment of 1kct and 1jjo
Figure 5
Structural alignment of 1kct and 1jjo. Aligned residues as calculated by the classification probability vector method are shown. Of the 374 residues present in the 1kct coordinates, 186 are aligned to sites in 1jjo chain C with 20 % sequence iden-tity. Aligned residues have the same colour.
methodology yields a series of anti-trypsins, the most remote of which (14th rank) is 1jjo shown on the right hand side of the figure. The similarity by eye is clear, but the irregularity in the query structure renders it a difficult case for some programs. Obviously, one example does not mean the code described here is in any sense better than other structure similarity finding programs. It is a deliber-ately chosen extreme example which highlights different properties of this methodology.
Combined sequence and structure alignment
We have considered alignments based on class probability vectors where the original descriptors came from protein sequence (Bernoulli distributions) or structure (Gaussian distributions). The methodology implied by eq. 2 and 3 can also be applied to the mixture model including both sequence and structure information. This means one can calculate true combined sequence and structure align-ments. Firstly, it is easy to see why this approach will differ from either a pure sequence or structure method. To make the point, Figure 6 shows some classes from a classifica-tion with fragment length k = 6 and 267 classes. The struc-tural fragments were constructed using the Iand \angles from each of the 6 bivariate Gaussian distributions in the class. The residue probabilities in the bar plots are scaled relative to background probabilities, so a 1/4 high bar at a position in a fragment would mean that the probability of an amino acid type simply follows the background distri-bution.
The three classes with the highest statistical weight are structurally indistinguishable D-helical, but differ in their sequence profile. The second and third classes show the periodicity of amphipathic helices. Two example E-strand classes are shown which again differ in their sequence pro-pensities. The last example (class 15) at the bottom of the plot shows a different property. The amino acid probabil-ities do not differ too much from background probabili-ties, except at position 4, which almost has to be a glycine. Looking at the fragment, it is clear that this is part of a clas-sic, well characterised turn [69,70].
These fragments from the combined mixture model were also used for alignments and the gross performance is given by the bar in Figure 1 labelled "seq+struct frag". Averaging over the 5 804 models, there seems to be little difference between the combined method and pure struc-tural alignments. Of course, there are many differences in individual pairs, especially where similarity is very weak. As an example, we searched for a case which is slightly counter to what one would expect. Usually, one expects protein sequences to diverge faster than structure and this is the basis for discussions on surprising protein similari-ties [11]. Given the methodology available here, we looked for an example in the other direction – a pair of
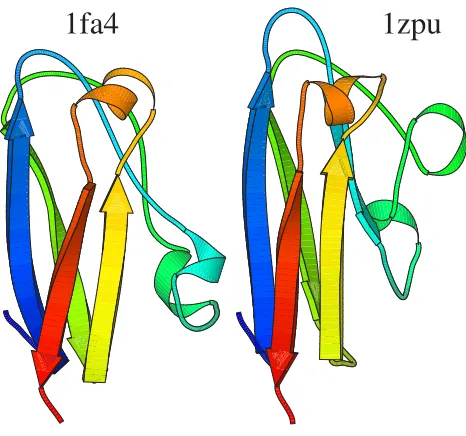
proteins where the structural similarity score is poor, but an alignment using sequence and structure descriptors scored well. An example combined alignment is shown in Figure 7. No pure structural alignment is shown. Using either 1fa4 or 1zpu (chain A) as a search model, neither 1zpu or 1fa4 was found as a structural homologue with four servers [11,14,23,42-44,71]. A pure structure-based search using our code found no significant hit and explic-itly calculating an alignment aligned 90 residues (2 single gaps) but with a root mean square difference calculated at CDatoms of 16.5 Å.
A combined sequence to structure alignment resulted in the superposition of Figure 7. Within the 89 aligned resi-dues there is only 13 % sequence identity and it only cov-ers about 17 % of the 529 residues from chain A of 1zpu. It would be reasonable to doubt its significance. In fact, both are copper containing proteins involved in redox chemistry, albeit one from algae [72] the other from yeast [73]. Interestingly, it is possible to find a very remote sequence connection between the two proteins. Using the sequence of 1fa4 as a query, a sequence profile was built using the non-redundant protein sequence database and used to search against protein data bank sequences [58]. This finds 1zpu as a potential homologue with a very poor
e-value (0.02). By itself, this would also not be considered significant. Most persuasively, the iterated sequence search from psi-blast aligns residues 34 to 123 of 1zpu and the combined sequence/structure alignment using our code aligns almost exactly the same stretch (residues 37 to 124). This appears to be simply an example of nor-mal divergent evolution, but it is an example of where structure has diverged to the point where a simple struc-tural superposition is not conclusive.
Again one should be clear that this kind of result is not in its own significant. When one is dealing with remote homologues, different programs will produce different results. With enough time, one would be able to find alignments which are found with other codes, but missed or miscalculated using our methods. The interesting point is that there is one method and one scoring scheme which can operate on both protein sequences and structures.
Discussion
Fragment classes from combined sequence and structure
Figure 6
Fragment classes from combined sequence and structure. Class is the class number, ranked by weight, wt: the statisti-cal weight of the class. Bar plots show the prevalence of residue types at each position, where hydrophobic is the set of resi-dues: l, i, m, v, f, y, c, w and polar is d, e, n, k, s, q, t, r, h, a.
!
"
#
#
#
##
$
%
#
#
#
##
$
#
&
'
&
('&(
&
two future possibilities. Firstly, it is accepted dogma that protein sequences evolve faster than structure, so one can detect similarities even when sequence homology is not significant [74]. With the tools here, it is relatively easy to search for cases where structural alignment is weak, but combined alignment appears to be significant. Secondly, there is the general question of remote homology detec-tion. Protein structure searches are an essential tool when proteins have diverged so much that sequence similarity is, by itself, not significant. The question is whether com-bining all available descriptors will usually yield even bet-ter results. Although we give one example above (1fa4 and 1zpu) it needs more testing and the collection of new benchmarks to find if it is useful and if so, in what regime of similarity. From one point of view, one should use all available information (sequence as well as structure). From another point of view, this may not be true. Sequence mutations are often modelled as random events or walks through possible sequences [75,76]. If two sequences have diverged such that there is little sequence similarity, adding sequence information will introduce noise as well as signal.
The methodology is in most senses rather unusual and there are some assumptions and limitations. If one feels the underlying statistical models are a good representa-tion of protein data, then the rest of the procedure is com-pletely justified. Of course the underlying models are not perfect. Gaussian distributions are mainly chosen for
con-venience and one knows that there are some correlations which could be included. The distributions in this work accounted for I, \correlations within a residue, but test calculations on smaller data sets suggest that in a small number of classes there are correlations between neigh-bouring residues which could be accounted for. The prob-lem is that there are currently 18 parameters per class in a pure structure classification with k = 6. Using a full covar-iance matrix results in 27 parameters per class.
There are already many protein fragment classifications in the literature, but usually with a different philosophy. Generally, these use a structure classification and then see which sequence patterns fit to each structure motif (or vice versa). They also require some similarity measure between clusters [35-38,54,77-81]. The methodology here is based on a mixture model which can treat all these properties simultaneously and this leads to a very different kind of result. As shown in Figure 6, a single structural motif can accommodate different sequence patterns. These are detected in this work since all the descriptors are consid-ered simultaneously. Figure 6 shows half a dozen classes, but if one were to look through the other 261 classes, there are numerous examples of different sequence pat-terns fitting to a basic structural unit.
This raises the question as to which is most important when sequence and structure are combined. Unfortu-nately, there is no simple answer since it varies from class to class and site to site. As shown in Figure 6, a class may have relatively flat distributions for amino acids or some-times a particular site has a distribution far from back-ground probability. In crude terms, summing over all observations and all classes, the structural descriptors are about 3 1/2 times more important than the sequence descriptors in terms of discriminating.
The next major difference compared to other classification schemes is the application. Usually this is connected to prediction. If one has a sequence clustering one can collect structure properties to make structural predictions or vice versa. The Bayesian classification scheme used in this work has been used for this purpose [47], but not in this work. Here, we are interested in a single kind of similarity meas-ure which operates in different contexts.
The results (or the lack thereof) for pure sequence align-ment make it clear that this methodology will not displace conventional sequence-based methods. The results for structure and combined sequence and structure are far more promising. There are several reasons. Firstly, there are no preconceptions of regular protein structure. If some motif is statistically described it is part of the model. There is little preference for strands, helices or recognized turns over other motifs. Next, the method handles unusual
Simultaneous sequence and structure alignment of 1fa4 and 1zpu
Figure 7
Simultaneous sequence and structure alignment of 1fa4 and 1zpu. Residues 22 to 105 from 1fa4 aligned to res-idues 58–145 of 1zpu (chain A). Aligned resres-idues have the same colour.
structures. When faced with a fragment which has never been seen before, it will not be placed into any particular class. It will have some probability of being in a few classes. Any similar fragment, even if it has never been observed before, will have a similar set of class member-ship probabilities and will be recognized as similar. Next, the procedure is rather free of thresholds. The probability of similarity (eq. 4) runs smoothly between 0 and 1. There are no absolute matching steps necessary. Finally, each residue in a protein is involved in 2k - 1 overlapping frag-ments. In this work, this means that each element in a similarity matrix reflects the properties of 11 residues. These factors are probably why the method is rather toler-ant of poor structures such as the example in Figure 5.
The procedure is also rather swift. To make database searches fast, class probability vectors for representative chains can be precalculated. This leaves the normal quad-ratic running time for the dynamic programming step. Compared to simple sequence alignment, this is slower by a constant factor since the normal table lookup from a substitution matrix is replaced by a dot product calcula-tion.
The approach may be useful for pure structure alignment, but its performance needs to be demonstrated quantita-tively in terms of accuracy and speed, rather than by the proof-of-concept examples given here. The main advance is that one can mix sequence and structure on equal prob-abilistic terms without any ad hoc weighting of the terms. Since the methodology is fast enough for phylogenetic calculations, we are now interested in finding examples where the different approach yield different results. It remains to be seen which is more reliable or at least per-suasively believable.
Conclusion
With modest assumptions, it is possible to combine pro-tein sequence and structure in one framework for propro-tein alignment and comparison. Larger scale testing needs to be done to estimate its significance. The server is available for structure comparisons [62] and all software is free for download [82].
Competing interests
The author(s) declare that they have no competing inter-ests.
Authors' contributions
All authors have read and approved the manuscript and contributed equally to this work.
References
1. Dayhoff M, Schwartz R, Orcutt B: A model of evolutionary change in proteins. In Atlas of Protein Sequence and StructureVolume
5. Edited by: Dayhoff M. Washington D.C.: National Biomedical Research Foundation; 1978:345-358.
2. Henikoff S, Henikoff JG: Amino acid substitution matrices from protein blocks. Proc Natl Acad Sci USA 1992, 89:10915-10919. 3. Jung J, Lee B: Use of residue pairs in protein
sequence-sequence and sequence-sequence-structure alignments. Protein Sci 2000, 9:1576-1588.
4. Gonnet GH, Cohen MA, Benner SA: Analysis of Amino-Acid Sub-stitution During Divergent Evolution – the 400 by 400 Dipep-tide Substitution Matrix. Biochem Biophys Res Commun 1994, 199:489-496.
5. Crooks GE, Green RE, Brenner SE: Pairwise alignment incorpo-rating dipeptide covariation. Bioinformatics 2005, 21:3704-3710. 6. Zuker M, Somorjai RL: The alignment of protein structures in
three dimensions. Bull Math Biol 1989, 51:55-78.
7. Russell RB, Barton GJ: Multiple protein sequence alignment from tertiary structure comparison. Proteins 1992, 14:309-323. 8. Holm L, Sander C: Protein-Structure Comparison by
Align-ment of Distance Matrices. J Mol Biol 1993, 233:123-138. 9. Subbiah S, Laurents DV, Levitt M: Structural similarity of
DNA-binding domains of bacteriophage repressors and the globin core. Curr Biol 1993, 3:141-148.
10. Alexandrov NN: SARFing the PDB. Protein Eng 1996, 9:727-732. 11. Gibrat J-F, Madej T, Bryant SH: Surprising similarities in
struc-ture comparison. Curr Opin Struct Biol 1996, 6:377-385.
12. Orengo CA, Taylor WR: SSAP: Sequential structure alignment program for protein structure comparison. Method Enzymol
1996, 266:617-635.
13. Suyama M, Matsuo Y, Nishikawa K: Comparison of protein struc-tures using 3D profile alignment. J Mol Evol 1997, 44:S163-173. 14. Shindyalov IN, Bourne PE: Protein structure alignment by incre-mental combinatorial extension (CE) of the optimal path.
Protein Eng 1998, 11:739-747.
15. Holm L, Park J: DaliLite workbench for protein structure com-parison. Bioinformatics 2000, 16:566-567.
16. Jung J, Lee B: Protein structure alignment using environmental profiles. Protein Eng 2000, 13:535-543.
17. Lackner P, Koppensteiner WA, Sippl MJ, Domingues FS: ProSup: a refined tool for protein structure alignment. Protein Eng 2000, 13:745-752.
18. Ortiz AR, Strauss CEM, Olmea O: MAMMOTH (Matching molecular models obtained from theory): An automated method for model comparison. Protein Sci 2002, 11:2606-2621. 19. Shatsky M, Nussinov R, Wolfson HJ: Flexible protein alignment
and hinge detection. Proteins 2002, 48:242-256.
20. Blankenbecler R, Ohlsson M, Peterson C, Ringnér M: Matching pro-tein structures with fuzzy alignments. Proc Natl Acad Sci USA
2003, 100:11936-11940.
21. Kawabata T: MATRAS: a program for protein 3D structure comparison. Nucl Acids Res 2003, 31:3367-3369.
22. Ilyin VA, Abyzov A, Leslin CM: Structural alignment of proteins by a novel TOPOFIT method, as a superimposition of com-mon volumes at a topomax point. Protein Sci 2004, 13:1865-1874.
23. Krissinel E, Henrick K: Secondary-structure matching (SSM), a new tool for fast protein structure alignment in three dimen-sions. Acta Cryst D 2004, 60:2256-2268.
24. Ochagavia ME, Wodak H: Progressive combinatorial algorithm for multiple structural alignments: Application to distantly related proteins. Proteins 2004, 55:436-454.
25. Shapiro J, Brutlag D: FoldMiner and LOCK 2: protein structure comparison and motif discovery on the web. Nucl Acids Res
2004, 32:W536-W541.
26. Carpentier M, Brouillet S, Pothier J: YAKUSA: A fast structural database scanning method. Proteins 2005, 61:137-151. 27. Chen L, Zhou T, Tang Y: Protein structure alignment by
deter-ministic annealing. Bioinformatics 2005, 21:51-62.
28. Chen Y, Crippen GM: A novel approach to structural alignment using realistic structural and environmental information.
Protein Sci 2005, 14:2935-2946.
29. Zhang Y, Skolnick J: TM-align: a protein structure alignment algorithm based on the TM-score. Nucl Acids Res 2005, 33:2302-2309.
31. Konagurthu AS, Whisstock JC, Stuckey PJ, Lesk AM: MUSTANG: A multiple structural alignment algorithm. Proteins 2006, 64:559-574.
32. Lisewski AM, Lichtarge O: Rapid detection of similarity in pro-tein structure and function through contact metric dis-tances. Nucl Acids Res 2006, 34:E152.
33. Taubig H, Buchner A, Griebsch J: PAST: fast structure-based searching in the PDB. Nucl Acids Res 2006, 34:W20-W23. 34. Oldfield TJ: CAALIGN: a program for pairwise and multiple
protein-structure alignment. Acta Cryst D 2007, 63(4):514-525. 35. Friedberg I, Harder T, Kolodny R, Sitbon E, Li ZW, Godzik A: Using an alignment of fragment strings for comparing protein structures. Bioinformatics 2007, 23:E219-E224.
36. Camproux AC, Tuffery P, Chevrolat JP, Boisvieux JF, Hazout S: Hid-den Markov model approach for iHid-dentifying the modular framework of the protein backbone. Protein Eng 1999, 12:1063-1073.
37. Hunter CG, Subramaniam S: Protein fragment clustering and canonical local shapes. Proteins 2003, 50:580-588.
38. Sander O, Sommer I, Lengauer T: Local protein structure predic-tion using discriminative models. BMC Bioinformatics 2006, 7:14. 39. Simons KT, Ruczinski I, Kooperberg C, Fox BA, Bystroff C, Baker D: Improved recognition of native-like protein structures using a combination of sequence-dependent and sequence-inde-pendent features of proteins. Proteins 1999, 34:82-95.
40. Berman HM, Westbrook J, Feng Z, Gilliland G, Bhat TN, Weissig H, Shindyalov IN, Bourne PE: The Protein Data Bank. Nucl Acids Res
2000, 28:235-242.
41. Li WZ, Jaroszewski L, Godzik A: Clustering of highly homolo-gous sequences to reduce the size of large protein databases.
Bioinformatics 2001, 17:282-283.
42. Holm L, Sander C: The FSSP database of structurally aligned protein fold families. Nucl Acids Res 1994, 22:3600-3609. 43. Holm L, Sander C: The FSSP database: Fold classification
based on structure structure alignment of proteins. Nucl Acids Res 1996, 24:206-209.
44. Holm L, Sander C: Dali/FSSP classification of three-dimen-sional protein folds. Nucl Acids Res 1997, 25:231-234.
45. Holm L, Sander C: Touring protein fold space with dali/FSSP.
Nucl Acids Res 1998, 26:316-319.
46. Dempster AP, Laird NM, Rubin DB: Maximum likelihood from incomplete data via the EM algorithm. J R Stat Soc B 1977, 39:1-38.
47. Wurst server [http://www.zbh.uni-hamburg.de/wurst]
48. Cheeseman P, Stutz J: Bayesian Classification (Autoclass): The-ory and Results. In Advances in Knowledge Discovery and Data Mining
Edited by: Fayyad U, Piatetsky-Shapiro G, Smyth P, Uthurusamy R. Menlo Park: The AAAI Press; 1995:61-83.
49. Gotoh O: An improved algorithm for matching biological sequences. J Mol Biol 1982, 162:705-708.
50. Smith TF, Waterman MS: Identification of Common Molecular Subsequences. J Mol Biol 1981, 147:195-197.
51. Onuchic JN, Luthey-Schulten Z, Wolynes PG: Theory of protein folding: The energy landscape perspective. Annu Rev Phys Chem
1997, 48:545-600.
52. Goldstein RA, Luthey-Schulten ZA, Wolynes PG: Protein tertiary structure recognition using optimized Hamiltonians with local interactions. Proc Natl Acad Sci USA 1992, 89:9029-9033. 53. Levitt M: Molecular dynamics of native protein. II. Analysis
and nature of motion. J Mol Biol 1983, 168:621-657.
54. Rooman MJ, Rodriguez J, Wodak SJ: Automatic definition of recurrent local structure motifs in proteins. J Mol Biol 1990, 213:327-336.
55. Crippen GM: Easily searched protein folding potentials. J Mol Biol 1996, 260:467-475.
56. Havel TF: The sampling properties of some distance geome-try algorithms applied to unconstrained polypeptide chains: a study of 1830 independently computed conformations.
Biopolymers 1990, 29:1565-1585.
57. Russell A, Torda AE: Protein sequence threading – averaging over structures. Proteins 2002, 47:496-505.
58. Altschul SF, Madden TL, Schaffer AA, Zhang J, Zhang Z, Miller W, Lip-man DJ: Gapped BLAST and PSI-BLAST: a new generation of protein database search programs. Nucl Acids Res 1997, 25:3389-3402.
59. Attwood TK, Blythe MJ, Flower DR, Gaulton A, Mabey JE, Maudling N, McGregor L, Mitchell AL, Moulton G, Paine K, Scordis P: PRINTS and PRINTS-S shed light on protein ancestry. Nucl Acids Res
2002, 30:239-241.
60. Liu J, Rost B: Domains, motifs and clusters in the protein uni-verse. Curr Opin Chem Biol 2003, 7:5-11.
61. Sigrist CJA, Cerutti L, Hulo N, Gattiker A, Falquet L, Pagni M, Bairoch A, Bucher P: PROSITE: A documented database using pat-terns and profiles as motif descriptors. Brief Bioinform 2002, 3:265-274.
62. Salami: Protein structure similarity searches based on clas-sification probability vectors [http://www.zbh.uni-hamburg.de/ salami]
63. Guyon F, Camproux AC, Hochez J, Tuffery P: SA-Search: a web tool for protein structure mining based on a Structural Alphabet. Nucl Acids Res 2004, 32:W545-W548.
64. Koehl P: Protein structure similarities. Curr Opin Struct Biol 2001, 11:348-353.
65. Levine M, Stuart D, Williams J: A Method for the Systematic Comparison of the 3-Dimensional Structures of Proteins and Some Results. Acta Cryst A 1984, 40:600-610.
66. Martinez L, Andreani R, Martinez JM: Convergent algorithms for protein structural alignment. BMC Bioinformatics 2007, 8:306. 67. Kuhlman B, Dantas G, Ireton GC, Varani G, Stoddard BL, Baker D:
Design of a novel globular protein fold with atomic level accuracy. Science 2003, 302:1364-1368.
68. Song HK, Lee KN, Kwon KS, Yu MH, Suh SW: Crystal structure of an uncleaved alpha 1-antitrypsin reveals the conformation of its inhibitory reactive loop. FEBS Lett 1995, 377:150-154. 69. Wilmot CM, Thornton JM: Analysis and Prediction of the
Differ-ent Types of E-Turn in Proteins. J Mol Biol 1988, 203:221-232. 70. Wilmot CM, Thornton JM: E-Turns and their distortions: a
pro-posed new nomenclature. Protein Eng 1990, 3:479-493. 71. Shindyalov IN, Bourne PE: A database and tools for 3-D protein
structure comparison and alignment using the Combinato-rial Extension (CE) algorithm. Nucl Acids Res 2001, 29:228-229. 72. Ma L, Jorgensen AMM, Sorensen GO, Ulstrup J, Led JJ: Elucidation of the Paramagnetic R 1 Relaxation of Heteronuclei and Pro-tons in Cu(II) Plastocyanin from Anabaena variabilis. J Am Chem Soc 2000, 122:9473-9485.
73. Taylor AB, Stoj CS, Ziegler L, Kosman DJ, Hart PJ: The copper-iron connection in biology: Structure of the metallo-oxidase Fet3p. Proc Natl Acad Sci USA 2005, 102:15459-15464.
74. Holm L, Sander C: Mapping the protein universe. Science 1996, 273:595-602.
75. Ewens WJ, Grant GR: Statistical methods in bioinformatics New York: Springer-Verlag; 2001.
76. Jukes TH, Cantor CR: Evolution of protein molecules. In Mam-malian protein metabolism Edited by: Munro HN. New York: Academic Press; 1969:21-123.
77. Camproux AC, Gautier R, Tuffery P: A hidden Markov model derived structural alphabet for proteins. J Mol Biol 2004, 339:591-605.
78. Camproux AC, Tuffery P, Buffat L, Andre C, Boisvieux JF, Hazout S: Analyzing patterns between regular secondary structures using short structural building blocks defined by a hidden Markov model. Theor Chem Account 1999, 101:33-40.
79. Dong QW, Wang XL, Lin L: Methods for optimizing the struc-ture alphabet sequences of proteins. Comput Biol Med 2007, 37:1610-1616.
80. Simons KT, Kooperberg C, Huang E, Baker D: Assembly of protein tertiary structures from fragments with similar local sequences using simulated annealing and Bayesian scoring functions. J Mol Biol 1997, 268:209-225.
81. Tendulkar AV, Ogunnaike B, Wangikar PP: Protein local confor-mations arise from a mixture of Gaussian distributions. J Bio-sci 2007, 32:899-908.
82. Wurst [http://backpan.perl.org/authors/id/W/WU/WURST/] 83. Kraulis PJ: MOLSCRIPT: a program to produce both detailed
and schematic plots of protein structures. J Appl Crystallogr