M E T H O D O L O G Y
Open Access
Joint analysis of multiple high-dimensional
data types using sparse matrix
approximations of rank-1 with applications
to ovarian and liver cancer
Gordon Okimoto
1*†, Ashkan Zeinalzadeh
1†, Tom Wenska
2†, Michael Loomis
1†, James B. Nation
3, Tiphaine Fabre
4,
Maarit Tiirikainen
1, Brenda Hernandez
1, Owen Chan
1, Linda Wong
1and Sandi Kwee
5* Correspondence:gokimoto@cc. hawaii.edu
†Equal contributors 1
University of Hawaii Cancer Center, 701 Ilalo Street, Honolulu, HI 96813, USA
Full list of author information is available at the end of the article
Abstract
Background:Technological advances enable the cost-effective acquisition of Multi-Modal Data Sets(MMDS) composed of measurements for multiple, high-dimensional data types obtained from a common set of bio-samples. The joint analysis of the data matrices associated with the different data types of a MMDS should provide a more focused view of the biology underlying complex diseases such as cancer that would not be apparent from the analysis of a single data type alone. As multi-modal data rapidly accumulate in research laboratories and public databases such asThe Cancer Genome Atlas(TCGA), the translation of such data into clinically actionable knowledge has been slowed by the lack of computational tools capable of analyzing MMDSs. Here, we describe theJoint Analysis of Many Matrices by ITeration(JAMMIT) algorithm that jointly analyzes the data matrices of a MMDS using sparse matrix approximations of rank-1.
Methods:The JAMMIT algorithm jointly approximates an arbitrary number of data matrices by rank-1 outer-products composed of“sparse”left-singular vectors (eigen-arrays) that are unique to each matrix and a right-singular vector (eigen-signal) that is common to all the matrices. The non-zero coefficients of the eigen-arrays identify small subsets of variables for each data type (i.e., signatures) that in aggregate, or individually, best explain a dominant eigen-signal defined on the columns of the data matrices. The approximation is specified by a single“sparsity”parameter that is selected based on false discovery rate estimated by permutation testing. Multiple signals of interest in a given MDDS are sequentially detected and modeled by iterating JAMMIT on“residual” data matrices that result from a given sparse approximation.
Results:We show that JAMMIT outperforms other joint analysis algorithms in the detection of multiple signatures embedded in simulated MDDS. On real multimodal data for ovarian and liver cancer we show that JAMMIT identified multi-modal signatures that were clinically informative and enriched for cancer-related biology.
Conclusions:Sparse matrix approximations of rank-1 provide a simple yet effective means of jointly reducing multiple, big data types to a small subset of variables that characterize important clinical and/or biological attributes of the bio-samples from which the data were acquired.
(Continued on next page)
(Continued from previous page)
Keywords:Generalized singular value decomposition, Joint data analysis, Ovarian cancer, Hepatocellular carcinoma, The Cancer Genome Atlas, LASSO, Sparse signal detection
Abbreviations:2TC model, 2-Tissue Compartmental model; AUROC, Area Under the ROC; BEST, Bet on Sparsity Principle; CCA, Canonical Correlation Analysis; ESM, Eigen-Survival Model; FDR, False Discovery Rate; GVSD, Generalized Singular Value Decomposition; HCC, HepatoCellular Carcinoma; ICC, Intra-hepatic CholangioCarcinoma; IPA, Ingenuity Pathway Analysis; JAMMIT, Joint Analysis of Many Matrices by ITeration; JIVE, Joint and Individual Variation Explained; LASSO, Least Absolute Shrinkage and Selection Operator; LOOCV, Leave-One-Out Cross-Validation); MMDS, Muti-Modal Data Set; MMSIG, Multi-Modal Signature; mRNA, messenger RNA; PET/CT, Positron Emission Tomography/ Computed Tomography); PLS, Partial Least Squares; ROC, Receiver Operater Characteristic; SNR, Signal-to-Noise Ratio; SOI, Signal of Interest; TCGA, The Cancer Genome Atlas
Background
Advances in array technology, high-throughput sequencing, and clinical imaging plat-forms enable the measurement of ten’s of thousands of variables of a specific data type in a fixed set of tissue samples [1–4]. Such“big” data types include genome-wide mea-surements of messenger RNA (mRNA) and microRNA expression, DNA methylation,
single nucleotide polymorphisms (SNPs), next-generation sequence data, and quantita-tive features extracted fromPositron Emission Tomography(PET) images.
The measurement ofp> 1 variables of a given data type obtained from a collection of
n> 1 samples can be organized into ap×ndata matrixDwith rows representing vari-ables and columns representing measurements of thepvariables in each of then sam-ples. For big data types we havep≫n, making such“tall and thin”matrices difficult to analyze using standard statistical techniques due to a severe multiple comparisons problem and lowSignal-to-Noise Ratio(SNR) [1, 5, 6]. The low SNR is due in large part to the relatively small number of variables (out of many thousands measured) that truly represent a Signal of Interest(SOI) in the data that is associated with an important bio-logical and/or clinical attribute of the samples. In this context, we are interested in selecting s> 0 rows ofDthat best approximate a dominant SOI in the row-space ofD
that may represent a clinically and/or biologically significant attribute of the samples. We call this subset of variables a signaturein D, and if Dis big, then we assume that the signature is“sparse”inD, i.e.,s≪p.
MMDSs pose even greater analytical challenges since the goal is to jointly analyze two or more data matrices in an integrated manner, which exacerbates problems related to data dimensionality and SNR ‘[1, 2, 7]. As before, the goal is to detect sparse signatures for each data type that individually, or in combination, explain a SOI that characterizes an important biological and/or clinical attribute of the samples. Unfortunately, the lack of analytical tools for the joint analysis of multiple data types has slowed the discovery of novel predictive biomarkers and therapeutic targets that account for interactions between networks of diverse molecular species across space and time. Falling data acquisition costs have resulted in MMDS accumulating at an exponential rate in academic research labora-tories, private industry, and public data repositories such as The Cancer Genome Atlas
inventory of multi-modal data presents a major analytical bottleneck in the translation of big, genomic data sets into clinically actionable knowledge.
Formally, the measurements forK> 1 different data types collected from a common set ofnbiospecimens,Sn= {ς1,ς2,…,ςn}, can be represented by a collection ofKdata matrices, D¼f gDk Kk¼1, where: i) Dk is the pk×n data matrix representing measure-ments for the kth data type; and ii) at least one of the Dk is big, i.e.,pk> >n. We as-sume that each Dk has been appropriately pre-processed as function of its data type. For example, pre-processing of mRNA data would likely involve log2-transformation, quantile normalization, and row-centering, while a methylation data matrix would be transformed from Beta-values to M-values prior to normalization and row-centering [10, 11]. Following Friedland and others [12–14], let D¼Dð ÞD be the p×n super-matrix that vertically “stacks” each of the pre-processedpk×n matrices Dk∈D along
their columns where p=∑kK= 1pk. We assume thatDis appropriately scaled by its Fro-benius norm to account for differences in the number of rows and dynamic range of the differentDk’s. Then the joint analysis ofDinvolves the identification ofs> 0 rows of the super-matrix Dthat models a univariate SOI in the row-space ofDas a linear combination of the selected rows. The set of s variables associated with the selected rows define a Multi-Modal SIGnature(MMSIG) of Ddenoted byζ where s=dim(ζ).
If the SOI is highly correlated with an important biological or clinical attribute of the samples, then ζ explains and helps to interpret the sample attribute of interest in terms of the selected variables. Note that sinceDis big (i.e.,p> >n), we wantζto be sparse inD, (i.e.,s ≪p) to facilitate downstream interpretation and model validation. [15].
Matrix approximations of rank-1 provide an efficient way of jointly analyzing the matrices ofD [16–18]. For example, assume the super-matrixDhas rankR> 0 and let
D=∑rR= 1urσrvrT be the Singular Value Decomposition (SVD) of D where: a) ur∈ℝP is the rth left-singular vector (i.e., therth eigen-array); b) vr∈ℝn is therth right-singular vector (i.e., therth eigen-signal); and c)σr∈ℝis therth singular value fori= 1, 2,…,R. Then the outer-product, u1σ1v1T, is the best rank-1 approximation of D in a least squares sense andv1represents the dominant SOI on the columns ofDthat is linearly modeled in terms of the prows of Dweighted by the“loading” coefficients ofu1[16]. Let ζSVDdenote the signature that selects the rows of Dwith non-zero coefficients in
u1. IfDis big, thenp=dim(ζSVD) is large since the SVD in general assigns a non-zero loading to each row of D, which poses problems for downstream validation and inter-pretation ofv1in terms of thepvariables ofζSVD.
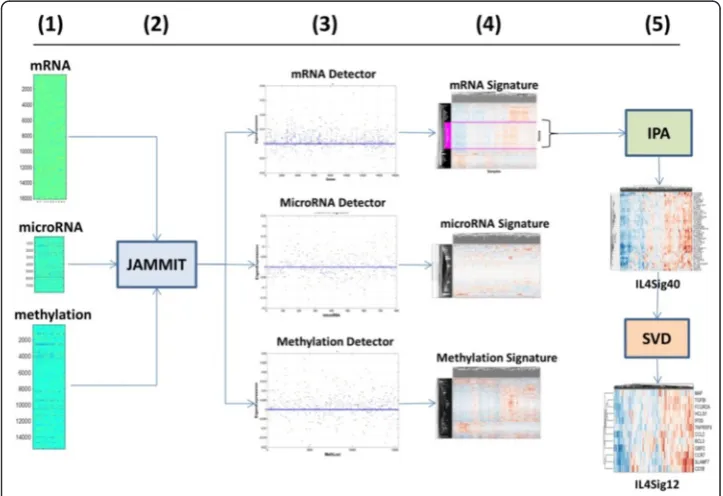
that regularizes u but not vas a function of a ℓ1penalty term selected based on false discovery rate (FDR). The small number of non-zero coefficients of u define a sparse MMSIG in Dthat supports as-dimensional, linear model ofvsuch thats≪p. Since a given MMDS is likely to contain multiple SOIs of biological or clinical relevance, the JAMMIT algorithm is iteratively applied to the residuals of the current model to iden-tify and select any additional SOI that may be present in the data (see Methods Section under The JAMMIT algorithm for more details). Figure 1 shows a specific instance of a JAMMIT analysis of three big data types for ovarian cancer downloaded from TCGA. Here, the information processing flows from left to right in five steps illustrating how three large data matrices are reduced to three relatively small type-specific signatures shown in step 4. Also shown is post-JAMMIT processing illustrating the additional pathway and matrix analysis that is needed to further reduce signature dimensionality without the loss of information. We note that the entire processing chain results in mRNA signatures that associate immune checkpoint signaling in the tumor micro-environment with response to chemotherapy.
Other methods based on matrix factorizations have been proposed for the joint ana-lysis of multiple data types such as the Generalized Singular Value Decomposition
(GSVD), Joint and Individual Variation Explained (JIVE), DISCO-SCA, Partial Least Squares (PLS), and Canonical Correlation Analysis (CCA) [12, 13, 18, 23–25]. These methods suffer from the same problem as the SVD in that they minimize the ℓ2norm of the estimation error and assign non-zero weights to all prows ofD[26]. A number of techniques can be used to reduce the dimensionality of the selected model such as: i) rotation of principal components as implemented in factor analysis; ii) ignoring load-ings smaller than some threshold; and iii) restricting the range of the loadload-ings to a small discrete set of values [21, 27]. Unfortunately, these methods are prone to high false positive rates and poor sensitivity especially in situations where the SNR is low. Regularized versions of Principal Components Analysis (PCA), SVD, CCA, and PLS have been proposed for sparse signal detection and dimensionality reduction, but appli-cation of these methods to the super-matrix that“stacks”an arbitrary number of data matrices is not explicitly discussed [21, 26, 28–30]. Finally, many of the methods out-lined above focus on maximal rank-k approximations of D where k is significantly greater than one, which precludes the use of resampling methods in the selection of the bestℓ1penalty due to the high computational cost [30].
In what follows, we describe in greater detail a workflow for the joint analysis of mul-tiple data types based on the JAMMIT algorithm. A section on methods provides tech-nical detail on the algorithm and the computational tools used to evaluate the statistical significance, biological coherence, and clinical relevance of JAMMIT-derived signatures. We then present and discuss results of: 1) a study that compared JAMMIT detection performance against that of other joint analysis algorithms on simulated data; ii) a JAMMIT analysis of global mRNA, microRNA and DNA methylation data for ovarian cancer down-loaded from TCGA; and iii) a JAMMIT analysis of whole-genome mRNA data for liver cancer supervised by quantitative features derived from PET im-aging data. A discussion and conclusions are presented in a final section.
Methods
Joint Analysis of Many Matrices by Iteration (JAMMIT)
LetD= {Dk}kK= 1denote a collection ofpk×ndata matricesDkthat represents a MMDS acquired from a common set ofnbiospecimens,Sn= {ς1,ς2,…,ςn}. LetD=stack(D) de-note the p×nsuper-matrix ofDwhere p=∑km= 1pk. We assume that at least oneDkis big, so that the super-matrix Dis also big. We assume each Dk has been individually pre-processed as a function of its data type as discussed in the previous section and thatDis scaled by its Frobenius norm such that ifD¼ dij is apnmatrix, then
D←D∙ ∕k kD Frob where: 1) k kD Frob¼ PiPj dij2
1
2 =
is the Frobenius norm ofD; and 2)D=k kD Frob¼ dij∕k kD Frob
.
Forλ> 0, the JAMMIT algorithm generates following rank-1 approximation ofD
D≈uð Þλ ðvð Þλ ÞT ¼uvT ð1Þ
E uð ;v;λÞ ¼D−uvT2Frobþλk ku ℓ1 ð2Þ
subject to the constraint
v¼DTu ð3Þ
where: 1)uvT∈ℝp×nis the outer product ofu∈ℝpandv∈ℝn; 2)uis sparse relative to
p, i.e., s≪p; 3)vrepresents a SOI on the columns ofD; 4)λ> 0 is anℓ1penalty on u;
and 5) k ku ℓ1¼Xp
i¼1j jui is theℓ1-norm ofu∈ℝ p
. Starting with an initialℓ2
approxi-mation (u(0),v(0)) based on the SVD ofDsuch thatD≈u(0)(v(0))T, JAMMIT first obtains aℓ1-regularized solution vectoru(1)∈ℝPdefined by
uð Þ1 ¼ arg min
u∈ℝP
E u;vð Þ0;λ
; ð4Þ
then substitutes this solution in (3) to obtain v(1)∈ℝnand the solution (u(1),v(1)) that satisfiesD=u(1)(v(1))T. Hence, the equality constraint in Eq. (3) ensures the outer prod-uctuvTin Eq. (2) represents a rank-1 approximation ofDunder theℓ1norm. This
pro-cedure is repeated by alternating between (2) and (3) until the sequence (u(i),v(i)) converges to a solution (u,v) based on the error function given in (2) such that
v¼DTu¼Xm k¼1D
T
kuk: ð5Þ
Let ζ(λ)∈ℝs denote the MMSIG with non-zero entries that correspond to s¼sð Þζ
>0 rows ofDthat support the sparse linear model in (5) as a function of λ. We note that: i) λ= 0 implies that (1) is the best rank-1 approximation of Dbased on the SVD; ii) λ> 0 implies that (1) is aℓ1-regularized, rank-1 approximation of Dsuch that s= dim(ζ)≤p; and iii) there existsλsup> 0 such that 0≤s≤pifλ∈ð0;λsupÞ. We show empiric-ally that for simulated and real multi-modal data, one can find λ*∈(0,λsup) based on an empirical estimate of FDR such thatζ(λ*) is sparse inD, i.e.,s(λ*) =s* < <p.
Equation (5) suggests that parsing the vector u according to the order in which the
Dk’s were stacked inDresults in individual rank-1 approximations
Dk≈ukvTfor k¼1;2;…;m ð6Þ
whereuk∈ℝsk is unique to eachD
kandvrepresents the SOI in (1) that is shared by eachDk. Eq. (6) implies that the MMSIGζ* =ζ(λ*) =ζ*(D) can be similarly parsed into type-specific signaturesζk*=ζ*(Dk) according to the stacking order of theDk’s inDthat explainvin terms of the kth data type only. Moreover, we have observed empirically that the sparsity ofζ* implies that the type-specific signaturesζk*inDkare also sparse ifDkis big. Moreover, ana-lysis of simulated and real MMDSs show that the algorithm will still select significant rows ofDkeven ifDkis not big. Table1outlines the key steps of a single iteration of the JAMMIT algorithm for computing joint rank-1 approximations of eachDkof a given super-matrixD.
Note that JAMMIT detects and models the most dominant SOI inDand that weaker SOI of biological and/or clinical importance could be present in Dthat are masked by the dominant SOI. Hence, we“residualize”Dby
D′¼D−uvT ð7Þ
modeled. In any case we hypothesize that the number of iterations is bounded by
R¼ mink½rank Dð Þk .
Selecting anℓ1penalty based on false discovery rate (FDR)
For actual experimental data, empirical FDR was used to select an ℓ1penalty that re-sults in a MMSIG of desired size and statistical significance. Briefly, FDR was estimated for a monotone increasing sequence ofλ’s denoted by
Λ¼f0¼λ1<λ2<…<λl<…<λL<∞g ð8Þ
such that λ1= 0 results in the MMSIG provided by the SVD and λLis the smallest λ that results in a MMSIG of length zero. The presence of statistically significant row-correlations between the matrices ofDis indicated by a sequence of total FDR values,
Θ Λð Þ ¼ Θð Þλ1 ;Θð Þλ2 ;…;Θ λSup
ð9Þ
that decreases rapidly as a function of increasingλ. In this case, aλ*∈Λcan be selected such that: a) Θ(λ*)∈Θ(Λ) is a local minimum that is smaller than some pre-determined threshold; and b) the resulting signature, ζ* =ζ(λ*), is sparse in D. Con-versely, a FDR sequence,Θ(Λ), that fails to decrease fast enough may preclude the se-lection of a λ*∈Λ that is less than a pre-determined threshold and suggests a lack of support from one or more of the Dk′s for the SOI. Note that a“joint”FDR sequence,
Θ(Λ), can be decomposed into a collection of type-specific FDR sequences, Θ(Λ) = {Θk(Λ)}kK= 1 based on the stacking order of theDk’s in D. Here, Θk(Λ) represents the
FDR sequence for thekth sub-signature,ζk* ofζ* (see Additional file1). Again, the pres-ence of a sparse subset of variables inDkthat support the common SOI in a statistically significant way is signaled by a rapidly decreasing sequence of FDR values in Θk(Λ), while the absence of any row-support is indicated by a slowly decreasing FDR se-quence,Θk(Λ), fork= 1, 2,…,K. It follows that if all Dk sparsely support the SOI, then
all Θk(Λ) will rapidly decrease in unison for increasing λ. Additional file 1 provides more detail on how the FDR sequencesΘ(Λ) andΘk(Λ) were generated.
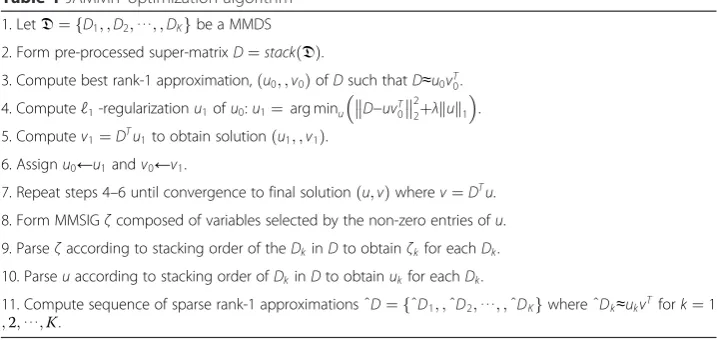
Table 1JAMMIT optimization algorithm
1. LetD¼fD1; ;D2;⋯; ;DKgbe a MMDS 2. Form pre-processed super-matrixD¼stackð ÞD.
3. Compute best rank-1 approximation,ðu0; ;v0ÞofDsuch thatD≈u0vT0. 4. Computeℓ1-regularizationu1ofu0:u1¼arg minu D−uvT0
2 2þλk ku 1
. 5. Computev1¼DTu1to obtain solutionðu1; ;v1Þ.
6. Assignu0←u1andv0←v1.
7. Repeat steps 4–6 until convergence to final solutionðu;vÞwherev¼DTu. 8. Form MMSIGζcomposed of variables selected by the non-zero entries ofu. 9. Parseζaccording to stacking order of theDkinDto obtainζkfor eachDk. 10. Parseuaccording to stacking order ofDkinDto obtainukfor eachDk.
Simulated data
The detection performance of JAMMIT and other joint analysis algorithms were evalu-ated on 1000 simulevalu-ated MMDS using Receiver Operating Characteristic (ROC) analysis (see sub-section below entitled Area under the ROC curve as a function of the ℓ1 pen-alty parameter). Simulated MMDS, D(η)= {Dk(η)}k2= 1= {(Σk(η)+Νk(η))}k2= 1, for η= 1, 2,…, 1000 were generated where p1andp2were randomly selected fromP= {1000, 2000,…, 10000}. Here, Σk(η) and Νk(η) represent simulated signal-only and noise-only data matri-ces, respectively, of dimensions pk(η)× 50 for k= 1, 2 and η= 1, 2,…, 1000. For each η, the super-matrix D(η)=stack(D(η)) =Σ(η)+Ν(η)was assembled where: 1)p(η)=p(1η)+p2(η); 2)Σ(η)=stack(Σ(1η),Σ2(η)); and 3)Ν(η)=stack(Ν1(η),Ν2(η)).
The support ofΣk(η)inDk(η), denoted bySupp(Dk(η)), corresponds to the non-zero com-ponents ofIη=stack(Ik(η)(step),Ik(η)(rand)) that identify the rows ofDk(η)that contain sig-nals SS1 or SS2 defined on the 50 columns of each super-matrix D(η). Here, SS1 and SS2 represent step and random functions defined on the columns of the super-matrix
D(η). The signal-to-noise ratio (SNR) of D(η) in decibels is given by SN R D ð Þη ¼10
log10 var
⌢Σð Þη
var⌢Νð Þη
where⌢Σð Þη; ⌢Νð Þη∈ℝ50p represent vectorized versions ofΣ(η)andΝ(η),
respectively. The goal of each simulation is to detectSupp(D(η)) such that the true positive rate is maximized for a given false positive rate over a wide range of SNR scenarios. Add-itional file 2 provides more detail on the generation of simulated signal-only and noise-only data matrices,Σk(η)andΝk(η), respectively, forη= 1, 2,…, 1000.
Area under the ROC curve as a function of theℓ1penalty parameter
JAMMIT analysis of a simulated stacked matrix requires the specification of anℓ1penalty parameter λ> 0 in eq. (2), which results in a signature ζ(λ) such that s= dim(ζ(λ)). We
note that the regularized minimization of (2) is equivalent to the un-regularized minimization ofE(u,v) =‖S−uvT‖22constrained by‖u(λ)‖1≤1/λ, where theℓ1-parameter λ behaves like a threshold on the components of u(λ)∈ℝpsuch that larger values ofλ result in lower-dimensional signatures [22, 31]. Hence, for a given simulated MMDS and λ>0, we can compute the sensitivity and specificity of JAMMIT to detect a signa-ture inDthat supports a simulated SOI in the row-space ofD. Consider the monotonic-ally increasing sequence ofλk' s (denoted byΛ) defined in (8). We compute the sensitivity and specificity for eachλ∈Λand plotsensitivity(true positive rate) vs. 1specificity (i.e., false positive rate) parameterized by λ to generate a ROC curve.Area Under the ROC
(AUROC) can then be used to quantify the ability of JAMMIT to detect the true support for a simulated signal embedded in a simulated super-matrixD. The detection perform-ance of JAMMIT or any other detection algorithm can be compared by computing the difference between the AUROC values for JAMMIT and an alternative algorithm (ΔAUROC). A positive ΔAUROC value implies JAMMIT outperformed the alternative algorithm; otherwise the alternative algorithm outperformed JAMMIT.
Analysis of multi-modal data for ovarian cancer downloaded from TCGA
from TCGA (http://cancergenome.nih.gov/). This data download resulted in three high-dimensional data matrices of dimensions 16020 × 291 (mRNA), 799 × 291 (micro-RNA) and 15418 × 291 (DNA methylation), each of which were log-transformed, quantile-normalized, centered, and scaled by their respective Frobenius norms prior to formation of an ovarian MMDS denoted by DOVCA. Clinical meta-data for each patient were also downloaded from TCGA and aligned with the columns of the super-matrix of DOVCA. These data included censored survival time, age, stage, and treatment information. Subsequent to formation of DOVCA, additional whole-genome mRNA data for tumors obtained from 99 patients with Stage 3 disease were downloaded from TCGA along with associated clinical metadata. These data were organized to form a mRNA data matrix that was used to assess the robustness of any associations with overall survival with mRNA expression patterns found in the discovery data set represented byDOVCA.
JAMMIT analysis of transcriptomic and PET imaging data for liver cancer
Twenty patients referred for surgical resection of liver tumors were prospectively recruited to participate in an institutional review-board approved clinical research study with written informed consent. Prior to surgery, these patients underwent liver imaging with a Philips Gemini TF-64 PET/CT scanner (Philips Healthcare, Andover, Massachusetts) using 18F-fluorocholine under an investigational new drug protocol. In a previous single-institution clinical trial, 18F-fluorocholine, a tracer of choline phospholipid synthesis, affords PET/CT with relatively high diagnostic sensitivity for HCCs [32, 33]. Presently, less is known regarding the diagnostic utility of 18F-fluorocholine for ICCs and other sub-types of liver cancer. Regions of interest (ROI) analysis of the PET/CT images were used to generate time activity curves corresponding to: 1) the arterial pool in the descending aorta; and 2) areas of tissue within the liver that corresponded to the tumor and adjacent liver samples profiled by expression arrays. PET kinetic analysis was then applied based on a 2-tissue compartment(2TC) model of 18 F-fluorocholine pharmacokinetics in liver tumor and liver tissue [34, 35]. Pharmacokinetic parameters
K1;k2;k3;k4;K1=k2, and Flux for each 2TC model corresponding to each sample were estimated using PMOD 3.4 (PMOD Technologies, Zurich Switzerland) and as-sembled to form a 650 Pet kinetics data matrix for the 50 tissue samples included in the experiment.
Gene-level expression values were assembled to form a 20792 × 50 data matrix where the rows represented 20792 genes and columns represented 50 adjacent-normal and tumor samples obtained from 20 patients. Here, columns 1–20 of the data matrix represented adjacent-normal samples while columns 21–50 represented 30 liver tumors of which 22 were hepatocellular carcinomas (HCCs), 6 were intra-hepatic cholangiocarcinomas (ICC) and 2 were sarcomas. The data matrix was pre-processed by generalized log2 transformation with background subtraction, quantile normalization, and row centering [36].
Eigen-survival analysis
LetDbe apndata matrix wherep≫nand letζð ÞD denote thes×nsub-matrix ofD
composed of rows from D that correspond to the variables (i.e., matrix rows) of a JAMMIT-derived signatureζ. Alternatively, the columns ofζ(D) can be viewed as“ real-izations”of the signatureζin each of thenpatients used to formulateD. LetΩ(D) be a 2 ×nsurvival data matrix forDwhere the 1st row contains observed time-to-death for the npatients ofDand the 2ndrow is a binary indicator of censorship for each patient (0=uncensored, 1=censored). We extracted an Eigen-Survival Model (ESM) based on the SVD of ζ(D) to reduce the negative impact of random noise and systematic errors on the prediction of overall survival [37, 38]. The ESM was then used to compute prog-nostic scores for each patient, and patients with scores in the top and bottom quartiles of scores were identified. The signature ζ(D) was predictive of survival if and only if differences in survival between patients with scores in the top and bottom quartiles were significant in both the KM and Cox regression models withp-value of 0.05 or less. Additional file 3 provides more detail on the workflow used to extract an ESM for a given signature.
Ingenuity Pathway Analysis (IPA)
and pathways that may explain the downstream effects of a given signature on biological and disease processes.
Results and discussion
JAMMIT performance on simulated data
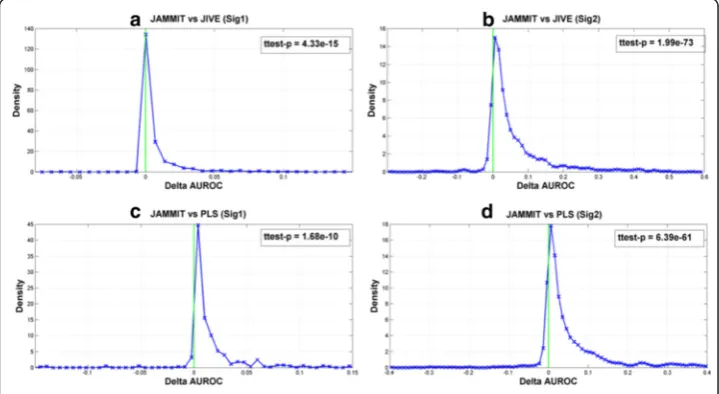
The effectiveness of JAMMIT to detect multiple signals in simulated data sets was evaluated and compared to other algorithms such the JIVE and PLS. JIVE is a generalization ofPrincipal Components Analysis (PCA) to multiple data matrices. Like JAMMIT, PLS enables the supervised analysis of one matrix by another matrix and is also used for the analysis high-dimensional data sets [24]. All three algorithms were ap-plied to the same collection of 1000 simulated MDS’s (see Methods section, Simulated Data) and tasked to detect two sparsely supported signals, SSig1 and SSig2, that were embedded in the data matrices of each simulation over a wide-range of SNR scenarios. SSig1 represents a noisy signal for differential expression that distinguishes the first 25 samples of the simulation from the last 25 samples. SSig2 on the other hand represents a random signal that is sparsely supported by rows in both data matrices that repre-sents an unmeasured and/or unknown biological attribute of the samples.
The goal of each simulation is to detect the sparse support of SSig1 and SSig2 in each simulated data matrix. Figure 2 shows distributions of ΔAUROC values that compares the ability of JAMMIT to detect the support of SSig1 and SSig2 versus that of JIVE and PLS in 1000 data simulations. For example, the first row of plots shows that the distri-butions of ΔAUROC values for SSig1 and SSig2 are concentrated on the positive real
axis. This means that the AUROC values for JAMMIT exceeded that of JIVE more fre-quently than not for SSig1 and SSig2, withp-values of 4.33.E-15 and 1.99E-73, respect-ively. Similarly, the second row of plots shows that the area under the ΔAUROC distributions for both SSig1 and SSig2 is concentrated on the positive real numbers indicating that JAMMIT outperformed PLS significantly more often than not over 1000 data simulations with p-values of 1.68E-10 and 6.39E-61, respectively. Hence, relative to JIVE and PLS, we see that JAMMIT compares favorably in terms of ability to detect the sparse support of a step and random signal in multiple, high-dimensional data sets.
JAMMIT analysis of ovarian cancer data from TCGA
A MMDS composed of global mRNA, microRNA and DNA methylation data obtained from 291 ovarian tumors resected from patients with stage 3 disease were downloaded from TCGA and jointly analyzed using JAMMIT. The goal was to determine if MMSIG exist that distinguished subtypes of ovarian cancer that lead to different clinical out-comes. Leave-One-Out Cross-Validation (LOOCV) based on JAMMIT was applied to
Dto identify a MMSIG for ovarian cancer that was robust to minus-one perturbations of the 291-sample discovery data set. First, a sequence of FDR values for a monoton-ically increasing sequence of ℓ1penalty values was computed based on the JAMMIT analysis of 100 permuted versions of the super-matrix, D (see Methods section). An
ℓ1 penalty parameter of λ291= 0.002875.was selected based on an FDR of 0.0034619 that was a local minimum, which resulted in an mRNA signatureζmRNA(0) composed of 643 genes, a miRNA signature ζmiRNA(0) composed of 368 microRNAs (FDR= 0.19912), a methylation signatureζMeth(0) composed of 450 methylation loci (FDR = 0.03038), and a MMSIGζ(0)composed of 1461 mRNA, miRNA and methylation variables that were “stacked”in the order of theDk’s inD( FDR = 0.067647) (see Additional file 4).
For the LOOCV analysis, the jth column of each Dk of D was removed to obtain minus-one MMDSs, D(j)= {Dk(j)}k3= 1, and minus-one stacks,D(j)=stack(D(j)) forj= 1, 2, …, 291. JAMMIT was then applied to eachD(j)withλ291= 0.002875, which resulted in
sj-dimensional, minus-one MMSIGs, ζ(j), forj= 1, 2,…, 291. On average, eachζ(j) reca-pitulated 98 % of the s0variables of ζ(0)over all 291 minus-one analyses implying that JAMMIT-derived signatures based onλ=λ291are robust to minus-one perturbations of
the discovery data set. A single MMSIG defined byζ¼∩j ζð Þj was generated, which
de-fined sub-signatures composed of 534 mRNAs (ζ1), 337 microRNAs (ζ2) and 357 methylation loci (ζ3) common to all 291 minus-one MMSIGs.
combination was chosen because the FDR values forζ1(0)andζ3(0)were highly significant compared to ζ2(0), which implied the type-specific signaturesζ1andζ3best explained the common SOI shared by all three different data types. Visual examination of Fig. 3a-c shows that the clustered heatmaps for each type-specific signature contained meta-variables composed of matrix rows that exhibited coordinated patterns of variation, some of which are highlighted in yellow or green. In particular, the clustered heatmap forζ13in Fig. 3d contained the metagene, γ, (highlighted in green) that defined a MMSIG com-posed of 249 variables of which 209 were mRNAs (γ1), and 40 were methylation loci (γ3). Figure 4 shows that the MMSIG,γ, and the type-specific sub-signatures,γ1, and γ3were all significantly associated with overall survival on the 291 discovery samples contained in
Sn. Interestingly, the signature that combined the mRNA and methylation variables had a more significant association with survival than signatures that contained only mRNA or only methylation variables based on log-rank and Cox regression p-values, median sur-vival time, and 5-year sursur-vival rate.
To further reduce signature dimensionality and to better understand the biology that underlay the association ofγwith overall survival, we focused subsequent downstream analysis and interpretation on the 209-gene mRNA signature, γ1, using IPA. In particu-lar, the Upstream Regulator Analysis (URA) feature in IPA was used to identify sub-signatures ofγ1that were “anchored”upstream by a single regulating molecule. Table 2 shows that Interleukin 4 (IL4) was the top upstream regulator of γ1that directly tar-geted 40 genes (out of 209) in the signature (Score=2.115 p=2.11E-20). Note that acti-vation scores greater than 2.0 andp-values less than 1.0E-03 are considered significant. The 40 genes inγ1directly targeted by IL4 were used to define a mRNA signatureφIL(40)4
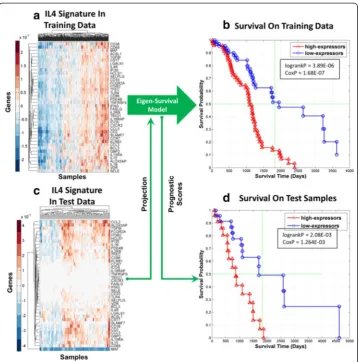
contained in γ1that was“anchored”upstream by IL4. Figure 5 shows the results of an eigen-survival analysis based on the realization of φIL(40)4 in the expression data for the 291 patients in the discovery data set. Figure 5a shows the clustered heatmatp ofφIL(40)4 realized in the training data set and Fig. 5b shows KM plots based on prognostic scores for each patient derived from the ESM extracted from the expression patterns in Fig. 5a. In Fig. 5b, we see that 144 patients with prognostic scores in the top and bottom quar-tiles have significantly different KM plots with log-rankp-value of 3.89E-06 (logrankP). Moreover, a Cox regression model of overall survival based on prognostic scores for all
Fig. 4Eigen-survival analysis of JAMMIT multimodal signature composed of mRNA and methylation variables for 291 patients.aKM plots of based on MMSIG composed of mRNA and methylation variables.bKM plots based on signature composed mRNA variables only.cKM plots based on signature composed of methylation variables only. Note thatp-values, median survival time and 5-year survival rate for the signature that combines variables for the mRNA and microRNA data types
Table 2Top Upstream Regulators of mRNA signatureγ1for ovarian cancer
Upstream regulator Predicted state Activation score IntersectionP-value Number of targets
IL4 Activated 2.115 2.115E-20 40
OSM Activated 2.616 2.41E-08 21
Stat5(A/B) Activated 2.630 6.50E-08 9
IPA identified IL4 as the top upstream regulator of theγ1signature that directly targeted 40 genes in the signature (Score=2.115, p=2.115E-20). These 40 genes formed a mRNA signature,φIL(40)4, that was“anchored”upstream by IL4 with expression patterns
that implied the up-regulation of this gene. Subsequent eigen-survival analysis shows that theφIL4 (40)
signature was robustly associated with overall survival on the 291-sample discovery data set and a 99-sample independent test data set. Regulation ofφIL(40)4 by IL4 linked overall survival of ovarian cancer patients with stage 3 disease to macrophage
291 patients with age as a covariate had a p-value of 1.68E-07 (CoxP), which provides further validation of the eigen-survival model derived from expression patterns visual-ized in Fig. 5a. Figure 5c shows the clustered heatmap of theφIL(40)4 signature realized in whole-genome mRNA data for 99 independent test tumor samples. The prognostic scores for the 99 test patients were computed by processing the expression patterns in Fig. 5c using the ESM derived from the expression patterns in Fig. 5a. Figure 5d shows that test patients with prognostic scores in the top and bottom quartiles have significantly different survival statistics (logrankP=2.08E-03, CoxP=1.26E-03). Hence, the ESM based on φIL(40)4 captured information related to overall survival that was also applicable to the 99-samples of the independent test data set that were un-seen during discovery.
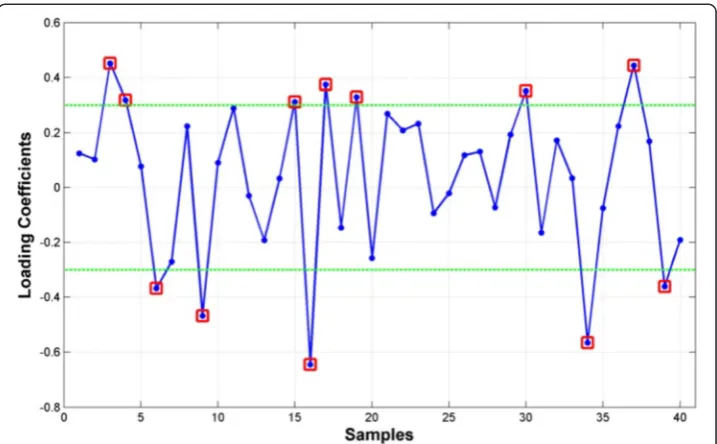
We further reduced the dimensionality ofφIL(40)4 based on the ESM extracted from the 291 discovery samples. Figure 6 shows a plot of the 40 loading coefficients associated with the ESM derived from expression patterns in Fig. 5a with 12 high magnitude
Fig. 540-gene signatureφIL(40)4 for ovarian cancer anchored upstream by IL4 is robustly associated with survival. aClustered heatmap of the mRNA signatureφIL(40)4 realized in the 291-sample training data set.bKM plots of patients in training data set with prognostic scores in the top and bottom quartiles based on the eigen-survival model based on the realization ofφIL(40)4 in 291-sample discovery data set.cClustered heatmap ofφIL(40)4 realized in the 99-sample test data set.dKM plots of patients in unseen test data set with prognostic scores in the top and bottom quartiles. The prognostic scores for the test patients were obtained by projecting the realization of
coefficients highlighted in red. The 12 genes corresponding to these coefficients were assembled to form the mRNA signature, φIL(12)4, that was tested for association with overall survival on the 291-sample discovery data set and the 99-sample independent test data set. Figure 7a shows that ESM based onφIL(12)4 in the 291 samples of the discov-ery data set was significantly associated with overall survival (logrankP=1.54E-05,
Fig. 6Loading coefficients of eigen-survival model derived fromφIL(40)4 in the 291-sample discovery data set. Genes that contribute most significantly to the eigen-survival model derived from the 291-sample discovery data set are highlighted by red squares. These genes were used to define a 12-gene mRNA signatureφIL(12)4 that was evaluated for association with overall survival and biological coherence
Fig. 7A 12-gene mRNA signature for ovarian cancer anchored upstream by IL4 predicts overall survival.aKM plots of patients in discovery data set with prognostic scores based on the 12-gene mRNA signatureφIL(12)4 in the top (red) and bottom (blue) quartiles. Note the two groups of 72 patients each (144 total) show significant differences in survival based on the separation between their respective KM plots.bKM plots of patients in test data set withφIL(12)4 prognostic scores in the top (red) and bottom (blue) quartiles. The two groups of 24 patients each (48 total) show significant differences in survival based on the separation between their respective KM plots. Note the prognostic scores for the test patients were computed by projecting the test data matrix for
CoxP=1.06E-04). Moreover, Fig. 7b shows that the ESM based on φIL(12)4 realized in the discovery data generalizes to the 99 samples of the independent test data set (log-rankP=9.70E-03, CoxP=4.64E-04). Interestingly, the set of 28 genes in φIL(40)4 comple-mentary to the genes in φIL(12)4 failed to generalize on the 99 independent test samples. These results validate the BEST principle as implemented by JAMMIT for the joint analysis of multiple data sets in ovarian cancer.
Note that IL4 directly targets every gene in φIL(12)4 per IPA. IL4 induces the transform-ation of Tumor Associated Macrophages (TAMs) that infiltrate the tumor microenvir-onment into the M2 phenotype, which confers a survival advantage to cancer cells and promotes tumor growth [39, 40]. An alternative pathway involving Interferon Gamma (IFNG) and Tumor Necrosis Factor Alpha (TNFA) transform TAMs into the M1 phenotype that exerts a cytotoxic effect on genetically mutated cancer cells. It has been reported that a high M1/M2 ratio is associated with extended survival in ovarian cancer patients [39]. This suggests that immune cell polarization in the tumor microenviron-ment impacts the overall survival of patients with ovarian cancer undergoing standard platinum-based chemotherapy combined with paclitaxel. Indeed, the φIL(12)4 signature contains the Chemokine (C-C motif ) Ligand 2 (CCL2) gene, which is a chemokine that recruits monocytes from the bloodstream to the tumor microenvironment [41]. It has been reported that CCL2 is up-regulated in ovarian cancer and the blockade of CCL2 protein expression enhances immunotherapeutic and chemotherapeutic response [41].
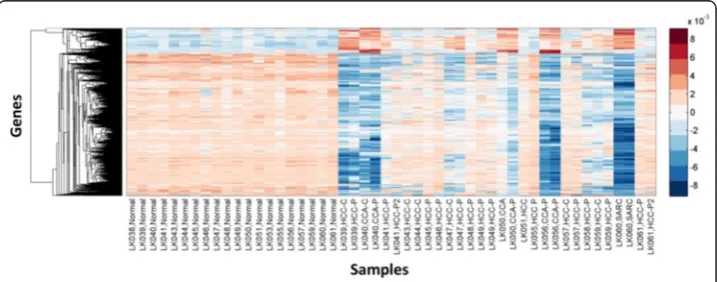
Imaging-genomics of liver cancer
Whole-genome expression data were collected for 20792 genes in 20 adjacent-normal, 22 hepatocellular carcinoma (HCC), 6 intra-hepatic cholangiocarcinoma (ICC) and 2 sar-coma samples using DASL microarrays. The expression data were assembled to form a 20792 × 50 expression data matrix where columns 1–20 represented the normal samples and columns 21–50 represented the tumor samples. The data matrix of raw expression was pre-processed by generalized log2 transformation, quantile normalization, and row-centering to obtain the pre-processed expression data matrix HmRNA. The values of six kinetic parameters,K1;k2;k3;k4;K1=k2;Fluxobtained from 2TC models for each tissue sample formed the columns of a 6 × 50 data matrix that was row-centered to obtain the PET data matrix, HPET. A final pre-processing step involved the scaling of the stacked matrixHPETX=stack(HmRNA,HPET) by its Frobenius norm. The goal of this analysis is to identify mRNA signatures that are highly correlated with the rows of the PET kinetic data matrix [42, 43].
Six different analyses of HmRNA based on JAMMIT were conducted where each analysis was supervised by a single PET kinetic parameter. That is, JAMMIT was applied to HPETX(l) = {HmRNA,HPET(l) } where HPETX(l) is a 1-dimensional vector equal to the l th row ofHPETfor l= 1, 2,…, 6. Of the six possible analyses, only supervision by the Hð ÞPETX5 ¼K1=k2 kinetic parameter resulted in a FDR profile that implied sig-nificant joint correlations betweenHmRNAandHPET(see Additional file 5). A locally minimal FDR* = 0.000549 was selected from the FDR profile for genes that corre-sponded to anℓ1 penalty parameter value ofλ* = 0.0089429. A JAMMIT analysis based on
this value ofλresulted in a mRNA signatureωðK1=k2Þ
mRNA containing 652 genes that was
as a function ofλimplied a significant and robust correlation betweenωðK1=k2Þ
mRNA and theK1=
k2 PET parameter over a wide-range of sparse, linear models. Moreover, the dominant eigen-signal of the 652 × 50 signature matrix, ωðK1=k2Þ
mRNA ðHmRNAÞ was significantly correlated
with theK1=k2 PET parameter (r¼0:413;p¼0:00293Þ. In sharp contrast, the FDR pro-files for JAMMIT analyses ofHmRNAsupervised by the other PET kinetic parameters failed to produce an ℓ1penalty that correlated the two data types (see Additional file 6). Note these results show that JAMMIT is able to identify significant variables of data types defined by a small number of variables. Indeed, the data matrixHmRNAdescribed above has 20792 rows, while the PET kinetic data matrix,Hð ÞPETX5 , has a single row composed ofK1=k2kinetic parameter values in 50 samples. Here, the FDR table for the joint analysis of HmRNAand
Hð ÞPETX5 admits the single row of Hð ÞPETX5 into the sparse, rank-1 approximation ofDPETX(l) =
stack{HmRNA,HPET(l) } for almost allℓ1parameter values (see Additional files 5 and 6). Figure 8 visualizes the realization of ωðK1=k2Þ
mRNA in HmRNA as a row-clustered heatmap where we see that aggregate gene expression is highly variable on the tumor samples (columns 21–50) compared to the normal samples (columns 1–20). Figure 9a shows a
2-way clustered heatmap of ωðK1=k2Þ
mRNA and here we see a group of genes in ω K1=k2
ð Þ
mRNA that
are preferentially down-regulated on a set of 15 tumors relative to a complementary subset of fifteen (15) HCCs and twenty (20) normal samples. LetΓ(−)denote the set of
column indices of HmRNA that correspond to the samples where ω
K1=k2
ð Þ
mRNA is
down-regulated andΓ(+)column indices for samples whereωðK1=k2Þ
mRNA is up-regulated. In Fig. 9b
we see that the dominant eigen-signal of the 2-way, clustered heatmap in Fig. 9a clearly discriminates between the samples inΓ(−)andΓ(+)based on a threshold set at zero. The
ability ofωðK1=k2Þ
mRNA to discriminate between the samples inΓ
(−)
andΓ(+)suggests two dis-tinct expression phenotypes for HCC represented by the seven (7) HCC inΓ(−)and fif-teen (15) HCC inΓ(+). Moreover, the co-clustering of 7 HCC samples inΓ(−)along with 6 ICC suggests that these HCC samples represent a cholangio-like HCC subtype
(CL-Fig. 8Clustered heatmap of theK1/k2signature identified by JAMMIT in 50 liver tissue samples. The heatmap for
theK1/k2signature,ωK1=k2
ð Þ
mRNA , exhibits very uniform expression on the normals (columsn 1–20) and very high variability on the tumor samples. On the tumor samples, we note significant down-regulation of ωðK1=k2Þ
mRNA expression patterns on a subset of seven (7) HCC, six (6) ICC and 2 sarcomas. The remaining 15 HCC
had ωðK1=k2Þ
HCC), which may share clinical and biological attributes of this more aggressive sub-type of liver cancer [44, 45].
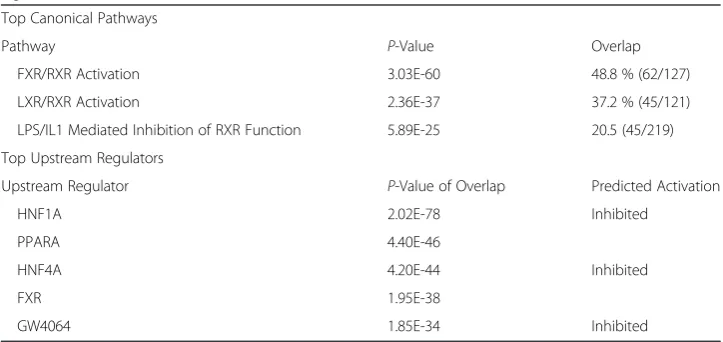
Table 3 lists the top canonical pathways and upstream regulators of ωðK1=k2Þ
mRNA
ac-cording to IPA. The top upstream regulators included the nuclear receptors HNF4A, HNF1A, and FXR (NR1H4) where HNF4A and HNF1A were predicted to be inactivated with high statistical significance. Moreover, FXR/LXR and LXR/RXR Activation were the top canonical pathways and most of the genes in both path-ways were down-regulated suggesting inactivation of these pathpath-ways upstream of ωðK1=k2Þ
mRNA . The dominate downstream effects of ω K1=k2
ð Þ
mRNA per IPA included biological
functions related to the dysregulation of lipid and bile acid metabolism as well as disease functions related to the initiation and progression of HCC and ICC. For
example, the inactivation of HNF4A as a significant upstream regulator of ωðK1=k2Þ mRNA
is consistent with published reports that HNF4A down-regulation suppresses hep-atocyte differentiation and commitment to the biliary lineage in ICC and CL-HCC [44–47]. Moreover, loss of HNF1A function in hepatocytes leads to the activation of pathways involved in tumorigenesis [48]. Finally, HNF4A and FXR exhibit re-duced expression in human HCC and ICC, and that mice lacking FXR expression spontaneously developed HCC [49–51].
Fig. 9Cluster analysis by theK1/k2signature reveals a novel subtype of HCC metabolically similar to ICC.a2-way hierarchically clustered heatmap ofK1/k2signature in the 50-sample discovery data set. This analysis identified two distinct expression phenotypesΓ(−)andΓ(+)whereΓ(−)included samples whereωK1=k2
mRNAwas down-regulated on the samples inΓ(−)relative to the remaining samples in
Γ(+). The
Γ(−)class contained all 6 ICC samples plus 7 HCC and 2 sarcomas whileΓ(+)contained all 20 normal samples along with 15 HCC.bPlot of the dominant eigen-signal of
the matrix for theωK1=k2
mRNAsignature clearly separates the samples inΓ (−)
We note theωðK1=k2Þ
mRNA signature included 46 membrane transport genes from the
ATP-Binding Cassette (ABC) and Solute Carrier (SLC) super-families, almost all of which were significantly down-regulated in the tumor samples of Γ(−)relative to the samples
in Γ(+). Recall the dominant eigen-signal of ωðK1=k2Þ
mRNA ð ÞD1 was found to be significantly correlated with the K1/k2 PET parameter (r¼0:413;p¼0:00293Þ. The K1/k2 param-eter in-fluorocholine PET images reflects the blood-tissue equilibrium of choline, a nu-trient important for phospholipid and bile homeostasis, as well as lipid transform.
Therefore, it is not surprising that theωðK1=k2Þ
mRNA signature contained a significant number
of ABC and SLC membrane transport genes, since these genes regulate the influx and efflux of bile and lipids across the membranes of hepatocytes and cholangiocytes and are tightly regulated by nuclear receptors HNF4A, HNF1A and FXR [52]. The above
suggests the inactivation of HNF4A, HNF1A and FXR upstream of ωðK1=k2Þ
mRNA suppresses
the uptake and efflux of bile and lipids downstream of ωðK1=k2Þ
mRNA by down-regulating the
expression of specific ABC and SLC genes of ωðK1=k2Þ
mRNA . In addition to the wide-spread
disruption of bile acid and lipid homeostasis, the down-regulation of membrane
trans-porters in ωðK1=k2Þ
mRNA directly impacts liver carcinogenesis and tumor progression. For
example: i) SLC22A1 is associated with progression and survival in human ICC [53]; ii) knockout mice lacking ABCB4 suffer from the loss of biliary phospholipid secretion and spontaneously develop HCC [50]; iii) transporter genes ABCB1, ABCC6, ABCC9, ABCG2 are down-regulated in prostate cancer [54]; iv) ABCB11/BSEP (Bile Salt Export Pump) and FXR expression is reduced in HCC [55]; and v) SLC22A1 is epigenetically silenced in human HCC [56].
Figure 10 shows the expression profiles of the ABCB11 gene (i.e., Bile Salt Export Pump or BSEP), in two different groupings of the samples: i) ICCvsHCC compares 6 ICC (columns 1–6) and 22 HCC (columns 7–28); and ii) NRMvsTUMOR compares 20 Normals (columns 1–20) and 30 Tumors (columns 21–50). The top panel of Fig. 10
Table 3IPA analysis identifies top canonical pathways and upstream regulators of the ωK1mRNA=k2 signature for liver cancer
Top Canonical Pathways
Pathway P-Value Overlap
FXR/RXR Activation 3.03E-60 48.8 % (62/127)
LXR/RXR Activation 2.36E-37 37.2 % (45/121)
LPS/IL1 Mediated Inhibition of RXR Function 5.89E-25 20.5 (45/219) Top Upstream Regulators
Upstream Regulator P-Value of Overlap Predicted Activation
HNF1A 2.02E-78 Inhibited
PPARA 4.40E-46
HNF4A 4.20E-44 Inhibited
FXR 1.95E-38
GW4064 1.85E-34 Inhibited
TheωK1=k2
mRNAsignature was highly enriched for genes in the FXR/RXR Activation pathway according to IPA. This pathway regulates lipid and bile acid metabolism and has been associated with the initiation and progression of liver cancer. The top upstream regulators ofωK1=k2
shows that the ABCB11 gene is down-regulated in the ICC samples (red squares) and CL-HCC samples (green triangles) relative to the HCC samples (blue circles) in the ICCvsHCC data set based on a horizontal threshold set at zero. The bottom panel of Fig. 10 shows that ABCB11 is uniformly up-regulated on the 20 normals and highly variable on the tumors with preferential down-regulated on the ICC (red circles), CL-HCC (green triangles) and sarcoma samples in the NRMvsTUMOR data set. The ABCB11 gene codes for a protein that facilitates the efflux of bile acids out of the liver and defects in the ABCB11 gene result in progressive familial intrahepatic cholestasis, which is a progressive liver disease that often starts early in life and rapidly progresses to end-stage liver disease with an increased risk for HCC. The above suggests that ICC and CL-HCC subtypes can be characterized in part by the suppression of bile acid ef-flux that is mediated by the down-regulation of the ABCB11 transporter gene.
Figure 11 shows the expression profiles of nuclear receptors FXR and HNF4A and the SLC transporter genes SLC2A1/GLUT1 and SLC6A14 in the ICCvsHCC and NRMvsTUMOR experiments. Panels A and B of Fig. 11 confirm that both FXR and HNF4A are preferentially down-regulated in ICCs relative to the HCC, uniformly up-regulated on the normals relative to liver tumors, and highly variable on the tumors with preferential down-regulation on the tumors inΓ(−). Panel C of Fig. 11 shows that unlike the nuclear receptors FXR and HNF4A, the SLC2A1/GLUT1 transporter is
up-Fig. 10The ABCB11 gene discriminates between theΓ(−)and
regulated in ICC relative to HCC, uniformly down-regulated on normals relative to tu-mors, and highly variable on tumors but with preferential up-regulation on the tumors in Γ(−). In Fig. 11d, SLC6A14 shows strikingly high and specific up-regulation on all 6 ICC and 5 of 7 CL-HCC samples relative to the remaining 15 HCC samples in the
ICCvsHCC experimental. Moreover, we see that SLC6A14 is uniformly down-regulated on the normals compared to the tumors in NRMvsTUMOR with significant up-regulation concentrated on the ICC and CL-HCC samples. SLC6A14 is reported to be highly activated in cancers of the colon, cervix, breast, and pancreas, and the blockade of SLC6A14 has been suggested as a treatment for many solid tumors [57, 58]. The expression profiles in Fig. 11d supports the possibility that SLC6A14 may be a thera-peutic target ICC and CL-HCC.
The correlation between ωðK1=k2Þ
mRNA and the K1/k2 PET parameter suggests the ex-pression phenotypes represented by Γ(−) andΓ(+) can be distinguished by the K1/k2 parameter [42, 59, 60]. To test this hypothesis, we encoded the information content of the K1/k2parameter vector in a Generalized Regression Neural Network (GRNN) implemented in MATLAB (The MathWorks Inc., Natick, MA) after denoising by the Daubechies mother wavelet of order 3 over 5 scales [61–63]. The GRNN model was trained using a ‘spread” parameter set at 0.23235 that defines the level of smoothing of the GRNN output. Training of the GRNN was supervised by a binary target vector,T∈{0, 1}50, where the samples inΓ(+) andΓ(−)were labeled with a “0” and “1”, respectively. Figure 12a visualizes the output of a GRNN trained on theK1/
k2parameter for the 50 samples included in this study. Samples of the expression phenotype Γ(−)are highlighted by red squares (ICC), green triangles (CL-HCC) and black asterisks (sarcoma) while the samples in Γ(+) (adjacent-normal and HCC) are highlighted as blue circles. The horizontal threshold (magenta line) was used to classify each of the 50 samples by assigning a sample to the Γ(−) phenotype if its
Fig. 12Discriminating between two expression phenotypes based on the PET kinetic parameterK1=k2. Points in scatter plots represent output of Generalized Regression Neural Networks (GRNNs) trained to discriminate
between two expression phenotypes denoted byΓð Þ andΓð Þþ identified by theωðK1=k2Þ
GRNN value was greater than the threshold and toΓ(+)otherwise. Here, we see the GRNN trained on the denoised K1/k2vector correctly classified all the samples in Γ(−)
and 71 % of the samples inΓ(+)for an average correct classification rate of 86 %, which is significantly greater than chance. We note that the GRNN output vector was significantly correlated with the target values in T (r= 0.61267p= 1.987E−06). To assess the robustness of this result, the K1/k2 parameter vector was randomly permuted 1000 times and a GRNN was trained on each permutation using the tar-get vector Tand spread parameter equal to 0.23235.Figure 12b shows that it is difficult to separateΓ(−)andΓ(+)using any threshold on the output of a GRNN trained on a ran-dom permutation of theK1/k2parameter vector, which is reflected in the low correlation of the GRNN output with the target vectorT rð ¼0:27615;p¼0:05223Þ. Out of 1000 permutations only one had correlation greater thanr= 0.61, which resulted in an empir-icalp-value of pK1=k2 ¼1=1000¼0:001. Hence, the observed separation ofΓ(−)andΓ(+) shown in Fig. 12a was probably not a random event.
These preliminary results suggest that the non-invasive monitoring of specific bio-logical processes over time in liver tumors using PET imaging is possible. Note theK1/
k2 kinetic parameter is just one of many quantitative features that can be extracted from PET images for the supervised analysis of genomic data sets. Relating predictive signatures extracted from molecular images to global patterns of genomic, transcrip-tomic, epigenomic and metabolomic variation using algorithms such as JAMMIT can be referred to as “imaging genomics” [42, 64]. The central hypothesis of imaging gen-omics is that image features that capture variation over space and time reflect under-lying genetic programs of biological and clinical relevance.
Discussion and conclusions
outcome. Pathway analysis indicated that this expression signature was associated with a pervasive down-regulation of genes and pathways that regulated membrane transport of lipids, suggesting that any difference in clinical outcome between these two tumor subtypes may be due in part to membrane transport dysregula-tion. This particular application of JAMMIT to liver cancer also demonstrates how the analysis of a single big data matrix can be supervised by an arbitrary univariate function using ℓ1 regularization.
In developing the JAMMIT algorithm we encountered a number of technical issues related to the joint analysis of multiple data types that will require further study. For example, we have shown thatℓ1regularization of the super-matrix that vertically stacks multiple, big data matrices of a MMDS for ovarian cancer resulted in low-dimensional, multi-modal signatures that were biologically coherent and predictive of clinical out-comes. For this analysis, each data matrix was appropriately pre-processed as a function of data type, and the resulting super-matrix was scaled by its Frobenius norm. The sen-sitivity of JAMMIT-derived signatures to this front-end pre-processing procedure is an open question that will be answered more definitively in future studies. Another issue pertains to systematic variation in the data that we assume is unique to a given data type. Since JAMMIT models a dominant source of common variation that is shared across multiple data types, we expect the FDR profiles of each data type to rapidly decrease in unison as a function of increasingℓ1penalty for such a signal.. In this case, it is unlikely that the resulting signal model represents systematic variation that is by definition unique to a single data type. Alternatively, if only a single data type shows a rapidly decreasing FDR profile, then it is likely that JAMMIT is modeling a source of systematic variation that is unique to that data type. Subsequent downstream process-ing of the resultprocess-ing type-specific signatures usprocess-ing pathway and ontological analysis should be able to resolve some of the ambiguity regarding the biological and/or clinical relevance of such signatures. This feature of JAMMIT to discriminate between system-atic and biologically relevant sources of variation based on FDR decay will be character-ized more fully in future investigations. Finally, the use of FDR to select an appropriate
ℓ1penalty that balances statistical significance and signature size provides researchers with considerable flexibility in model selection, but it comes with a high computational cost associated with permutation testing. Future studies should consider alternative methods of selecting an “optimal” ℓ1 penalty that takes into account user preferences for model parsimony, sensitivity, and specificity without the need for resampling.
Additional files
Additional file 1:Estimating FDR profiles on a grid ofℓ1penalties. (DOCX 59 kb)
Additional file 2:Generation of simulated MMDS. (DOCX 86 kb)
Additional file 3:Eigen-survival modeling of JAMMIT signatures. (DOCX 42 kb)
Additional file 4:FDR profile of a JAMMIT analysis of multi-modal data for ovarian cancer from TCGA. This table summa-rizes the relationship betweenℓ1penalties and FDR that is estimated based on 100 permutations of the super-matrix of a MMDS for ovarian cancer that integrates whole-genome mRNA, miRNA and DNA methylation data obtained from 291 patients with stage3 disease. Note the FDR profiles for each data type (columns 4, 6, and 8) are decreasing towards smaller values indicating that all 3 data types contribute to some degree to a“sparse”linear model of the SOI, with mRNA contrib-uting the most in terms of FDR. In particular, row 19 (in red) is highlighted since it corresponds to a FDR for mRNA of 0.0034619 that is a local minimum of column 4. This FDR value is associated with anℓ1penalty of 0.002875 that results in a mRNA signature composed of 643 genes (FDR=0.0034619), a miRNA signature of 368 miRNAs (FDR=0.19912), a methyla-tion signature of 450 methylamethyla-tion loci (FDR=0.03038), and a multi-modal signature composed of a 1461 variables (FDR=0.067647). (DOCX 20 kb)
Additional file 5:FDR profile for analysis of whole-genome gene expression data supervised by theK1/k2PET parameter. Note theK1/k2PET parameter (column 5) is selected for inclusion in the sparse linear model of the SOI for mostℓ1penalties with FDR values of zero. Moreover, the FDR profile for genes (column 4) is rapidly decreasing indicating a strong signature for gene expression. These results taken together suggest that theK1/k2parameter is associated with gene expression via the sparse linear model for the SOI. In particular, row 12 (highlighted in red) corresponds to a FDR for mRNA of 0.00054949 that is a local minimum of column 4. This FDR value is associated with aℓ1penalty of 0.0089429 that results in a mRNA signature composed of 652 genes. (DOCX 19 kb)
Additional file 6:FDR profile for analysis of whole-genome expression data supervised by theK1PET parameter. This FDR profile indicates a lack of correlation between global gene expression and theK1PET kinetic parameter. Note that theK1PET parameter (column 5) is NOT selected for inclusion in the model of the SOI for all but the first ℓ1penalty value (see row 1) with FDR values of 1.0. This result is in sharp contrast to the FDR profile for gene expression (column 4) where the FDR values rapidly decrease to small values. This result suggests that although there is a strong signal in the mRNA data matrix that contributes to the common SOI, this signal is not correlated with theK1PET parameter. (DOCX 19 kb)
Acknowledgments
We thank the staff of the Pathology Shared Resource (PSR) and Genomic Shared Resource (GSR) of the University of Hawaii Cancer Center for their support of tissue and genomic data collection for this study. The PSR and GSR are supported in part by NCI P30 CA071789. We also thank the staff of The Hamamatsu/Queen’s PET Imaging Center (PIC) for supporting the image acquisition and analysis for this study. The PIC is supported NCI R01 CA161209-04.
Funding
Study design, tissue and data acquisition, data analysis, and interpretation of results were supported by the following grants: ARRA grant NCI P30 CA071789-12S7; NCI R01 CA161209-04; and NCI P30 CA071789.
Availability of data and materials
All MATLAB code (version R2013b) and data used to generate the results of this study are publicly available at Open Science Framework (DOI 10.17605/OSF.IO/JUAB9) [65]. Please address any questions and/or comments regarding the data and/or code to the corresponding author.
Authors’contributions
GO, AZ, TW, and SK conceived and designed experiments and simulations. GO, AZ, TW, JBN, TF, MT, SK performed the experiments and simulations. GO, MT, ML, BH,.OC, LW, SK were involved in data acquisition, storage, and management. GO, AZ, TW, JBN, TF, SK collaborated on data analysis and interpretation of results. GO, AZ, TW, JBN, SK helped to write the paper. All authors read and approved the final manuscript.
Competing interests
The authors declare that they have no competing interests.
Consent for publication Not applicable.
Ethics approval and consent to participate
The results of the ovarian cancer example were based on genomics and survival data downloaded from TCGA Research Network, which precluded the need for Institutional Review Board (IRB) approval. Written informed consent was obtained from all patients included in the imaging-genomics study in accordance with a clinical research protocol approved by the Queen’s Medical Center IRB that adhered to the ethical guidelines of the 1975 Declaration of Helsinki and subsequent amendments.
Author details 1
University of Hawaii Cancer Center, 701 Ilalo Street, Honolulu, HI 96813, USA.2SNR Analytics, LLC, 45-115E Waikalua Road, Kaneohe, HI 96744, USA.3Department of Mathematics, University of Hawaii, Manoa, Honolulu, HI 96822, USA. 4
Received: 27 January 2016 Accepted: 5 July 2016
References
1. Donoho DL. High-Dimensional Data Analysis: The Curses and Blessings of Dimensionality. Lecture Delivered at the “Mathematical Challenges of the 21st Century”Conference of the American Math. Los Angeles: Society; 2000. http://www-stat.stanford.edu/donoho/Lectures/AMS2000/AMS2000.html.
2. Kristensen V, Lingjcerde O, Russnes H, Vollan H, Frigessi A, Borresen-Dale AL. Principles and methods of integrative genomic analyses in cancer. Nat Rev Cancer. 2014;14:299–313.
3. Network TCGA. Integrated genomic analyses of ovarian carcinoma. Nature. 2011;474(7353):609–15. 4. Tomczak K, Czerwinska P, Wiznerowicz M. The Cancer Genome Atlas (TCGA): an immeasurable source of knowledge.
Contemp Oncol. 2015;19(1A):A68–77.
5. Storey J, Tibshirani R. Statistical significance for genomewide studies. PNAS. 2003;100(16):9440–5. 6. Efron B, Hastie T, Johnstone I, Tibhshirani R. Least angle regression. Ann Stat. 2004;32:407–99.
7. Hamid JS, Hu P, Roslin NM, Ling V, Greenwood CMT, Beyene J. Data Integration in Genetics and Genomics: Methods and Challenges. Human Genomics and Proteomics : HGP. 2009;2009:869093. doi:10.4061/2009/869093. 8. ICGC. International network of cancer genome projects. Nature. 2010;464:993–8.
9. Zhu Y, Qiu P, Ji Y. TCGA-Assembler: open-source software for retrieving and processing TCGA data. Nature. 2014; 11(6):599–600.
10. Du P, Zhang X, Huang C, Jafari N, Kibbe W, Hou L, Lin S. Comparision of Beta-value and M-value methods for quantifying methylation levels by microarray analysis. BMC Bioinformatics. 2010;11:587.
11. Quackenbush J. Microarray data normalization and transformation. Nat Genet Supplement. 2002;32:496–501. 12. Friedland S. A new approach to generalized singular value decomposition. SIAM J Matrix Anal Appl. 2005;27(2):434–44. 13. Lock E, Hoadley K, Marron J, Nobel A. Joint and Individual variation explained (JIVE) for integrated analysis of
multiple data types. Ann Appl Stat. 2013;7(1):523–42.
14. Hastie T, Tibshirani R, Eisen MB, Alizadeh A, Levy R, Staudt L, Brown P. .“Gene shaving”as a method for identifying distinct sets of genes with similar expression patterns. Genome Biology. 2000;1(2):research0003.1–research0003.21. 15. West M. Bayesian factor regression models in the“large p, small n”paradigm. Bayesian Stat. 2003;7:722–32. 16. Kalman D. A singularly valuable decomposition: The SVD of a matrix. Coll Math J. 1996;27(1):2–23. 17. Strang G. Linear Algebra and Its Applications, 4th edn: Thomson Higher Education; 2006.
18. Zhang T, Golub G. Rank-one approximation to high order tensors. SIAM J Matrix Anal Appl. 2001;23(2):534–50. 19. Tibhshirani R. In praise of sparsity and convexity. 50th Anniversary volume for COPSS. 2013.
20. Bishop C. Pattern Recognition and Machine Learning. New York: Springer; 2007.
21. Jolliffe I, Trendafilov N, Uddin M. A modified principal component technique based on the LASSO. J Comput Graph Stat. 2003;12(3):531–47.
22. Tibshirani R. Regression shrinkage and selection via the LASSO: A retrospective. J R Stat Soc Ser B. 2011;39:1335–71. 23. Van Deun K, Van Mechelen I, Thorrez L, Schouteden M, De Moor B, van der Werf MJ, De Lathauwer L, Smilde AK,
Kiers HA. DISCO-SCA and properly applied GSVD as swinging methods to find common and distinctive processes. PloS one. 2012;7(5):e37840.
24. Boulesteix A, Strimmer K. Partial least squares: a versatile tool for the analysis of high-dimensional genomic data. Brief Bioinform. 2006;8(1):32–44.
25. Alter O, Brown P, Botstein D. Generalized singular value decomposition for comparative analysis of genome-scale expression data sets from two different organisms. PNAS. 2003;100:3351–6.
26. Shen H, Huang J. Sparse principal component analysis via regularized low rank matrix approximation. J Multivar Anal. 2008;99:1015–34.
27. Sabatti C, Karsten S, Geschwind D. Thresholding rules for recovering a sparse signal from microarray experiments. Math Biosci. 2002;176:17–34.
28. Chun H, Keles S. Sparse partial least squares regression for simultaneous dimension reduction and variable selection. J R Stat Soc Ser B. 2010;72(1):3–25.
29. Witten D, Tibshirani R, Hastie T. A penalized matrix decomposition with applications to sparse principal components and canonical correlation analysis. Biostatistics. 2009;10(3):515–34.
30. Zhang L, Liu C, Zhou X. Identifying multi-layer gene regulatory modules from multi-dimensional genomic data. Bioinformatics. 2012;28(19):2458–66.
31. Hastie T, Tibhshirani R, Friedman J. The Elements of Statistical Learning. 2001.
32. Bieze M, Klumpen H, Verheij J, Beuers U, Phoa S, van Gulik T, Bennink R. Diagnostic accuracy of (18)F-methylcholine positron emission tomogrpahy/computed tomography for intra- and extrahepatic hepatocellular carcinoma. Hepatology. 2014;59(3):996–1006.
33. Talbot J, Fartoux L, Balogova S, Nataf V, Kerrou K, Gutman F, Huchet V, Ancel D, Grange J, Rosmorduc O. Detection of hepatocellular carcinoma with PET/CT: a prospective comparison of 18 F-fluorocholine and 18 F-FDG in patients with cirrhosis or chronic liver disease. J Nucl Med. 2010;51(11):1699–706.
34. Bentourkia M, Zaidr H. Tracer kinetic modeling in PET. PET Clin. 2007;2(2):267–77.
35. Watabe H, Ikoma Y, Kimura Y, Nakagawa M, Shidahara M. PET kinetic analysis - compartmental model. Ann Nucl Med. 2006;20(9):583–8.
36. Lin SM, Du P, Huber W, Kibbe WA. Model-based variance-stabilizing transformation for Illumina microarray data. Nucleic Acids Res. 2008;36(2):e11.
37. Bair E, Tibshirani R. Semi-supervised methods to predict patient survival from gene expression data. PLoS Biol. 2004;2(4):E108.
38. Shen Y, Huang S. Improve survival prediction using principal components of gene expression data. Genomics Proteomics Bioinformatics. 2006;4(2):110–9.