Open Access
Research
Mapping sequences by parts
Gilles Didier*
1and Carito Guziolowski
2Address: 1Institut de Mathématiques de Luminy, 163 avenue de Luminy, Case 907, 13288 Marseille Cedex 9, France. and 2Projet Symbiose, IRISA – campus de Beaulieu, 35042 Rennes Cedex, France.
Email: Gilles Didier* - [email protected]; Carito Guziolowski - [email protected] * Corresponding author
Abstract
Background: We present the N-map method, a pairwise and asymmetrical approach which allows us to compare sequences by taking into account evolutionary events that produce shuffled, reversed or repeated elements. Basically, the optimal N-map of a sequence s over a sequence t is the best way of partitioning the first sequence into N parts and placing them, possibly complementary reversed, over the second sequence in order to maximize the sum of their gapless alignment scores.
Results: We introduce an algorithm computing an optimal N-map with time complexity O (|s| × |t| × N) using O (|s| × |t| × N) memory space. Among all the numbers of parts taken in a reasonable range, we select the value N for which the optimal N-map has the most significant score. To evaluate this significance, we study the empirical distributions of the scores of optimal N-maps and show that they can be approximated by normal distributions with a reasonable accuracy. We test the functionality of the approach over random sequences on which we apply artificial evolutionary events.
Practical Application: The method is illustrated with four case studies of pairs of sequences involving non-standard evolutionary events.
Background
Classic alignments methods are unable to extract homol-ogies involving shuffled, reverse-complemented or repeated elements between sequences, despite the fact that there are identified mechanisms of evolution of sequences which lead to such types of homologies. This can happen on large scale with genome rearrangements but it can also occur on a smaller scale, for instance within genes, with domain recombinations, duplications, exon shufflings, etc.
On the other hand, there are few methods allowing us to compare sequences with relaxed assumptions about
con-servation of linear order and one-to-one association of positions between sequences [1-3]. In particular, as it is pairwise and asymmetrical, the approach proposed in [1] is similar to the work presented here. The authors intro-duce the transformation distance, similar to the Leven-stein distance between sequences, which includes editing operations like transposition, duplication, etc. The algo-rithmic complexity of the computation of this distance, which was initially high, has been improved in [4].
However, the transformation distance has some draw-backs; mainly, it does not take into account mutations. In [2], the authors introduce the Glocal alignment method Published: 19 September 2007
Algorithms for Molecular Biology 2007, 2:11 doi:10.1186/1748-7188-2-11
Received: 2 February 2007 Accepted: 19 September 2007
This article is available from: http://www.almob.org/content/2/1/11
© 2007 Didier and Guziolowski; licensee BioMed Central Ltd.
which allows one to compare sequences with shuffled or inverted elements. The main idea of their work is to com-bine local and global alignments. During the first stage, the method selects conserved segments (local) and during the second stage, it chains an optimal subset of the pairs of segments previously selected (global). Many special-ized approaches have been developed to model the spe-cific evolutions "by blocks" of certain elements of sequences: minisatellites [5] or swaps in proteins sequences [6]. In the latter, the method is based on selec-tion of common segments by local alignments scores and can be applied in a more general framework. The approach proposed in [3], mostly applied to more than two sequences, proceeds in similar manner in its first stage, then performs post-treatments and a graph repre-sentation of common elements of sequences.
For simplicity, we present the N-maps without taking into account inversions. Some hints will be given about how to extend the definitions and the algorithms in order to han-dle this type of evolution. Under this restriction, the (opti-mal) N-map of a sequence s over a sequence t is basically the way of cutting s into N parts that maximizes the sums of the scores of the gapless alignments of all the N parts against t. The gapless alignments can be local or global and so can be the N-map. This approach can be seen as a generalization of the "alignment with a fixed number of gaps" method initially introduced in [7] and recently studied in [8,9]. As this method, our approach is an attempt to avoid the introduction of some arbitrary costs on the transformations between sequences (like gap pen-alties in the case of alignment). For this purpose, we need a concrete way to determine the "best" number N of parts for mapping a sequence s over a sequence t. As in [9], we define this problem from a probabilistic point of view. Practically, we choose the number of parts leading to the most significant optimal score. The significance is empiri-cally evaluated among pairs of independent identiempiri-cally distributed (iid) random sequences of same lengths and symbols distributions as s and t.
The rest of this paper is organized as follows. Section 1 is devoted to formal definitions and basic properties of the N-maps. We present the algorithms computing the opti-mal scores and correponding N-maps of a sequence s over a sequence t in Section 2. The algorithmic complexities of these computations are O (|s| × |t| × N) in time and O (|s| + |t| × N) in memory space. These complexities have an extra factor N with regard to the classical pairwise align-ment algorithms. However typical values of interest of N are small compared to the lengths of the sequences: choosing a number of parts of the same order as the lengths of the sequences does not make any sense. The choice of the number of parts is discussed in Section 3, in which we investigate the distributions of the scores of the
optimal N-maps of random sequences. In particular, empirical evidences lead us to approximate these distribu-tions by normal ones and to measure the significance of optimal scores in terms of Z-values. The approach is eval-uated in Section 4 by applying artificial evolutionary events over random sequences and by measuring the abil-ity of the approach to retrieve the corresponding homolo-gous segments. Section 5 shows four case studies of sequences (two pairs of proteins, a pair of DNA sequences of transposon elements and a pair of sequences of genes of microbial genomes) in which the homologies cannot be reported by a classic alignment. Finally in Section 6, we discuss the approach and present some research directions we plan to explore.
The sources of the software computing N-maps are avail-able at [10]. We also provide additional utilities to esti-mate Z-values, represent N-maps as pictures (see Section 5), filter, merge and extract common segments.
1 Notations and Definitions
We consider sequences (or strings) over some finite alpha-bet of elements called letters or symbols. In practical applications, symbols can represent nucleotides, amino acids or genes. The elements of a sequence s are indexed from 1 to |s|, where |s| denotes the length of s, i.e. s = s1 s2 ... s|s|. For 1 ≤i ≤j ≤ |s|, the notation s[i, j] designates the
sub-string si si+1 ... sj. We note the reverse sequence of s, i.e.
= s|s| s|s|-1 ...s1. The set of all sequences of length l over
is noted . Let s and t be two sequences. A pair of intervals of positions ([a, b], [c, d]) is a diagonal of (s, t) if 1 ≤a ≤b ≤ |s|, 1 ≤c ≤d ≤ |t| and b - a = d - c. The first (resp. the second) interval of a diagonal D of (s, t) will be desig-nated as the s-interval (resp. the t-interval) of D. In order to avoid to deal specifically with some "pathological cases", we allow diagonals to be empty (of length 0).
Definition 1 Let s and t be two sequences. A N-map of s over t is a N-tuple of diagonals of (s, t): [([a1, b1], [c1, d1]), ([a2, b2], [c2, d2]), ...,([aN, bN], [cN, dN])] such that [ai, bi] ∩ [aj, bj] = ∅for all 1 ≤i, j ≤N with j ≠i.
Without loss of generality, we assume in the following that the diagonals of a N-map of s over t are indexed according to the positions of their s-intervals. In particu-lar, the first diagonal (resp. the last diagonal) is the one with the smallest (resp. the greatest) start position of s-interval.
Notation denotes the set of all the N-maps of s over
t.
ˆ
s
ˆ
s
l
A N-map of s over t is nothing but a peculiar type of map from a subset of positions of s to the set of positions of t. In other words, it associates at most one position of t to a position of s; and none, one or several positions of s to a position of t (See Figure 1 or Figure 2 for dotplot represen-tation).
A given classical alignment (which is also a map between positions) can be seen, for a certain positive integer N, as a N-map, both of s over t and of t over s. More precisely, an alignment with a fixed number K of gaps, like studied in [7-9], is a (K + 1)-map which, with notations of Defini-tion 1, verifies the addiDefini-tional condiDefini-tions: [ci, di] ∩ [cj, dj] =
∅ and (ai - aj) × (ci - cj) > 0 for all 1 ≤i, j ≤K + 1 with j ≠i. For 0 <N ≤K ≤ |s| and a given N-map of s over t, there is at least one K-map defining the same map from positions of s to positions of t.
Let be a scoring scheme, i.e. a map from
to ⺢. The score associated to a N-map following is:
As in classical alignment methods, we will consider in the following only additive scoring schemes, i.e. defined from a substitution matrix π, for all lengthes l and all
pairs of sequences (u, v) ∈ × , by:
The score of an empty diagonal (l = 0) is 0.
The maximum of the scores over all the N-maps of s over
t is noted (s, t):
An optimal N-map of s over t is a N-map with score
(s, t). By convention, a 0-map is the empty set and (s, t) = 0.
Depending on whether the substitution matrix contains negative values or not, the optimal N-map is said to be local or global. These concepts are used by analogy with the case of alignment. When the matrix contains only non-negative values (global case), a corresponding opti-mal N-map of s over t will attempt to associate each posi-tion of s with a position of t, as in a global alignment. When the matrix contains some negative values (local case), the optimal N-map will be reached by considering only subparts of s which lead to a positive contribution of the total score when associated with a segment of t, once more as in local alignment. Basically, a global N-map of s over t spans the entire length of s (except possibly some boundary positions) while a local N-map identifies N non-overlapping segments of s with maximum scores against t.
Some pathological situations could arise in the local case. In particular there could be some positions i of s such that π[si, tj] is negative for all positions j of t. Without
consid-ering empty diagonals, (s, t) would be not always growing with N.
l l
l∈N ×
∪
[([ ,a b1 1],[ ,c d1 1]),...,([aN,bN],[cN,dN])]= (s[a bk, ] [k ,tck,,d]) k
N
k
=
∑
1
×
l l
( , )u v [ , ]u v j
l
j j
=
=
∑
π1
N
N s t
s t N
( , ) max ( )
( , ) =
∈
Γ Ω Γ
N
0
N
Dotplot representations of two 4-maps Figure 2
Dotplot representations of two 4-maps. a) Position m is inside a diagonal. b) Position m is not inside a diagonal.
1 2 3 4 5 . . . m . . . |s|
1 2 3 4 5 . . .
|t|
r r r rr r
r r r rr r
r r r rr r r r
r r r rr r
r r r
r
1 2 3 4 5 . . . m . . . |s|
1 2 3 4 5 . . .
|t|
r r r r r r
r r r rr r
r r r rr r
r rr r r
r r r rr r
r
a b
Representation of the 3-map [([2, 3], [1,2]), ([4,8], [7,11]), ([11,13], [5,7])] of s over t
Figure 1
Representation of the 3-map [([2, 3], [1,2]), ([4,8], [7,11]), ([11,13], [5,7])] of s over t. The positions associated in a diag-onal are connected by a line.
s
1 2 3 4 5 6 7 8 9 10 11 12 13c c c c c
s s s
t
1 2 3 4 5 6 7 8 9 10 11s s s
The current software implementation incorporates vari-ous substitution matrices in particular for amino acids (PAM, BLOSUM, etc.).
For handling inversions, which is not allowed by Defini-tion 1, it is first needed to extend this definiDefini-tion by adding a sign to the pair of intervals:
• (+, [a, b], [c, d]) means that the positions [(a, c), (a + 1, c + 1),...] are associated (normal case),
• (-, [a, b], [c, d]) means that the positions [(a, d), (a + 1, d - 1),...] are associated (inversion case).
Another required extension concerns the way of calculat-ing the score for "reverse diagonals". This point depends on the nature of sequences. For instance in the case of DNA sequences, the score of (-, [a, b], [c, d]) is computed by summing the individual substitution scores of s[a, b] against the complementary-reverse of t[c, d]. If s and t are sequences of genes, this score is obtained by considering s[a, b] against the reverse of t[c, d].
2 Algorithms
Given two sequences s, t and a positive integer N, we address two problems:
• Problem 1: computing the optimal scores (s, t) with K running from 1 to N.
• Problem 2: outputting the diagonals of an optimal N -map.
Computing the optimal scores
Let Best[i, j, K] be the maximal score obtained by a K-map of s[1, i] over t ending at (i, j), i.e. such that its last diagonal ([aK, bK], [cK, dK]) verifies bK = i and dK = j. By setting Best[0,
j, K], Best[i, 0 , K] and Best[i, j, 0] to 0 for all integers i, j and K, we have the following recurrence relation:
The correctness of this relation is straightforwardly proved by induction. Let us consider the maximum involved in the right part of this equation. It is equal to:
• Best[i, j, K], if the greatest score is obtained by increment-ing the length of the last diagonal of an optimal K-map of s[1, i] over t ending at (i, j) – then the last diagonal will end at (i + 1, j + 1).
• , if the greatest score is obtained by
adding the diagonal of length 1 ([i + 1, i + 1], [j + 1, j + 1]) to an optimal (K - 1)-map of s[1, i] over t.
To compute the entries of Best referred to the index (i + 1), we only need to know the entries referred to the index i. Thus computing the optimal scores of all the K-maps of s over t, with K from 1 to N, can be done in O (|s| × |t| × N) time using O (|t| × N) memory space to store the dynamic programming variables. We can introduce now the formal algorithm Alg_1 which solves the problem of computing the optimal scores for global or local N-maps without inversion.
Algorithm Alg_1 takes as input two sequences s, t and a number of parts N and returns:
• Bs and Bl, two |t| × N matrices where the entry Bs[j, K] con-tains the maximal score of a K-map of s over t ending at (|s|, j) – with the preceding notations Bs[j, K] = Best[|s|, j, K] – and the entry Bl[j, K] stores the length of the last diagonal of a K-map ending at (|s|, j) with score Bs[j, K];
• Ms and Md, two arrays of size N where the entry Ms[K] stores the optimal score of a K-map of s over t – with the
preceding notations Ms[K] = (s, t) = maxq ≤ |s|, p ≤ |t| Best[q, p, K] – and the entry Md[K] stores the last diagonal of a K-map with score Ms[K].
The correctness of Algorithm Alg_1 is proved by induction over the positions of s. The time and memory space com-plexities are straightforwardly analyzed.
The variables Bl and Md are not involved in the computa-tion of the maximal scores of K-maps for 1 ≤K ≤N (they will be used by the algorithm in charge of outputting the diagonals). If we are only interested in solving Problem 1, these variables as well as the lines 7, 10, 14 and 19 can be deleted. Algorithm Alg_1 will still return the optimal scores of K-maps with 0 ≤K ≤N in the array Ms.
Algorithm 1 Alg_1 (s, t, N, Bs, Bl, Ms, Md)
1: Bs[j, K] ← 0 ; Bl[j, K] ← 0 ; Ms[K] ← 0 ; Md[K] ← NULL ; (j = 0 ... |t|, K = 0 ... N)
2: for i = 1 to |s| do
3: for j = 1 to |t| do
4: for K = N to 1 do
5: if Bs[j-1, K] ≥ Ms[k-1] then
6: ←π[si, tj] + Bs[j-1, K] ;
K
Best[ , , ] [ , ] Best[ , , ] Best
,
max , max
i j K s t i j K
k i l t
i j
+1 +1 =π +1 +1 + ≤ ≤ [[ , ,k l K−]
⎧ ⎨ ⎪ ⎩⎪
⎫ ⎬ ⎪ ⎭⎪
1
max
, [ , , ]
k i l j≤ ≤ Bestk l K−1
K
7: ← Bl[j-1, K] + 1 ;
8: else
9: ←π[si, tj] + Ms[K-1] ;
10: ← 1;
11: end if
12: if ≥ Ms[K] then
13: Ms[K] ← ;
14: Md[K] ← ([i - + 1, i], [j - + 1, j]) ;
15: end if
16: end for
17: end for
18: swap (Bs, ) ;
19: swap (Bl, ) ;
20: end for
Theorem 1 Algorithm Alg_1 computes the optimal score of the K-maps of a sequence s over a sequence t, for K from 1 to N, in time O (|s| × |t| × N) using O (|s| + |t| × N) memory space.
Outputting the diagonals of an optimal N-map
Before presenting the formal algorithm, we need to intro-duce some additional notations and results about "divid-ing maps".
We say that a position m of s is inside a diagonal of a N-map
Γ if there is a diagonal ([a, b], [c, d]) ∈Γ such that a ≤m <b (Figure 2a). This notion excludes two cases:
1. when m is not contained by any diagonal (this is usual with local N-maps),
2. when a diagonal is exactly ending at m in its first inter-val.
We denote as the maximal score obtained by a
K-map of s[i,|s|] over t[j,|t|] starting at (i, j), i.e. such that its first diagonal ([a1, b1], [c1, d1]) verifies a1 = i and c1 = j.
Lemma 1 Let s and t be two sequences, m a position of s and
N a positive integer. The optimal score of a N-map (s, t) is equal to the maximum of the two following quantities:
•
•
Proof: Let Γ = [([a1, b1], [c1, d1]), ..., ([aN, bN], [cN, dN])] be
a N-map of s over t with score (s, t). There are two possibilities: either the position m is inside a diagonal K of Γ, or not. In the first case, there are a K-map Γ' ending at [m, cK + m - aK] and a (N - K + 1)-map Γ" starting at
posi-tion [m + 1, cK + m - aK + 1] such that
, which implies
. In the second case, let K be such that m =
bK or bK <m <aK+1. There is a K-map Γ' of s[1, m] over t and a (N - K)-map Γ" of s[m+1,|s|] over t such that
, which implies
. In both cases, (s, t) is smaller than
max{ }.
On the other hand, for all integers 1 ≤K ≤N, for all posi-tions 1 ≤ p < |t|, for all K-maps and for all
(N - K + 1)-maps
the N-map
has score , which is by definition smaller
than (s, t). It implies that . A similar
argument establishes that and ends the proof.
Remark 1 Let s and t be two sequences, N a positive integer, and [D1, ..., DN] an optimal N-map of s over t with diagonals D1, ..., DN indexed following the increasing order of their s-intervals.
1. For all 1 ≤K <N, [D1, ... , DK] is an optimal K-map of
over t. Reciprocally, if is an optimal
K-map of over t then is
an optimal N-map of s over t. ′
Bl[ , ]j K
′ Bs[ , ]j K
′ Bl[ , ]j K
′ Bs[ , ]j K
′ Bs[ , ]j K
′
Bl[ , ]j K B′l[ , ]j K
′ Bs
′ Bl
Best[ , , ]i j K
N
1
1 1 1 1 1
= +
≤ ≤K Nmax;≤ <p t{Best[ , , ]m p K Best[m+,p+ ,N K− + ]}
2
1 1 1
= +
≤ ≤
− +
max { ([ , ], ) ([ ,| |], )}
K N m
N K
m s
s t s t
K
N
( )Γ′ +(Γ′′ =) N( , )s t
N( , )s t ≤ 1
( )Γ′ +(Γ′′ =) N( , )s t
N( , )s t ≤ 2 N
1, 2
′ = ′ ′ ′ ′ ′ ′
Γ [([ , ],[ ,a b1 1 c d1 1]),...,([aK, ],[m cK, ])]p
′′ = + ′′ + ′′ ′′− + ′′− + ′′
Γ [([m 1, ],[b1 p 1,d1]),...,([aN K 1,bN K 1],[cN KN− +1,dN K′′− +1])]
Γ =[([ , ],[ ,a b1′ ′1 c d1′ ′1]),...,([aK′, ],[b1′′ c′K,d1′′]),...,([[a′′N K− +1,bN K′′− +1],[cN K′′− +1,d′′N K− +1])]
( )Γ′ +(Γ′′)
N 1≤N( , )s t
2 ≤N( , )s t
s a
K
[ ,1 +1−1] [D1′,...,D′K]
s a
K
2. For all 1 <K ≤N, [DK, ..., DN] is an optimal (N - K +
1)-map of over t. Reciprocally, if is an
optimal (N - K + 1)-map of over t then
is an optimal N-map of s over t.
We are now able to introduce the formal algorithm Alg_2 which solves the problem of outputting the diagonals of an optimal global N-map without inversion.
Algorithm Alg_2 takes as inputs two sequences s and t, two positions i and j bounding a substring of s, and a number of parts N. It outputs the diagonals of an optimal N-map of s[i, j] over t ordered according to their first inter-vals.
Algorithm 2 Alg_2 (s, i, j, t, N)
1: if N = 0 then
2: return;
3: end if
4: Smax ← -∞ ; ; ← NULL ;
5: Alg_1 (s[i, m], t, N, Bs, Bl, Ms, Md) ;
6: Alg_1 ; \* Loop
*\
7: for K ← 1 to N do
8: L ←N - K + 1 ;
9: for p ← 1 to (|t| - 1) do
10: q ← |t| - p ;
11: if (Bs[p, K] + ) > Smax then
12: Smax ← Bs[p, K] + ;
13: Dmax ← ([m - Bl[p, K] + 1, m + ], [p - Bl[p, K] +
l, p + ]) ;
14: NL ←K - 1 ; NR ←L - 1 ; jL ←m - Bl[p, K] ; iR ←m +
+ 1;
15: end if
16: end for
17: end for \* Loop *\
18: for K ← 0 to N do
19: L ←N - K ;
20: if (Ms[K] + ) > Smax then
21: Smax ← Ms[K] +
22: if K > 0 and Md[K] ≠ NULL then
23: ([a, b], [c, d]) ← Md[K] ; Dmax ← ([a + i - 1, b + i -1], [c, d]) ;
24: NL ←K - 1 ; jL ←a + i - 2 ;
25: else
26: Dmax ← NULL ; NL ← 0 ;
27: end if
28: if L > 0 and ≠ NULL then
29: ([a, b], [c, d]) ← ; ← ([a + m, b + m],
[c, d]) ;
30: NR ←L - 1 ; iR ←b + m + 1 ;
31: else
32: ← NULL ; NR ← 0 ;
33: end if
34: end if
35: end for
36: Alg_2 (s, i, jL, t, NL) ;
37: Output (Dmax) ; output ( ) ;
38: Alg_2 (s, iR, j, t, NR) ;
Correctness of Algorithm Alg_2
Let us consider Best and defined for s[i, j] as follows. For all r such that i ≤r ≤j and v such that 1 ≤v ≤ |t|, Best[r,
v, K] is the maximal score obtained by a K-map of s[i, r] over t[1, v] ending at (r, v). Analogously, is the
max-imal score obtained by a K-map of s[r, j] over t[v, |t|] starting at (r, v). For all positions p of t and all 1 ≤K ≤N, we have
Bs[p, K] = Best[m, p, K], (since it
is obtained from ), and
. Following the notations of
Lemma 1, "Loop " (resp. "Loop ") parses the quanti-sb s
K
[ −1+1, ] [D′K,...,D′N]
sb s
K [ −1+1, ]
[D1,...,DK−1,D′K,...,DN′ ]
m= ⎢i+ j ⎣⎢
⎥ ⎦⎥
2 D′max
(s[m+1, ]j , ,t N,B B M M∗ ∗s, l, ∗s, ∗d) 1
Bs[ , ]∗q L
Bs[ , ]∗q L
Bl[ , ]∗q L
B∗l[ , ]q L
Bl[ , ]∗q L
2
M∗s[ ]L
M∗s[ ]L
Md[ ]∗L
M∗d[ ]L Dmax′
′
Dmax
′
Dmax
Best
Best[ , , ]r v K
B∗s[| |t p K− , ] =Best[m+1,p+1, ]K
s[m+1, ]j Ms[ ]K = K(s[ , ],i m t)
M∗s[ ]K =K(sm+1, ]j, )t
ties maximized by (resp. by ). Thus, Lemma 1
ensures that is stored in the variable Smax
after the execution of these two loops. If the maximum is reached in "Loop ", the variable is NULL and the variable Dmax contains the diagonal including m, let us say
the Kth, of a N-map with score . Remark 1
allows us to output the Kth diagonal ([a
K, bK], [cK, dK]) and
to compute recursively an optimal (K - 1)-map of over t, and a (N - K)-map of over t.
If the maximum is reached in "Loop ", the variables
Dmax and contain the two diagonals on both sides
of position m of a N-map with score . The
diagonal Dmax (resp. ) is possibly NULL – and not outputted – if m is smaller than the first position (resp. greater than the last position) of the N-map. Applying again Remark 1 leads to the correctness of the algorithm.
Time and space analysis of Algorithm Alg_2
Let us consider the recursion tree of an execution of Alg_2 which outputs an optimal N-map of s over t. The root of this tree is the initial call to Alg_2 with the parameters (s, 1, |s|, t, N), its two children are the two recursive calls in lines 36 and 38, and so on. The depth level of recursion of the initial call/root is 0. The depth level of another call is recursively defined as the incremented depth level of its direct ancestor. Before the two recursive calls at lines 36 and 38, the execution time of a call to Alg_2 with the parameters (s, i, j, t, N) is bounded by c × (j - i + 1) × |t| × N, for a constant c. Time is spent essentially in the two calls to Alg_1 at lines 5 and 6. The two recursive calls are done with the parameters (s, i, jL, t, NL) and (s, iR, j, t, NR) where:
•
(1)
• NL + NR ≤N - 1 (2)
Let us remark that because of the possibly unbalanced repartition of N into NL and NR between the subcalls, the Master Theorem [11], generally used to evaluate complex-ity of divide and conquer algorithms, cannot be applied to prove the desired time complexity.
Since the initial call is done with the parameters (s, 1, |s|, t, N), the following assertions can be proved by induction over the depth level of recursion.
• From Inequalities (1), the length of the substring of s bounded by the two parameters "positions" in a call of
depth level d is smaller than .
• From Inequality (2), the sum of the parameters "number of parts" of all the calls of depth level d is smaller than (N - d).
Thus, the total time spent at a level of recursion d is
smaller than c × × |t| × N. By summing over all the
possible levels (at most N levels), it comes that the total (including all the recursive subcalls) execution time of a call to Alg_2 with the parameters (s, 1, |s|, t, N) is smaller than 2 × c × |s| × |t| × N. This ends the time analysis.
The analysis of the memory space complexity is straight-forward: each call needs only O (|t| × N) of local storage space to run; the sequences are stored once in O (|s| + |t|) and, from Inequality (2), there are at most N recursive calls to Alg_2.
Theorem 2 Algorithm Alg_2 outputs the diagonals of an opti-mal N-map of a sequence s over a sequence t in time O (|s| × |t| × N) using O (|s| + |t| × N) memory space.
The algorithm taking into account inversions follows the same general outline with additional and symmetrical dynamic programming variables for "reverse diagonals".
A similar idea can be used to compute an optimal align-ment with a fixed number N of gaps in O (|s| × |t| × N) time complexity using O (|s| + |t| × N) memory space. It improves the "SANK_AL" algorithm described in [9], which needs O (|s| × |t| × N) memory space.
3 Choice of the number of parts
Given two sequences s and t, the score of an optimal N -map of s over t increases with N. The maximum of the optimal scores is reached at most with N = |s| and the cor-responding maps generally do not make sense. Some a pri-ori knowledge could help us to decide whether the increase of the score between the K-and the (K + 1)-map deserves to consider an extra diagonal, for instance by introducing a penalty growing linearly with the number of parts.
1 2
N(s[ , ]i j, )t
1 D′max
N(s[ , ]i j , )t
si a
K
[ , −1] s[bK+1, ]j
2
′
Dmax
N(s[ , ]i j , )t
′
Dmax
(jL − + ≤ − +i 1) j i 1 and (j−iR + ≤ − +) j i
2 1
1 2
s
d 2
s
Without such a priori knowledge, a natural choice is to consider the most significant optimal N-map: here the one which minimizes the probability of observing an
optimal score greater than (s, t) between a pair of iid random sequences with the same lengths as s and t, and with the probabilities of symbols set to the frequencies observed over s and t. This choice needs to have informa-tions about the probability distribuinforma-tions of the optimal scores of N-maps. Even if the problem could sound more homogeneous than the alignment case, we failed to derive an analytical approximation of this distribution. How-ever, two cases are quite simple to check:
N = 1 A 1-map is nothing but a gapless alignment of s and t. The distributions of the maximal scores were well stud-ied in the local case and are known to converge to extreme value (EV) distributions [12].
N = |s| The optimal score of a |s|-map is obtained by sum-ming the maximal substitution scores of all the positions of s against the whole sequence t. Let t be fixed and s be an iid sequence, then the scores associated to all the posi-tions of s correspond to a set of iid random variables of
expected value and
variance ,
where px is the probability of the symbol x in s. The opti-mal score turns out to be a sum of |s| random variables of this type. Thanks to the Central Limit Theorem, its distri-bution converges with |s| to the normal distribution
. If t is not fixed but random, this
dis-tribution becomes a mixture of with
weights depending on the probabilities of sequences t. With reasonable assumptions about the length and the probability distribution of t, we can neglect all the compo-nents of the mixture except the one which has distribution
(μ|s|, σ2 |s|) where
and .
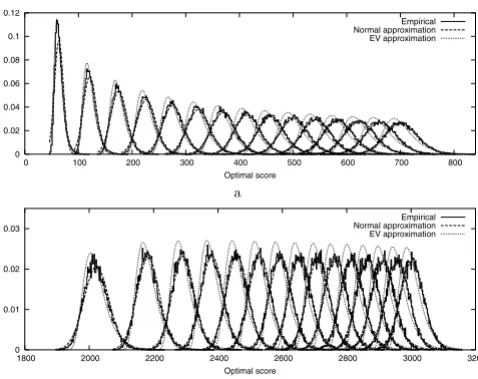
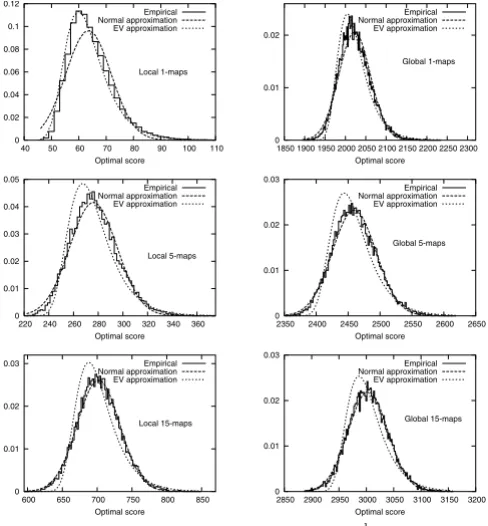
Figure 3 shows the evolution of the empirical density functions of optimal scores of N-maps with N in the range of 1 to 15. In Figure 4, we can see that the empirical den-sity function corresponding to N = 1 in the local case is well approximated by an extreme value distribution. As N increases, even for small values, the empirical tions differ more and more from extreme value distribu-tions and approach quickly normal distribudistribu-tions both in local and global cases. For a given N, the empirical
distri-butions of global optimal scores are closer to the normal approximations than the ones of local optimal scores.
Even if the distribution of optimal scores is of unknown form for intermediate values of N, the empirical observa-tions show that normal approximaobserva-tions fit well except for very small values. This fact leads us to measure signifi-cance of the score of an optimal N-map in terms of Z -val-ues as in [9]. The estimated Z-value of an optimal score
(s, t) is the number of standard deviations separating this score from the mean:
where and denote respectively the
mean and the standard deviation of the optimal scores estimated from a given number of trials of pairs of ran-dom sequences with the same lengths and the same fre-quencies of symbols as s and t. The higher the Z-value of
(s, t), the lower the probability of observing a greater score in the normal approximation. So an optimal N-map of s over t with a higher Z-value will be consider more sig-nificant.
N
μt =
∑
x∈pxmax1≤ ≤p t| |{π[ , ]xtp}σt p t π t μt
p 2
1 2
=
∑
x∈px(max ≤ ≤| |{ [ , ]x }− )(μt | |,s σt2| |)s
(μt| |,s σt2| |)s
μ= ∈ π
∈
∑
x pxmaxy { [ , ]x y}σ2 = π −μ 2
∈ ∈
∑
x px(maxy { [ , ]x y} )N
Z s t s t s t s t
N N N
N
( ( , )) ( , ) ˆ ( , )
ˆ ( , )
= −μ
σ
ˆ ( , )
μN
s t σˆ ( , )N s t
N
Empirical and approximated density functions of the optimal scores of local (a) and global (b) N-maps (N = 1, ..., 15 from left to right)
Figure 3
Empirical and approximated density functions of the optimal scores of local (a) and global (b) N-maps (N = 1, ..., 15 from left to right). The N-maps are computed using BLOSUM62 substitution matrix (made positive by adding a constant term in the global case) over 15000 random sequences with the same lengths and symbol distributions as Case study 5.2.
0 0.02 0.04 0.06 0.08 0.1 0.12
0 100 200 300 400 500 600 700 800
Optimal score
Empirical Normal approximation EV approximation
a
0 0.01 0.02 0.03
1800 2000 2200 2400 2600 2800 3000 3200
Optimal score
Empirical Normal approximation EV approximation
The Z-values must be taken with caution for small N – let us say less than 5 – because the corresponding probabili-ties are underestimated (the tails of the empirical distribu-tions are heavier than the tails of the normal ones when N is smaller). This point is not crucial because we use Z -val-ues to select a relevant number of part N rather than to assess an absolute significance of N-maps, but it could cause an underestimation of the "real" optimal number of parts. When the estimated most significant number of parts is small, it may be useful to check one or two next values.
Because it is time consuming and its accuracy is not rigor-ously evaluated, the way of estimating the significance of an optimal score is not fully satisfying. Analytical approx-imations of the distributions of the optimal scores should be pretty much better but they are beyond the scope of this article.
4 Evaluation
To evaluate the ability of the approach to retrieve seg-ments of sequences related by evolution, we apply a given number of evolutionary events (mutations and shuffles)
to random sequences and we measure the intersection between the homologies known from the artificial evolu-tion and the ones reported by the most significant N-map.
More precisely, given a length L, a number of parts K and an identity proportion α, the protocol follows the steps below for a fixed number of trials.
1. Generate a reference random sequence sa iid with uni-form probabilities over symbols of length L over an alpha-bet of 4 or 20 symbols ("random DNA" or "random protein").
2. Split sa into K equal parts and let sb be the sequence obtained by shuffling these parts with respect to the reverse permutation: (1, 2, ..., K) → (K, K - 1, ..., 1). This step defines a reference K-map of sa over sb.
3. Let be a sequence obtained by mutating (1 - α) × L different positions of sb randomly chosen with uniform probabilities. Here "mutating" implies an actual (and ran-dom) change of symbol, so the identity proportion between sb and is α. The K-map of Step 2 is kept as
ref-erence when mapping sa over .
4. Determine the number M leading to the moat signifi-cant global M-map of sa over (by using Identity substi-tution matrix and by checking the Z-values for M between 1 and K + 10).
5. Compute an optimal global M-map of sa over and measure its intersection with the reference K-map of Step 2, i.e. the number of pairs of positions of sa and which
are associated both in a diagonal of the reference K-map and in a diagonal of the optimal M-map computed. Nor-malize this value by dividing by L = |sa| = | | to get the
intersection ratio.
We do not apply insertion/deletion events over sequences in the protocol because the approach deals with this type of evolution exactly in the same way as the "split and shuf-fle" of Step 2.
Figure 5 shows the evolution of the means of the intersec-tion ratios for K = 2, 5, 10 and 15 parts, as functions of the identity proportion conserved in Step 3, over:
• 500 random DNA sequences of length 500 (Figure 5a),
• 500 random DNA sequences of length 250 (Figure 5b), ′
sb
′ sb
′ sb
′ sb
′ sb
′ sb
′ sb Empirical and approximated density functions of the optimal
scores of: a) local maps, 5-maps and 15-maps, b) global 1-maps, 5-maps and 15-maps
Figure 4
Empirical and approximated density functions of the optimal scores of: a) local maps, 5-maps and 15-maps, b) global 1-maps, 5-maps and 15-maps. The N-maps are computed using BLOSUM62 substitution matrix over 15000 random sequences with the same lengths and symbol frequencies as Case study 5.2.
0 0.02 0.04 0.06 0.08 0.1 0.12
40 50 60 70 80 90 100 110
Optimal score Local 1-maps
Empirical Normal approximation EV approximation
0 0.01 0.02
1850 1900 1950 2000 2050 2100 2150 2200 2250 2300 Optimal score
Global 1-maps Empirical Normal approximation EV approximation
0 0.01 0.02 0.03 0.04 0.05
220 240 260 280 300 320 340 360
Optimal score Local 5-maps Empirical Normal approximation EV approximation
0 0.01 0.02 0.03
2350 2400 2450 2500 2550 2600 2650
Optimal score Global 5-maps
Empirical Normal approximation EV approximation
0 0.01 0.02 0.03
600 650 700 750 800 850
Optimal score Local 15-maps
Empirical Normal approximation EV approximation
0 0.01 0.02 0.03
2850 2900 2950 3000 3050 3100 3150 3200 Optimal score
Global 15-maps Empirical Normal approximation EV approximation
• 500 random protein sequences of length 250 (Figure 5c).
The error bars displayed in Figure 5 report the correspond-ing standard deviations.
The agreement of the results is perfect or almost perfect when the identity proportion is high. The identity propor-tion, the number of parts, the length of the sequences and the number of symbols in the alphabet affect the intersec-tion ratio. This can be explained by the fact that the ability of the approach to associate a given segment of sa with its
artificially evolved counterparts in depends on the
probability of observing another segment in with a better score (here identity proportion). For instance in the case of DNA sequences the expected identity proportion of two segments is 0.25 under the random model used in the protocol. So it is not surprising to observe that the intersection ratio is 0 when the identity proportion artifi-cially required in Step 3 is smaller than this value (Figure 5a and Figure 5b). In the case of protein sequences, the expected identity proportion is 0.05. Eve tunes smaller than in the DNA case and we observe better results for small values of the identity proportion in Figure 5c. Clearly the identity proportion and the length of the sequence affect the probability of associating with the artificial counterpart. The role played by the number of parts is twofold. First, since it determines the length of the segments split in Step 2 of our protocol, it has a direct effect on the preceding probability. Second, it increases the number of boundaries and the possibility of an error when associating positions which are located at the begin-ning or at the end of the segments.
5 Case studies
In the three first case studies, N-maps are represented as pictures where horizontal bold lines represent the sequences compared. The names of the sequences are specified over and under the lines. Each diagonal is repre-sented as two boxes connected by an edge, where each box corresponds to a segment of one of the sequences. The height of the two boxes depends upon the score of the diagonal divided by its length (see Figures 6, 7 and 8). This type of graphical representation is also used in [1,6]. In the last case study we display N-maps as dotplots in order to make the results easily comparable with the ones of [13]. For convenience reasons, the scores represented in all the figures are normalized by being divided by the greatest entry of the substitution matrix.
5.1 Proteins 1
We begin with a case study from [3]. It compares SHK1 protein present in Dictyostelium (SwissProt ID Q9BI25) with ABL1 protein present in human (SwissProt ID ABL1_HUMAN). These proteins share two common domains which occur in a different order in each protein.
When comparing these sequences, the most significant optimal scores are obtained for:
′ sb
′ sb
′ sb
Evolution of the intersection ratio with the identity propor-tion for: a) random DNA sequences of length 500, b) random DNA sequences of length 250, c) random protein sequences of length 250
Figure 5
Evolution of the intersection ratio with the identity propor-tion for: a) random DNA sequences of length 500, b) random DNA sequences of length 250, c) random protein sequences of length 250.
0 0.2 0.4 0.6 0.8 1
0.2 0.3 0.4 0.5 0.6 0.7 0.8 0.9 1
Intersection ratio
Identity proportion
DNA - length 500
2 parts 5 parts 10 parts 15 parts
a
0 0.2 0.4 0.6 0.8 1
0.2 0.3 0.4 0.5 0.6 0.7 0.8 0.9 1
Intersection ratio
Identity proportion
DNA - length 250
2 parts 5 parts 10 parts 15 parts
b
0 0.2 0.4 0.6 0.8 1
0.2 0.3 0.4 0.5 0.6 0.7 0.8 0.9 1
Intersection ratio
Identity proportion
Protein - length 250
2 parts 5 parts 10 parts 15 parts
• N = 5 for both local maps of SHK1 over ABL1 and of ABL1 over SHK1 (Z-values respectively 36.67 and 36.79 – Figure 6a),
• N = 9 for global map of SHK1 over ABL1 (Z-value 19.46 – Figure 6b),
• N = 15 for global map of ABL1 over SHK1 (Z-value 10.79 – Figure 6c).
With the global approach, each part of the sequence to map is associated to the segment which maximizes its gap-less alignment score in the second sequence, even if this
score is small and does not correspond to a "real" hom-ology. As a result, a most significant global N-maps con-tain a greater number of diagonals and look more confusing than with the local case. However, despite the fact that not all the homologies reported are relevant, the global N-maps are interesting because they provide a more complete representation of the common elements. They allow us to consider diagonals formed by segments which are not homologous or not long enough to be selected in an optimal local N-map but which can be meaningful and can suggest an evolutionary history when taken in the whole context. Let us illustrate this point with the 15-map of ABL1 over SHK1 (Figure 6c). The diagonal with the ABL1-interval [1, 27] (the first segment of ABL1 in Figure 6c) is too short to be selected in the most signif-icant optimal local N-map but it can make sense when taking into account the larger diagonal with the ABL1-interval [113,198] (the third segment of ABL1 in Figure 6c) that follows it – not consecutively – in the two sequences. This could suggest the deletion or the insertion of the ABL1-interval [28 – 112] along the evolutionary history of this protein.
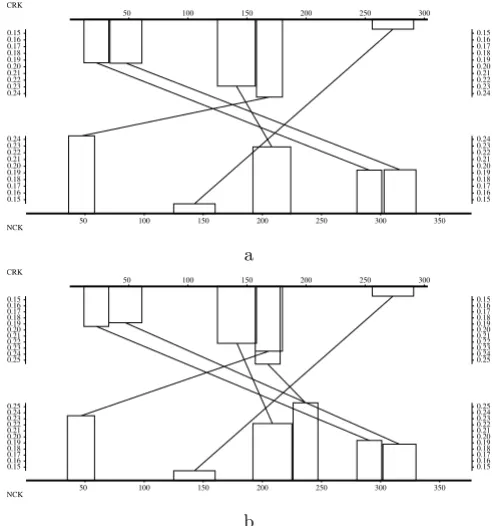
A simple solution to make a global N-map clearer is to select only diagonals with scores greater than a given threshold and/or long enough (see Figure 8 – case study a) An optimal local 5-map of CRK over NCK
Figure 7
a) An optimal local 5-map of CRK over NCK. b) An optimal local 6-map of NCK over CRK. The N-maps are computed using BLOSUM62 substitution matrix.
NCK CRK
50 100 150 200 250 300 350 50 100 150 200 250 300
0.15 0.16 0.17 0.18 0.19 0.20 0.21 0.22 0.23 0.24 0.15 0.16 0.17 0.18 0.19 0.20 0.21 0.22 0.23 0.24 0.15 0.16 0.17 0.18 0.19 0.20 0.21 0.22 0.23 0.24 0.15 0.16 0.17 0.18 0.19 0.20 0.21 0.22 0.23 0.24 a NCK CRK
50 100 150 200 250 300 350 50 100 150 200 250 300
0.15 0.16 0.17 0.18 0.19 0.20 0.21 0.22 0.23 0.24 0.25 0.15 0.16 0.17 0.18 0.19 0.20 0.21 0.22 0.23 0.24 0.25 0.15 0.16 0.17 0.18 0.19 0.20 0.21 0.22 0.23 0.24 0.25 0.15 0.16 0.17 0.18 0.19 0.20 0.21 0.22 0.23 0.24 0.25 b
a) An optimal local 5-map both of SHK1 over ABL1 and of ABL1 over SHK1
Figure 6
a) An optimal local 5-map both of SHK1 over ABL1 and of ABL1 over SHK1. b) An optimal global 9-map of SHK1 over ABL1. c) An optimal global 15-map of ABL1 over SHK1. Local and global maps are computed using BLOSUM62 sub-stitution matrix (made positive by adding a constant term in the global case).
ABL1 SHK1
250 500 750 1000
250 500 0.15 0.20 0.25 0.15 0.20 0.25 0.15 0.20 0.25 0.15 0.20 0.25 a ABL1 SHK1
250 500 750 1000
250 500 0.40 0.45 0.50 0.40 0.45 0.50 0.40 0.45 0.50 0.40 0.45 0.50 b ABL1 SHK1
250 500 750 1000
5.3). In particular, by considering only diagonals with average scores over a threshold in the two global N-maps of this case study, we would obtain pictures very similar to the local 5-map.
Finally, the common domains reported in [3] are both retrieved in the homologies pointed out with the local and the global N-maps: Pkinase domain (positions about 110–200 in ABL1) and SH2 domain (positions about 230–510 in ABL1). The homology involving the SH2 domain is split into 4 diagonals in all the maps. Naturally,
as these two domains are shuffled between the two sequences, a classical alignment could not point out the two homologies at once.
5.2 Proteins 2
We compare two proteins sequences from [6]. A CRK like protein (SwissProt ID P46109) and a NCK adaptor pro-tein (SwissProt ID P16333). This example is given to illus-trate the way of pointing out repeated elements and we consider only local N-maps. The most significant optimal scores are obtained for:
• N = 5 for local N-maps of CRK over NCK (Z-value 17.29 – Figure 7a),
• N = 6 for local N-maps of NCK over CRK (Z-value 18.91 – Figure 7b).
In Figure 7 we can see that the most significant optimal local N-map of NCK over CRK has an extra diagonal with regard to the N-map of CRK over NCK. Apart from this extra diagonal, these two maps share almost the same diagonals set. There are only some small changes on their boundaries, essentially because the non-overlapping con-straint of Definition 1 applies either to one or the other sequence. The extra diagonal is composed of a segment of NCK (positions 226–247), which was not included in the diagonals of the reciprocal map, and a segment of CRK which is also part of another diagonal formed with the positions 35–58 of NCK. Since they are both homologous to a same segment of CRK, we have a clue that these two segments of NCK are repeated elements. Note that retriev-ing all the repeated common elements of two sequences needs generally to map one sequence over another and reciprocally to make sure that all the associations of seg-ments are reported.
5.3 Transposons
We consider here DNA sequences of two transposons ele-ments occurring in two species of Drosophila and studied in [14]: element (GenBank ID AY116625.1) and P-repressor (GenBank ID AF169142.2). We use the BLAST substitution matrix for nucleotides [15] for local N-maps and Identity matrix for global ones.
The most significant optimal scores of N-maps are obtained for:
• N = 5 for local maps both of P-element over P-repressor (Z-value 425.83) and of P-repressor over P-element (Z -value 420.24) corresponding to a same optimal 5-map (Figure 8a),
• N = 19 for global maps of P-element over P-repressor (Z -value 132.75 – Figure 8b),
a) An optimal local 5-map of P-element over P-repressor and reciprocally (BLAST substitution matrix)
Figure 8
a) An optimal local 5-map of P-element over P-repressor and reciprocally (BLAST substitution matrix). b) An optimal glo-bal 15-map of P-element over P-repressor (Identity substitu-tion matrix). c) An optimal global 24-map of P-repressor over P-element (Identity substitution matrix). Diagonals with average score (here identity proportion) smaller than 0.6 were removed from the global N-maps.
P-repressor P-element
500 1000 1500 2000 2500 3000 3500 4000 500 1000 1500 2000 2500 3000 3500
0.77 0.78 0.79 0.80 0.81 0.82 0.83
0.77 0.78 0.79 0.80 0.81 0.82 0.83 0.77
0.78 0.79 0.80 0.81 0.82 0.83
0.77 0.78 0.79 0.80 0.81 0.82 0.83
a
P-repressor P-element
500 1000 1500 2000 2500 3000 3500 4000 500 1000 1500 2000 2500 3000 3500
0.70 0.75 0.80 0.85 0.90 0.95
0.70 0.75 0.80 0.85 0.90 0.95 0.70
0.75 0.80 0.85 0.90 0.95
0.70 0.75 0.80 0.85 0.90 0.95
b
P-repressor P-element
500 1000 1500 2000 2500 3000 3500 4000 500 1000 1500 2000 2500 3000 3500
0.70 0.75 0.80 0.85 0.90
0.70 0.75 0.80 0.85 0.90 0.70
0.75 0.80 0.85 0.90
0.70 0.75 0.80 0.85 0.90
• N = 24 for global maps of P-repressor over P-element (Z -value 119.96 – Figure 8c).
The corresponding maps are represented in Figure 8 in which we keep only the diagonals of the global N-maps with more than 60% of identity. As expected, filtering the diagonals according to their scores makes the pictures clearer and closer to the local one.
Once more, many diagonals are shared between these three N-maps with small variations in their-boundaries. The two global maps show an extra homologous region formed by several diagonals probably too short to be taken into account in the most significant local N-map.
In Figures 6, 7, and 8 we can remark series of diagonals composed of intervals of positions which seem contigu-ous and occur in the same order in the two sequences. They cannot be replaced by a unique diagonal because they are separated by small gaps (too small to appear at the scale of figures). In other words, N-maps computing acts over these positions like a classical alignment.
5.4 Microbial genomes
This case study illustrates how the approach can be applied to comparative genomics. We compare two microbial genomes: Chlamydia trachomatis (GenBank ID AE001273) and Chlamydophila pneumoniae (GenBank ID AE001363) studied in [13].
Each genome is represented by the sequence of its coding genes in the order they occur. Genomes of Chlamydia tra-chomatis and Chlamydophila pneumoniae contain respec-tively 895 and 1052 genes. A gene is identified with the sequence of amino acids of the corresponding protein. Thus, there are as much different symbols as the total length of the two genomes (except the unlikely case where several genes share exactly the same sequence of amino acids).
We compare two sequences/genomes s and t of symbols/ genes which are themselves sequences of amino acids and we need to define a substitution score π between genes (actually this is only required between the genes of the first genome and the genes of the second one). For two sequences of amino acids pa and pb, we set π[pa, pb] to the (highest) identity proportion of an alignment of pa and pb.
As this substitution score is non-negative, we will consider global N-maps.
Because of the particular type of sequences studied here, the estimations of the empirical means and of the stand-ard deviations of the Z-values are computed in a slightly different way from the one described in Section 3. To esti-mate the significance of a N-map score of a genome s over
a genome t, we compute over a given number of trials, the empirical mean and the standard deviation of the optimal scores obtained by mapping a random shuffle of s, over t. The empirical distributions of the optimal scores observed by shuffling the first genome depend a lot on the nature of the substitution scores between the genes of the first genome and the genes of the second one. But in non degenerated cases (when the substitution levels between genes are not all the same) we observe a behaviour close to the one described in Section 3. In this case study the most significant optimal scores of global N-maps are obtained for:
• N = 94 for the global map of Chlamydia trachomatis over Chlamydophila pneumoniae (Z-value 289.61 – Figure 9a),
• N = 97 for the global map of Chlamydophila pneumoniae over Chlamydia trachomatis (Z-value 265.23 – Figure 9b).
Because of the number of diagonals involved in the rear-rangement, which is relatively complex and includes sev-eral inversions, we represent N-maps as dotplots (see Figure 9). The authors of [13] use this type of representa-tion and show similar figures.
The N-map approach allows us to perform genomes com-parison without the initial step of identification of clusters of orthologous genes which is generally a necessary (and sometimes a critical) stage before comparing genomes [16,17]. However, the N-map approach is different to methods such as sorting by reversals because it does not construct an evolutionary history (in the sense that it does not provide a sequence of evolutionary events transform-ing the genomes). It is rather a way to connect conserved segments and can be seen as an alternative to identify orthologous genes. The fact that two genes are associated in a N-map does not depend only on the level of hom-ology between these genes, but also benefits from the lev-els of homology between their respective neighbourhoods.
6 Discussion and future work
Mapping sequences by parts is a simple and effective way to find out similarities between two sequences in the pres-ence of evolutionary events that do not preserve their lin-ear order. This first version was written in order to introduce the idea of "computational mapping of sequences" and needs some technical improvements and extensions such as dealing differently with the bounds of the parts which are mapped or distinguishing different costs for mutational events, to become more realistic from a biological point of view.
scores. So the results obtained with local N-maps should be generally close to the ones obtained by methods based on local (gapped or not) alignments [2,3,6]. The main dif-ference stands in the non-overlapping constraint of Defi-nition 1. From our point of view, the originality of the method actually makes sense with global N-maps. Strengths and weaknesses of global versus local N-maps are analogous to the alignment case. The local approach allows us to report only significant homologies. But a drawback is that the level of significance needs to be fixed a priori, generally by shifting the entries of the substitution matrix more or less negatively. On the other hand, with the global approach (a positive matrix), adding a same positive constant to all the entries of the substitution matrix leaves the resulting optimal N-maps unchanged. A first drawback is that even weak homologies are reported, but this is not a real problem since they can be easily fil-tered. A more serious concern is that a strong homology can be possibly diluted in a longer (but weaker) one.
The method can be extended in several directions. A first natural way is to allow gaps while mapping each part of the first sequence. Basically it can be done by extending the definition of diagonal to not constrain the lengths of the two segments to be equal and by defining the score of an "extended diagonal" as the alignment score (penaliz-ing gaps) of its two segments. The algorithms comput(penaliz-ing the maximal scores and optimal N-maps with extended
diagonal scores (computed with linear or affine gap pen-alties) are essentially the same as Alg_1 and Alg_2. In par-ticular, their orders of time and memory space complexities do not change. In fact, the current imple-mentation of the method provides an option to align parts with a linear gap penalty. Nevertheless, we presented here the method with the gapless case because it appears conceptually clearer and does not need any parameter such as a gap penalty (this parameter is critical for the dis-tributions of the optimal scores and they appear more confusing in the gapped case).
Further in the same direction, an interesting possibility of extension is to associate different kinds of penalties for insertions/deletions, inversions and shuffling, and to compute the greatest score of a map of s over t according to a substitution matrix and these penalties. From an algo-rithmic point of view and with reasonable kinds of penal-ties, this can be done by Dynamic Programming equations analogous to the ones used in Alg_1. These equations could be directly applied to compute the best score and an optimal set of diagonals of a "penalized map" of s over t with complexity O (|s| × |t|). Setting the different values of penalties is a natural way to introduce biological knowledges in the approach but this needs a strong expertise in sequence analysis. We are interested in collaborations in this direction.
a) Dotplot representation of an optimal global 94-map of Chlamydia trachomatis over Chlamydophila pneumoniae Figure 9
a) Dotplot representation of an optimal global 94-map of Chlamydia trachomatis over Chlamydophila pneumoniae. b) Dotplot rep-resentation of an optimal global 97-map of Chlamydophila pneumoniae over Chlamydia trachomatis. Darker is a diagonal, higher is its length-normalized score.
Chlamydophila pneumoniae Chlamydia trachomatis
250 500 750 1000 250
500 750
Chlamydophila pneumoniae Chlamydia trachomatis
250 500 750 1000 250
500 750
![Figure 1([11,13], [5,7])] of Representation of the 3-map [([2, 3], [1,2]), ([4,8], [7,11]), s over tRepresentation of the 3-map [([2, 3], [1,2]), ([4,8], [7,11]), ([11,13], [5,7])] of s over t](https://thumb-us.123doks.com/thumbv2/123dok_us/352333.1527776/3.612.309.557.87.181/figure-representation-map-s-trepresentation-map-s-t.webp)