R E S E A R C H
Open Access
Encircling the regions of the
pharmacogenomic landscape that
determine drug response
Adrià Fernández-Torras
1, Miquel Duran-Frigola
1*and Patrick Aloy
1,2*Abstract
Background:The integration of large-scale drug sensitivity screens and genome-wide experiments is changing the field of pharmacogenomics, revealing molecular determinants of drug response without the need for previous knowledge about drug action. In particular, transcriptional signatures of drug sensitivity may guide drug repositioning, prioritize drug combinations, and point to new therapeutic biomarkers. However, the inherent complexity of transcriptional signatures, with thousands of differentially expressed genes, makes them hard to interpret, thus giving poor mechanistic insights and hampering translation to clinics.
Methods:To simplify drug signatures, we have developed a network-based methodology to identify functionally coherent gene modules. Our strategy starts with the calculation of drug-gene correlations and is followed by a pathway-oriented filtering and a network-diffusion analysis across the interactome.
Results:We apply our approach to 189 drugs tested in 671 cancer cell lines and observe a connection between gene expression levels of the modules and mechanisms of action of the drugs. Further, we characterize multiple aspects of the modules, including their functional categories, tissue-specificity, and prevalence in clinics. Finally, we prove the predictive capability of the modules and demonstrate how they can be used as gene sets in
conventional enrichment analyses.
Conclusions:Network biology strategies like module detection are able to digest the outcome of large-scale pharmacogenomic initiatives, thereby contributing to their interpretability and improving the characterization of the drugs screened.
Background
Gene expression profiling has become a mainstay ap-proach to characterize cell properties and status, unveil-ing links between gene activities and disease phenotypes. Early efforts were channeled into discovering transcrip-tional signatures that are specific to a disease state. This work involved the comparison of a relatively small num-ber of diseased and healthy samples [1]. Although pro-viding a rich account of disease biology, these studies have failed to yield better drug therapies, as causality and response to drug perturbations cannot be inferred
directly from two-state (diseased vs. healthy) differential gene expression analysis [2,3]. To address this issue, ini-tiatives have flourished to profile the basal gene expres-sion levels of hundreds of cell lines, together with their response to treatment over an array of drug molecules using a simple readout such as growth rate [4–7]. Pro-vided that the panel of cell lines is large enough, this ap-proach allows for a new type of gene expression analysis where basal expression levels are correlated to drug re-sponse phenotypes. A series of recent studies demon-strate the value of this demon-strategy for target identification, biomarker discovery, and elucidation of mechanisms of action (MoA) and resistance [8–13].
The largest cell panels available today are derived from cancerous tissues, since a crucial step towards personal-ized cancer medicine is the identification of transcrip-tional signatures that can guide drug prescription.
© The Author(s). 2019Open AccessThis article is distributed under the terms of the Creative Commons Attribution 4.0 International License (http://creativecommons.org/licenses/by/4.0/), which permits unrestricted use, distribution, and reproduction in any medium, provided you give appropriate credit to the original author(s) and the source, provide a link to the Creative Commons license, and indicate if changes were made. The Creative Commons Public Domain Dedication waiver (http://creativecommons.org/publicdomain/zero/1.0/) applies to the data made available in this article, unless otherwise stated.
* Correspondence:miquel.duran@irbbarcelona.org; patrick.aloy@irbbarcelona.org
1Joint IRB-BSC-CRG Program in Computational Biology, Institute for Research
in Biomedicine (IRB Barcelona), The Barcelona Institute of Science and Technology, Barcelona, Catalonia, Spain
However, current signatures are composed of several hundred genes, thereby making them difficult to inter-pret, harmonize across platforms, and translate to clin-ical practice [14–16]. Recent assessment of sensitivity signatures for over 200 drugs [9] revealed that key genes include those involved in drug metabolism and trans-port. Intended therapeutic targets, though important, are detected in only a fraction of signatures, and cell line tis-sue of origin has been identified as a confounding factor throughout the signature detection procedure. In prac-tice, the length of the signatures largely exceeds the number of sensitive cell lines available for each drug, which often yields inconsistent results between cell panels from different laboratories [14]. The current chal-lenge is to filter and characterize transcriptional signa-tures so that they become robust, informative, and more homogeneous, while still retaining the complexity (hence the predictive power) of the original profiles [17].
Network biology offers means to integrate a large amount of omics data [18]. Most network biology capi-talizes on the observation that genes whose function is altered in a particular phenotype tend to be co-expressed in common pathways and, therefore, co-localized in specific network regions [19]. Following this principle, it has been possible to convert genome-wide signatures to network signatures, or mod-ules, that are less noisy and easier to interpret [20]. Raphael and co-workers, for instance, developed an algo-rithm to map cancer mutations on biological networks and identify “hot” regions that distinguish functional (driver) mutations from sporadic (passenger) ones [21]. Califano’s group combined gene expression data with regulatory cellular networks to infer protein activity [22]. Overall, network-based methods come in many flavors and offer an effective framework to organize the results of omics experiments [23].
While many genes and proteins have enjoyed such a network-based annotation (being circumscribed within well-defined modules such as pathways and biological processes), drug molecules remain mostly uncharacter-ized in this regard. For a number of drugs, the mechan-ism of action is unclear [3] and off-targets are often discovered [24]. Recent publications of drug screens against cancer cell line panels, and the transcriptional signatures that can be derived from there, provide a broader view of drug activity and enable the full imple-mentation of network biology techniques. Here we undertake the task of obtaining and annotating tran-scriptional modules related to 189 drugs. We show how these modules are able to capture meaningful aspects of drug biology, being robust to inherent biases caused by, for example, the cell’s tissue of origin, and having a tight relationship to mechanisms of action and transportation events occurring at the membrane. Finally, we perform a
series of functional enrichment analyses, which contrib-ute to a better understanding of the molecular determi-nants of drug activity.
Methods
Data preparation and drug-gene correlations
We collected gene expression and drug response data from the GDSC resource (https://www.cancerrxgene. org). We first discarded those genes whose expression levels were low or stable across cell lines (Add-itional file 1: Figure S1A). To this end, we analyzed the distribution of basal expression of each gene in every CCL and filtered out those with an expression level below 4.4 (log2 units) across the panel (see Additional file 1: Figure S1B for a robustness analysis). Regarding drug response data, GDSC provides measurements of cell survival at a range of drug concentrations (area under the dose-response curve (AUC)). Since this meas-ure is inversely proportional to drug sensitivity (i.e., the more sensitive the cell, the shorter its survival), we used the 1-AUC as a measure of potency. Thus, positive cor-relations denote drug sensitivity caused by gene overex-pression while negative correlations indicate that sensitivity is associated with gene underexpression.
Recent studies report a confounding effect of certain tissues in the global analysis of drug-gene correlations [9]. In order to identify these potential biases in our dataset, we performed a principal component analysis (PCA) on the matrix of raw drug-gene correlations (Pearson’s between 1-AUC and gene expression units). Then, we correlated the loadings of the first PC with gene expression values for each CCL. Finally, we fil-tered out CCLs belonging to tissues that were strongly correlated to the drug-gene correlation profiles (Add-itional file 1: Figure S2A). We removed leukemia, mye-loma, lymphoma, neuroblastoma, small cell lung cancer (SCLC), and bone CCLs. In addition, we considered only drugs with sensitivity measurements available for at least 400 CCLs, as recommended by Rees et al. [9].
After this filtering process, we recalculated, for each drug-gene pair, the Pearson’s correlation between basal gene expression and 1-AUC drug potencies across CCLs. We applied Fisher’s z-transformation to the correlation coefficients in order to account for variation in the num-ber of CCLs available for each drug [25]. Overall, we ob-tained positive and negative drug-gene correlations for 217 drugs and 15,944 genes across a total of 671 CCLs. Drug-gene correlations (zcor) beyond ± 3.2 were
consid-ered to be significant (Additional file1: Figures S1C and S1D shows that this cutoff is a robust choice).
Frequently correlated genes
cumulative distribution (Additional file 1: Figure S3). Genes at the 5% end of the distribution were considered to be “frequently correlated genes” (FCGs). We found 869 positive and 799 negative FCGs, which were re-moved from further analyses. Finally, we performed en-richment analyses on those genes using the Gene Ontology database [26] and the DAVID toolbox (https:// david.ncifcrf.gov/summary.jsp) (hypergeometric tests).
Tissue-specific correlations
First, we split the CCL panel into sets of CCLs belonging to the same tissue. We then calculated drug-gene corre-lations (zcor) separately for each of the 13 tissues
repre-sented in our dataset. In order to verify that measures of positively correlated genes (PCGs) and negatively corre-lated genes (NCGs) were consistent across tissues, we calculated the median zcor across tissues for each
drug-PCG/NCG pair. In general, tissue-specific correla-tions had the same“direction”(i.e., same sign of zcor) as
the global correlation used throughout the study (Add-itional file1: Figure S4A, left panel).
Drug-target correlations
We obtained drug targets from the GDSC resource (dis-ambiguating them with DrugBank [27], when necessary). We assigned at least one target to 202 of the 217 drugs. We focused on the zcor correlation of the targets to
check whether target expression (positively) correlates with drug sensitivity. When more than one target was annotated per drug, we kept the maximum correlation. To validate the statistical significance of this measure, we randomly sampled genes (corresponding to the num-ber of known targets per drugs; here again, we kept the maximum correlation). This process was repeated 1000 times for each drug. The mean and the standard devi-ation of this null distribution were used to derive a z-score, making results comparable between drugs.
Drug module detection
After removing frequently correlated genes from the list of drug-gene correlations, we kept 182 [median; Q1: 84, Q3: 372] positively and 122 [median; Q1: 41, Q3: 337] negatively correlated genes (PCGs, NCGs) per drug. Fur-ther, we used correlation values (zcor) to run a gene-set
enrichment analysis (GSEA) [28] for each drug and iden-tify the genes that participate in enriched Reactome pathways [29, 30]. We only considered Reactome path-ways composed of at least 5 genes. Then, for each drug, we kept the significantly correlated genes found in any of the enriched pathways (P value < 0.01). The resulting GSEA-filtered list of genes retained 100 [median; Q1: 49, Q3: 277] positive and 77 [median; Q1: 30, Q3: 221] negative correlations per drug. Then, taking the zcor
values as input scores, we submitted the GSEA-filtered
list of genes to HotNet2 [31], using a high-confidence version of STRING [32] (confidence score > 700). We ran HotNet2 iteratively, keeping the largest module and removing its genes for the next iteration, until the mod-ules had fewer than 5 genes or were not statistically sig-nificant (p value > 0.05). To recall strong drug-gene correlations “proximal” to the drug modules (missed, most likely, by the incomplete coverage of Reactome), we used the DIAMOnD module-expansion algorithm [29]. We considered only genes that (i) were correlated to the drug response, (ii) were not present in any of the Reactome pathways, and (iii) were in the top 200 closest genes to the module, according to DIAMOnD (this cut-off was proposed by the authors of DIAMOnD based on orthogonal functional analyses). Hence, we obtained at least one positively correlated module for 175 of the drugs (48 genes [median; Q1: 23, Q3: 83]) and one nega-tively correlated module for 154 of the drugs (40 genes [median; Q1: 21, Q3: 78]). Robustness analysis of this procedure is found in Additional file 1: Figure S1D. A GMT list of the drug modules can be found in Add-itional file 2. The correlation values of the genes in the drug modules are available in Additional file3.
Distances between drug targets and modules
DIAMOnD [29] provides a list of genes sorted by their network-based proximity to the module. Accordingly, we retrieved from the STRING interactome the top clos-est 1450 genes (~ 10% of the largclos-est connected compo-nent of the network) for every drug module. We then checked the ranking of drug targets in the resulting DIAMOnD lists, (conservatively) taking the median value when more than one target was available. To as-sess the proximity of drug targets to the modules, we measured distances to three different sets of random proteins. The first random set corresponded to the STRING proteome. For the second, we collected all genes defined as Tclin or Tchem in the Target Central Resource Database [33] (i.e., “druggable proteins”). Fi-nally, the third random set included all pharmacologic-ally active drug targets reported in DrugBank (https:// www.drugbank.ca/).
Distances between modules
network. When the distribution constraint could not be fully met, we used the DIAMOnD algorithm [29] to re-trieve the remaining genes (50% of the genes at max-imum). We repeated this process to obtain 10 random modules of each size. Next, we distributed the random modules into ranges (intervals) of 5 (i.e., from 10 to 14 genes, from 15 to 19, etc.; 50 random modules per inter-val). Then, for each pair size, we randomly retrieved 100 pairs of modules and calculated the network-based dis-tance between them. The mean and standard deviation of the distances at each pair size were used to normalize the observed distances, correspondingly (z-score normalization) (we checked that 100 random pairs were sufficient to approximate the mean and standard devi-ation of the populdevi-ation). The more negative the network distance (dnet), the more proximal the modules are. We
provide the network distances as an Additional file4.
Drug response prediction using drug modules
We performed drug response predictions in the GDSC dataset by using drug modules (only first PCMs and NCMs, to make results comparable between drugs). We devised a simple GSEA-like predictor in which CCLs were evaluated for their up-/downregulation of the mod-ules, correspondingly. To this end, we first normalized the expression of each gene across the CCL panel (z-score). Then, for each drug, we ranked CCLs based on the GSEA enrichment scores (ES), taking drug mod-ules as gene sets. To evaluate the ranking, we chose the top 25, 50, and 100 CCLs based on theknowndrug sen-sitivity profile. Performance was evaluated using the AUROC metric. Results were compared to those ob-tained with positively and negatively correlated genes (PCG, NCG) from the full signatures (zcorbeyond ± 3.2).
To check whether modules derived from GDSC generalize to other CCL panels, we applied the same procedure to the Cancer Therapeutics Response Portal (CTRP) (https://ocg.cancer.gov/programs/ctd2/data-por-tal). As done with the GDSC panel, we removed all CCLs derived from neuroblastomas, hematopoietic, bone, and small cell lung cancer tissues, leaving a total of 636 CCLs, 397 in common with our GDSC panel (67 drugs in common). Drug response predictions for CTRP were performed as detailed above. We used the best ES among all modules associated with the drug. In addition, we did the analysis using CCLs exclusive to CTRP (i.e., not shared with the GDSC panel).
Module enrichment in Hallmark gene sets
We downloaded the Hallmark gene set collection from the Molecular Signature Database (MSigDB) of the Broad Institute http://software.broadinstitute.org/gsea/ index.jsp). We evaluated each gene set independently using a hypergeometric (Fisher’s exact) test (first and
second modules were merged, when applicable; the gene universe was that of GDSC). Enrichments can be found in the Additional file5.
Drug module enrichments in the TCGA cohort
We downloaded gene expression data (median z-scores) for 9788 patients and 31 cancer tissues from the Pan-Cancer Atlas available in the cBioPortal resource (http:// www.cbioportal.org). “Presence” or “expression” of the module in each patient was evaluated using GSEA (P value < 0.001), ensuring that the direction (up/down) of the enrichment score corresponded to the“direction” of the module (PCM/NCM). For a complete list of enrich-ment results, please see Additional file6 (results are or-ganized by tumor type). Further, to identify associations between drug modules and cancer driver genes, we checked whether patients“expressing module of drug X” (P value < 0.001) were “harboring a mutation in driver gene Y” (Fisher’s exact test). We considered 113 driver genes (obtained as described in [36], using the “known” flag) (Additional file7).
Characterization of drug modules
In order to characterize drug modules from different perspectives, we designed 21 features belonging to the following categories: (i)General featuresderived directly from the pharmacogenomics panel, (ii)Network features related to network measures such as topological proper-ties, and (iii)Biological featuresencompassing a series of orthogonal analyses related to drug biology. For more information, please see Additional file 8 and its corre-sponding legend.
Results and discussion
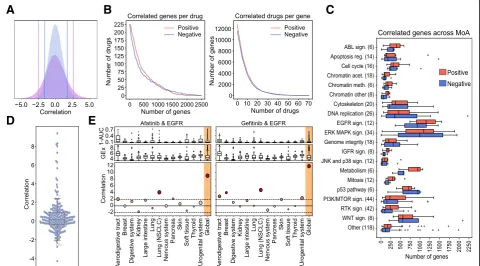
Following the conventional strategy to analyze phar-macogenomic datasets, we calculated independent drug-gene associations simply by correlating the expres-sion level of each gene to the potency of each drug (area over the growth-inhibition curve; 1-AUC) across the CCL panel. We used a z-transformed version of Pear-son’s , as recommended elsewhere [25]. Figure 1a shows the pair-wise distribution of the z-correlation (zcor) measures between the 15,944 genes and the 217
drugs. We validated the correlations identified in the GDSC panel on an independent set by applying the same protocol to the Cancer Therapeutic Response Portal (CTRP) panel [9] (Additional file 1: Figure S4B). To identify the strongest drug-gene associations, we set a cutoff of ± 3.2 zcor, based on an empirical null
distribu-tion obtained from randomized data (see Addidistribu-tional file 1: Figure S1C and the “Methods” section). Please note that this is a widely adopted procedure that is not de-signed to detect single drug-gene associations (which would require multiple testing correction) [37]. Instead,
and similar to signature identification in differential gene expression analysis, the goal is to identify sets of genes that are (mildly) correlated with drug response. For each drug, we obtained a median (Med) of 249 positively cor-related genes [first quartile (Q1): 120, third quartile (Q3): 584], and Med of 173 negatively correlated genes [Q1: 59, Q3: 484] (Fig. 1b). Some drugs, like the BRAF inhibitor dabrafenib, or the EGFR inhibitor afatinib, had over 1500 positively and negatively correlated genes, while others, like the antiandrogen Bicalutamide or the p38 MAPK inhibitor Doramapimod, had hardly a dozen. We observed that the number of genes that correlate with drug response strongly depends on the drug class (Fig. 1c), EGFR and ERK-MAPK signaling inhibitors be-ing the classes with the largest number of associated genes, and JNK/p38 signaling and chromatin histone acetylation inhibitors being those with the fewest corre-lations. This variation may be partially explained by the range of drug potency across the CCL panel, as it is
“easier” to detect drug-gene correlations when the drug
A
D
E
B
C
has a wide sensitivity spectrum (Additional file 1: Figure S5).
Similarly, analysis of independent drug-gene correla-tions suggests that some genes are positively correlated to many drugs. For instance, we found 5% of the genes to be associated with more than 10% of the drugs (Fig.1b and Additional file1: Figure S3). The transcripts of these
“frequent positively correlated genes” are enriched in
membrane processes, specifically focal adhesion (Pvalue < 5.2 × 10⁻¹²) and extracellular matrix (ECM) organization (P value < 5 × 10⁻¹⁶), including subunits of integrin, caveolin, and platelet-derived growth factors (PDGFs). These genes determine, among others, the ac-tivation of Src kinases [38–41]. Overall, ECM proteins are known to play an important role in tumor prolifera-tion, invasion, and angiogenesis [42, 43] and are often involved in the upstream regulation of cancer pathways [44] such as PI3K/mTOR [38–40], MAPK [39], and Wnt signaling [45], and in cell cycle and cytoskeleton regula-tion [46]. It is thus not surprising that ECM genes deter-mine drug response in a rather unspecific manner.
On the other hand, “frequent negatively correlated genes” are associated with small molecule metabolism (xenobiotic metabolic processes,Pvalue < 3.2 × 10⁻³). In this group, we found, among others, the cytochrome CYP2J2 and the GSTK1 and MGST glutathione transfer-ases, which are highly expressed in cancers and known to confer drug resistance through their conjugating ac-tivity [47–50]. Following other studies that reported similar results [9], we checked for the presence of multi-drug transporters (MDTs). Reassuringly, we found the efflux pump transporter ABCC3 and a total of 27 differ-ent solute carriers (SLCs) to be negatively correlated to the potency of many drugs. Of note, we also found the ABCA1 transporter and other 8 SLCs to be among the frequent positively correlated genes, thus emphasizing the key role of transporters and carriers in determining drug potency.
All of the above suggests that systematic analysis of in-dependent drug-gene correlations is sufficient to high-light unspecific determinants of drug sensitivity and resistance (i.e., frequent positively and negatively corre-lated genes). However, while these determinants are rec-ognized to play a crucial role, they do not inform targeted therapies, as they are usually unrelated to the mechanism of action of the drug. Thus, we assessed whether measuring drug-gene correlations would also be sufficient to elucidate drug targets, i.e., we tested whether the expression level of the target correlates with the potency of the drug. Since most drugs had more than one annotated target, to measure significance, we randomly sampled 1000 times an equal number of genes and derived an empirical z-score (see the “Methods” section). Figure 1d shows that the expression level of
most drug targets didnot correlate with drug response. In fact, only ~ 10% of the drugs had “positively corre-lated targets”(z-score > 1.9,Pvalue ~ 0.05). Remarkably, the 6 EGF pathway inhibitors in our dataset were among these drugs, as were 3 of the 4 IGF pathway and 3 of the 21 RTK pathway inhibitors. We noticed that the molecu-lar targets for these pathways were usually cell surface receptors, e.g., EGFR, IGFR, ALK, ERBB2, MET, and PDGFRA. Overall, of the 20 drugs with positively corre-lated targets, 13 bind to cell surface receptors, showing a propensity of drug-gene correlations to capture mem-brane targets (odds ratio = 15.13,Pvalue = 1.9 × 10⁻⁷). In Additional file 1: Figure S6, we show how this trend is driven mostly by the over-expression of the target on the cell surface.
The relatively small number of positively correlated targets illustrates how the analysis of expression levels alone is insufficient to reveal MoAs, especially when the drug target is located downstream of the cell surface re-ceptors in a signaling pathway. Some authors have sug-gested that the tissue of origin of the cells might play a confounding role in defining drug response signatures. To address this notion, we repeated the calculation of Pearson’szcor correlations separately for each of the 13
tissues in our dataset. In general, the trends observed at the tissue level were consistent with the global trends, although tissue-specific correlations were milder due to low statistical power (i.e., few cell lines per tissue) (Add-itional file 1: Figure S4A, right panel). Accordingly, we confirmed that none of the tissues had a globally domin-ant effect on the measures of drug-gene correlations (Additional file 1: Figure S2B) and verified that certain tissue-specific associations were still captured by the analysis. For instance, going back to the targeting of EGFR (which was positively correlated with Afatinib and Gefinitib), we show in Fig. 1e that the “global” correl-ation can be partly attributed to non-small cell lung can-cer (NSCLC) cells (zcor > 1.96, P value < 0.05). Indeed,
afatinib and gefitinib have an approved indication for NSCLC. Both drugs correlate with EGFR also in the aerodigestive tract, an observation reported in an inde-pendent study dedicated to the discovery of drug-tissue/ mutation associations (ACME) [7]. Moreover, and con-sistent with recent findings [51–54], gefitinib has a sig-nificant correlation to EGFR in breast cancers, whereas afatinib correlates with this target in pancreatic CCLs. Afatinib, in turn, is associated with ERBB2 in breast CCLs, as also confirmed by ACME analysis (Additional file1: Figure S4C).
From drug-gene correlations to drug modules
signatures contain unspecific and indirect correlations that may mislead mechanistic interpretation. Recent ad-vances in network biology precisely tackle these prob-lems, as they can (i) filter signatures to make them more functionally homogeneous and (ii) allow for the meas-urement of network distances so that genes proximal to the target can be captured and connected to it, even if the expression of the target itself is not statistically asso-ciated with the drug.
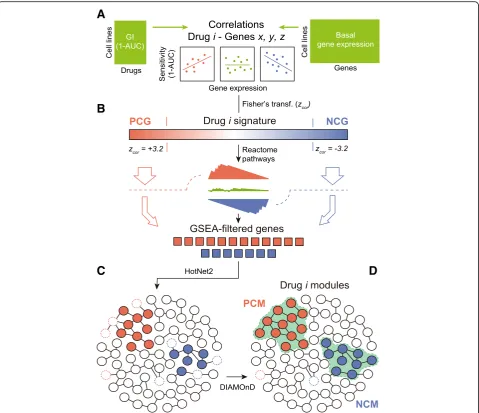
Hence, we set to mapping drug-gene correlations onto a large protein-protein interaction (PPI) network, retain-ing only genes that could be grouped in network mod-ules (i.e., strongly interconnected regions of the network). In the “Methods” section, we explain in detail the module detection procedure. In brief, starting from drug-gene correlations (Fig. 2A), we first filtered out those genes whose expression was frequently (and unspecifically) correlated to the potency of many drugs (Additional file 1: Figure S3). This reduced the number of associations to 182 [median; Q1: 84, Q3: 372] posi-tively and 122 [median; Q1: 41, Q3: 337] negaposi-tively cor-related genes per drug, respectively. Next, in order to identify genes acting in coordination (i.e., participating in enriched Reactome pathways [29, 30]), we adapted the gene set enrichment analysis (GSEA) algorithm [28] to handle drug-gene correlations (instead of gene ex-pression fold-changes) (Fig. 2B). The resulting GSEA-filtered list of genes kept 100 [median; Q1: 49, Q3: 277] positive and 77 [median; Q1: 30, Q3: 221] negative correlations per drug. After this filtering, we submitted this list to HotNet2 [31], a module detection algorithm that was originally developed for the identifi-cation of recurrently mutated subnetworks in cancer pa-tients (Fig. 2C; Additional file 1: Figure S7 shows the importance of the Reactome-based filtering previous to HotNet2). As a reference network (interactome) for Hot-Net2, we chose a high-confidence version of STRING [32], composed of 14,725 proteins and 300,686 interac-tions. HotNet2 further filtered the list of genes corre-lated to each drug, keeping only those that were part of the same network neighborhood. Finally, we used the DIAMOnD module expansion algorithm [29] to recover strong drug-gene correlations that had been discarded along the process. Although this step made a relatively minor contribution to the composition of the modules (less than 5% of the genes; Additional file 1: Figure S8), we did not want to lose any strong association caused by the limited coverage of the Reactome database (Fig.2D).
Our pipeline yielded at least one“positively correlated module”(PCM) for 175 of the 217 drugs (48 genes [me-dian; Q1: 23, Q3: 83]). Similarly, we obtained“negatively correlated modules” (NCMs) for 154 of the drugs (40 genes [median; Q1:21, Q3:78]). Thus, compared to the original signatures, drug modules are considerably
smaller (80% reduction) (Fig.3a) and are commensurate with manually annotated pathways in popular databases (Additional file 1: Figure S9). For roughly two thirds of the drugs, we obtained only one PCM and one NCM. For the remaining drugs, a second (usually smaller) module was also identified (Additional file 1: Figure S10A). The complete list of drug modules can be found in Additional file 2. Pair-wise drug-gene correlations of the modules are listed as Additional file3. Additionally, the code of the module-detection pipeline is available at: https://github.com/sbnb-lab-irb-barcelona/GDSC-drug-modules.
Drug modules are tightly related to mechanisms of action To assess the mechanistic relevance of drug modules, we measured their distance to the corresponding drug targets, i.e., we formulated the hypothesis that drug tar-gets should be “proximal” to dysregulated network re-gions. To this end, we used the DIAMOnD algorithm again [29], this time to retrieve, for each drug, a list of genes ranked by their proximity to the corresponding drug module(s) (see the “Methods” section). Figure 3b shows that drug targets are remarkably up-ranked in these lists, making them closer to the drug modules than any other set of random proteins, including druggable genes and pharmacological receptors [33], which usually have prominent positions in the PPI network due to the abundant knowledge available for them. In 82% of the PCMs, the corresponding targets were among proximal proteins (top decile), which means a dramatic increase in mechanistic interpretability compared to the 12.25% of drugs that could be linked to their targets via conven-tional analysis of drug-gene correlations.
A unique feature of drug modules is that
network-based distances can be natively measured be-tween them [34]. We computed the distance bebe-tween drug modules pair-wise (Additional file 4) and grouped them by drug class (Fig. 3c) (see the “Methods” section and alternative statistical treatments in Additional file1: Figure S11). The diagonal of Fig.3cclearly indicates that drugs belonging to the same category tend to have
“proximal” modules (some of them in a highly specific
Drug modules retain the ability to predict drug response We have shown that drug modules are related to the MoA of the drug, but the question remains as to the ex-tent to which they retain the predictive capabilities of the full transcriptional profiles/signatures. In the CCL setting, gene expression profiles are valuable predictors of drug response [5, 11, 60] and crucially contribute to state-of-the-art pharmacogenomic models. To test whether our (much smaller) drug modules retained dictive power, we devised a simple drug sensitivity pre-dictor based on the GSEA score (see the “Methods” section). In brief, given a drug, we tested whether cell
linessensitiveto a certain drug were enriched in the cor-responding drug modules. We expect genes in PCMs to be over-expressed in sensitive cell lines and those in NCMs to be under-expressed. Analogously, we took the positively and negatively correlated genes from the full drug-gene associations (signatures) and also performed a GSEA-based prediction. To nominate a cell “sensitive” to a certain drug, we ranked CCLs by their sensitivity and kept the top nCCLs, nbeing 25, 50, or 100, based on the distribution of sensitive cell lines provided by the authors of the GDSC (Additional file 1: Figure S12A). This simple binarization is, in practice, proportional to
A
B
C
D
more sophisticated “sensitive/resistant” categorizations such as the waterfall analysis [14], and it yields predic-tion performance metrics comparable between drugs.
Additional file 1: Figure S13 suggests that, when ap-plied to the GDSC, drug module enrichment analysis can classify sensitive cell lines with high accuracy, espe-cially for the top 25 sensitive cell lines (area under the ROC curve (AUROC) 0.77), which is a notable achieve-ment considering that drug modules are 80% smaller than the original signatures. To assess the applicability of our modules outside the GDSC dataset, we performed an external validation with the CTRP panel of cell lines. About 37% of our drugs were also tested in this panel.
In CTRP, drug sensitivity is measured independently of GDSC, which poses an additional challenge for predic-tion as a result of experimental inconsistencies [14]. Of the CCLs, 397 are shared between GDSC and CTRP, and gene expression data are also measured independ-ently. We performed the GSEA-based sensitivity predic-tion for all CTRP CCLs. Figure 3d and e show the distribution of prediction performances for the 70 drugs, and illustrative ROC curves corresponding to four drugs (namely Daporinad, Vorinostat, I-BET-762 and Doce-taxel), respectively. We found that, when focusing on the top 25 sensitive CCLs, over a quarter of the drugs had AUROC > 0.7, including Daporinad. Acceptable
A
C
B
E
D
(AUROC > 0.6) predictions were achieved for half the cases (e.g., Vorinostat and I-BET-762), which is a com-parable result to recent attempts to translate sensitivity predictors between different CCL panels [61]. For the remaining drugs, predictive performance did not differ to random expectation (AUROC < 0.6) (e.g., docetaxel). Notably, performance declined only slightly when con-sidering CCLs that were exclusive to the CTRP panel (i.e., not part of the GDSC dataset) (Fig.3d, blue boxes). The figure was comparable, if not better, to that ob-tained using full signatures (PCGs and NCGs) (Add-itional file1: Figure S13, gray boxes). These observations support previous recommendations to pre-filter pharma-cogenomic data based on prior knowledge [62] (Add-itional file1: Figure S14).
Module-based characterization of drugs
Since drug modules are highly connected in biological networks, they are expected to be (at least to some ex-tent) functionally coherent and easier to interpret. Ac-cordingly, we tested the enrichment of drug modules in a collection of high-order biological processes (the Hall-mark gene sets) available from the Molecular Signatures Database (MSigDB) [63]. Additional file 1: Figure S15A shows that the number of enriched Hallmark gene sets depends upon the MoA of the drug. The results of the enrichment analysis are given in Additional file 5and as an interactive exploration tool based on the CLEAN methodology (Additional file 9; https://figshare.com/s/ 932dd94520d4a60f076d) [64]. We chose three drug clas-ses to illustrate how to read these results, namely drugs targeting mitosis, RTK signaling inhibitors, and ERK-MAPK signaling inhibitors (Fig.4a).
Drugs targeting mitosis have modules enriched in cell cycle and replication processes (Fig.4a, top). Specifically, genes related to the Myc transcription factor are over-represented in three of the drug modules (NPK76-II-72-1, GSK1070916, and MPS-1-IN-1). The modules of these drugs have a rather distinct compos-ition, NPK76-II-72-1 having the largest coverage of
Myc-related genes and being, together with
MPS-1-IN-1, related to both Myc1 and Myc2 processes. In Additional file1: Figure S15B, we show how, for these two drugs, cell line sensitivity is dependent on Myc ex-pression levels.
In contrast to mitosis inhibitors, drugs targeting the RTK pathway are enriched in biological processes out-side the nucleus (Fig.4a, middle), among these hypoxia and the epithelial-mesenchymal transition (EMT). Both mechanisms are known to be associated with tyrosine kinases [65,66]. Interestingly, a subgroup of RTK inhibi-tors (namely ACC220, CEP-701, NVP-BHG712, and MP470) is characteristically associated with the PI3K-AKT-mTOR signaling cascade. With the exception
of NVP-BHG712, these inhibitors have the tyrosine kin-ase FLT3 as a common target [67,68]. Deeper inspection of FLT3 inhibitors reveals module proximities to certain
PI3K inhibitors (e.g., GDC0941), and the
PI3K-AKT-mTOR pathway is enriched in ERBB2 inhibi-tors as well (Additional files4and5).
As for ERK-MAPK pathway inhibitors, we observed a total of 17 enriched Hallmarks, making this class of drugs the one with most variability in terms of enrich-ment signal of the modules (Fig. 4a, bottom; Additional file 1: Figure S15A). However, while some processes like apoptosis are detected in most of the drugs in this cat-egory, others are target-specific. Oxidative phosphoryl-ation (OXPHOS), for example, is represented in 3 of the 4 BRAF inhibitors. It is known that, while BRAF inhibi-tors boost OXPHOS (leading to oncogene-induced sen-escence), activation of glycolytic metabolism followed by OXPHOS inactivation yields drug resistance [69, 70]. Similarly, VX11e (the only drug in our dataset targeting ERK2) shows a distinctive enrichment in Myc-regulated proteins, while FMK (the only drug targeting the Riboso-mal S6 kinase) is enriched in p53 signaling pathway and inflammatory response processes. All these observations are consistent with previous studies [71–74], and Add-itional file1: Figure S15C demonstrates that the variabil-ity observed between drugs in this class is driven mostly by differences in the sensitivity profiles of the drugs.
Overall, the enrichment signal (i.e., the functional coher-ence) of drug modules is substantially higher than that of full signatures (PCGs and NCGs) (Fig.4b,c). This facilitates, in principle, the mechanistic interpretation of drug-gene correlation results (Additional file 1: Figure S15D). We show an illustrative module (CEP-701) in Fig.4d.
WNT signaling, which is a potential mechanism against this tumor type [79]. We also found one EGFR inhibitor (Gefitinib) and the PLK inhibitor NPK76-II-72-1 men-tioned above in the context of Myc enrichment analysis. Both mechanisms have shown promise in EGFR- and Myc-activated gliomas, respectively [80, 81]. Finally, we encountered a more heterogeneous pattern in breast cancer patients (BRCA) (Fig. 4e, orange), including mechanisms supported by the literature, such as AKT, IRAK1, and PLK3 inhibition [82–84].
Beyond the tumor-type level, we looked for modules that were significantly enriched (odds ratio > 2,Pvalue < 0.001) in patients harboring specific driver mutations (see
the“Methods”section). A full account of this enrichment
analysis is given in Additional file 7. We found, for in-stance, that modules of drugs targeting ERK/MAPK sig-naling are related to patients with mutations in HRAS and BRAF [85, 86] and that, in turn, BRAF is (together with KRAS) frequently mutated in patients“expressing” mod-ules of EGFR signaling inhibitors [87]. Taken together, and although TCGA treatment response data is too scarce to allow for prediction assessment [88], these results indicate that the drug modules identified in CCLs hold promise for translation to clinical practice.
Conclusions
Two limitations of large-scale pharmacogenomic studies are the difficulty to reproduce results across screening
A
B
C
E
D
Fig. 4Drug module characterization.aDrug module enrichment analysis based on the Hallmark gene set (odds ratios in color,pvalues < 0.05 are marked with a white dot). For simplicity, three drug classes are shown: drugs affecting mitosis, RTK signaling, and ERK/MAPK signaling.b
platforms and the eventual translation to clinics, as it re-mains unclear whether immortalized cells are able to model patient samples [89]. Another important limita-tion is the overwhelming number of drug-gene correla-tions that can be derived from these experiments, yielding signatures of drug sensitivity that are almost im-possible to interpret. We have shown, for example, that (i) the number of correlated genes is highly variable across drugs, (ii) some genes are unspecifically corre-lated to many drugs, and (iii) not all drug-gene pairs are equally correlated in every tissue. We propose that con-verting transcriptional signatures to network modules may simplify the analysis, since network modules are smaller, more robust, and functionally coherent. We have validated this strategy by proving that drug re-sponse modules, which are enriched in biological pro-cesses of pharmacological relevance and exhibit comparable predictive power to the full signatures, are tightly related to the MoA. Further, we have character-ized the modules extensively (Additional file 8 and e.g., Additional file1: Figure S16) and confirmed their occur-rence in the TCGA clinical cohort (Additional file6and Additional file10).
However, our approach does have some of the limita-tions of ordinary transcriptomic analyses. Expression levels of mRNA do not perfectly match protein abun-dance, nor are they able to capture post-translational modifications such as phosphorylation events, which are key to some of the pathways studied here. Moreover, wide dynamic ranges in gene expression and drug sensi-tivity data are necessary for drug-gene correlations to be captured, thus requiring, in practice, considerably large panels of CCLs, which limits the throughput of the tech-nique to a few hundred drugs. In particular, one cannot precisely measure correlations within poorly represented tissues, which in turn makes it difficult to disentangle tissue-specific transcriptional traits that may be irrele-vant to drug response. Our module-based approach par-tially corrects for this confounding factor, although the integration of other CCL omics data (such as mutations, copy number variants and chromatin modifications) could further ameliorate these issues and also provide new mechanistic insights. In this context, systems biol-ogy tools that learn the relationships between different layers of biology are needed. Along this line, the release of CCL screens with readouts other than growth inhib-ition or proliferation rate [90, 91] will help unveil the connections between the genetic background of the cells and the phenotypic outcome of drug treatment.
All in all, transcriptomics is likely to remain the dom-inant genome-wide data type for drug discovery, as re-cent technical and statistical developments have drastically reduced its cost [92]. The L1000 Next-generation Connectivity Map, for instance,
contains about one million post-treatment gene expres-sion signatures for 20,000 molecules [90]. These signa-tures await to be interpreted and annotated, and more importantly, they have to be associated with pre-treatment signatures in order to identify therapeutic opportunities. We believe that network biology strategies like the one presented here will enable this connection, encircling relevant“regions”of the signatures and meas-uring the distances between them.
Additional files
Additional file 1:Contains supplementary figures 1–16. (PDF 2107 kb)
Additional file 2:Collection of drug modules in GMT format. The first column indicates the name of the drug while the second column indicates whether the module is a secondary module (“second_module”) or not (“na”). From the third column onwards, there are the genes composing the module (gene names). (XLSX 219 kb)
Additional file 3:Drug module-gene correlations across tissues. (XLSX 2823 kb)
Additional file 4:Pair-wise distances between drug modules. Network distances (dnet) are normalized (z-scores): negative values denote proximity. Secondary modules receive with the suffix“_md2”. See the
“Methods”section for a detailed explanation of the network distance measurement. (XLSX 1742 kb)
Additional file 5:Enrichment scores andpvalues between drug modules (rows) and Hallmark gene sets (columns). For simplicity, secondary modules were merged with the main ones. (XLSX 453 kb)
Additional file 6:Enriched (pvalue < 0.001) drug module count across 31 TCGA cancer types, i.e., number of patients where each module is
“expressed”. (XLSX 79 kb)
Additional file 7:Cancer driver and drug module associations (OR > 2,p value < 0.001), based on patients“expressing/not-expressing”a module and“having/not-having”a driver mutation in the TCGA cohort. (XLSX 56 kb)
Additional file 8:We have chosen 21 features from network-based measures and other functional data: (i) General features(columns 2–9). They illustrate basic and general features derived from the omics panel. We provide, for instance, the number of genes in each module, the aver-age correlation among module genes and a measure of how“unique” are those genes with respect to other modules. Besides, we annotate drug classes and the AUROC predictions in both the GDSC and CTRP panels. (ii) Network features(columns 10–12). These include distances be-tween module genes and drug targets,“connectivity”within module genes (i.e., distance between them), and proximity to genes from other modules. (iii) Biological features(columns 12–21). A series of biological features related to drug biology. We give most of them as simple propor-tions of genes/proteins. Among others, we provide the cellular compartmentalization of the genes, transcription factor specificity and the proportion of disease-related and“druggable”genes inside the mod-ule. Annotated drug targets are listed as well. (XLSX 156 kb)
Additional file 9:CLEAN cluster results using drug module genes and Hallmark gene sets. We provide an additional table with the significant associations between gene clusters and hallmark gene sets. Compressed folder (ZIP). The file can be found athttps://figshare.com/s/
932dd94520d4a60f076d(ZIP 3220 kb)
Additional file 10:Peer Review file. (PDF 1933 kb)
Acknowledgements
Funding
A.F-T. is a recipient of an FPI fellowship. P.A. acknowledges the support of the Spanish Ministerio de Economía y Competitividad (BIO2016-77038-R) and the European Research Council (SysPharmAD: 614944).
Availability of data and materials
Gene expression, drug response and drug target datasets are available in the cancerxxgene resource (https://www.cancerrxgene.org/gdsc1000/GDSC1000_ WebResources/Home.html). External validation data for drug response predictions are available in the ctd2 repository (https://ocg.cancer.gov/ programs/ctd2/data-portal). Hallmark gene sets were obtained from the Molecular Signature Database (MSigDB) (http://software.broadinstitute.org/ gsea/index.jsp). TCGA gene expression data were downloaded from cbioportal (http://www.cbioportal.org;“PanCancer Atlas”flag). TCGA cancer drivers are available in the OncoGenomic Landscapes resource (https:// oglandscapes.irbbarcelona.org/). All data generated or analyzed during this study are included in this published article and its additional files. Code for the module detection pipeline is available at https://github.com/sbnb-lab-irb-barcelona/GDSC-drug-modules.
Authors’contributions
AF-T, MD-F, and PA conceived the study. AF-T and MD-F performed the ana-lyses. AF-T, MD-F, and PA interpreted the data and wrote the manuscript. All authors read and approved the final manuscript.
Ethics approval and consent to participate
Not applicable.
Consent for publication
Not applicable.
Competing interests
The authors declare that they have no competing interests.
Publisher’s Note
Springer Nature remains neutral with regard to jurisdictional claims in published maps and institutional affiliations.
Author details
1Joint IRB-BSC-CRG Program in Computational Biology, Institute for Research
in Biomedicine (IRB Barcelona), The Barcelona Institute of Science and Technology, Barcelona, Catalonia, Spain.2Institució Catalana de Recerca i Estudis Avançats (ICREA), Barcelona, Catalonia, Spain.
Received: 17 October 2018 Accepted: 5 March 2019
References
1. Nevins JR, Potti A. Mining gene expression profiles: expression signatures as cancer phenotypes. Nat Rev Genet. 2007;8(8):601.
2. Pammolli F, Magazzini L, Riccaboni M. The productivity crisis in pharmaceutical R&D. Nat Rev Drug Discov. 2011;10(6):428–38. 3. Swinney DC, Anthony J. How were new medicines discovered? Nat Rev
Drug Discov. 2011;10(7):507–19.
4. Monks A, Scudiero D, Skehan P, Shoemaker R, Paull K, Vistica D, Hose C, Langley J, Cronise P, Vaigro-Wolff A. Feasibility of a high-flux anticancer drug screen using a diverse panel of cultured human tumor cell lines. J Natl Cancer Inst. 1991;83(11):757–66.
5. Barretina J, Caponigro G, Stransky N, Venkatesan K, Margolin AA, Kim S, Wilson CJ, Lehár J, Kryukov GV, Sonkin D, et al. The Cancer Cell Line Encyclopedia enables predictive modelling of anticancer drug sensitivity. Nature. 2012;483(7391):603–7.
6. Yang W, Soares J, Greninger P, Edelman EJ, Lightfoot H, Forbes S, Bindal N, Beare D, Smith JA, Thompson IR, et al. Genomics of Drug Sensitivity in Cancer (GDSC): a resource for therapeutic biomarker discovery in cancer cells. Nucleic Acids Res. 2013;41(D1):D955–61.
7. Seashore-Ludlow B, Rees MG, Cheah JH, Cokol M, Price EV, Coletti ME, Jones V, Bodycombe NE, Soule CK, Gould J, et al. Harnessing connectivity in a large-scale small-molecule sensitivity dataset. Cancer Discov. 2015;5(11): 1210–23.
8. Iorio F, Knijnenburg TA, Vis DJ, Bignell GR, Menden MP, Schubert M, Aben N, Gonçalves E, Barthorpe S, Lightfoot H, et al. A landscape of
pharmacogenomic interactions in cancer. Cell. 2016;166(3):740–54. 9. Rees MG, Seashore-Ludlow B, Cheah JH, Adams DJ, Price EV, Gill S, Javaid S,
Coletti ME, Jones VL, Bodycombe NE, et al. Correlating chemical sensitivity and basal gene expression reveals mechanism of action. Nat Chem Biol. 2016;12(2):109–16.
10. Geeleher P, Zhang Z, Wang F, Gruener RF, Nath A, Morrison G, Bhutra S, Grossman RL, Stephanie Huang R. Discovering novel pharmacogenomic biomarkers by imputing drug response in cancer patients from large genomics studies. Genome Res. 2017;27(10):1743–51.
11. Lee S-I, Celik S, Logsdon BA, Lundberg SM, Martins TJ, Oehler VG, Estey EH, Miller CP, Chien S, Dai J, et al. A machine learning approach to integrate big data for precision medicine in acute myeloid leukemia. Nat Commun. 2018;9(1):42. 12. Liu X, Yang J, Zhang Y, Fang Y, Wang F, Wang J, Zheng X, Yang J. A
systematic study on drug-response associated genes using baseline gene expressions of the Cancer Cell Line Encyclopedia. Sci Rep. 2016;6:22811. 13. Niepel M, Hafner M, Duan Q, Wang Z, Paull EO, Chung M, Lu X, Stuart JM,
Golub TR, Subramanian A, et al. Common and cell-type specific responses to anti-cancer drugs revealed by high throughput transcript profiling. Nat Commun. 2017;8(1):1186.
14. Haibe-Kains B, El-Hachem N, Birkbak NJ, Jin AC, Beck AH, Aerts HJWL, Quackenbush J. Inconsistency in large pharmacogenomic studies. Nature. 2013;504(7480):389–93.
15. Stransky NaG M, Kryukov GV, Garraway LA, Lehar J, Liu M, Sonkin D, Kauffmann A, Venkatesan K, Edelman EJ, Riester M, Barretina J, Caponigro G, Schlegel R, Sellers WR, Stegmeier F, Morrissey M, Amzallag A, Pruteanu-Malinici I, Haber DA, Ramaswamy S, Benes CH, Menden MP, Iorio F, Stratton MR, McDermott U, Garnett MJ, Saez-Rodriguez J. Pharmacogenomic agreement between two cancer cell line data sets. Nature. 2015;528(7580):84–7.
16. Geeleher PaG ER, Seoighe C, Cox NJ, Huang RS. Consistency in large pharmacogenomic studies. Nature. 2016;540(7631):E1–2.
17. Garnett MJaE EJ, Heidorn SJ, Greenman CD, Dastur A, Lau KW, Greninger P, Thompson IR, Luo X, Soares J, Liu Q, Iorio F, Surdez D, Chen L, Milano RJ, Bignell GR, Tam AT, Davies H, Stevenson JA, Barthorpe S, Lutz SR, Kogera F, Lawrence K, McLaren-Douglas A, Mitropoulos X, Mironenko T, Thi H, Richardson L, Zhou W, Jewitt F, Zhang T, O'Brien P, Boisvert JL, Price S, Hur W, Yang W, Deng X, Butler A, Choi HG, Chang JW, Baselga J, Stamenkovic I, Engelman JA, Sharma SV, Delattre O, Saez-Rodriguez J, Gray NS, Settleman J, Futreal PA, Haber DA, Stratton MR, Ramaswamy S, McDermott U, Benes CH. Systematic identification of genomic markers of drug sensitivity in cancer cells. Nature. 2012;483:570–5.
18. Schadt EE. Molecular networks as sensors and drivers of common human diseases. Nature. 2009;461(7261):218–23.
19. Kim Y-A, Przytycka TM. Bridging the gap between genotype and phenotype via network approaches. Front Genet. 2012;3:227.
20. Hartwell LH, Hopfield JJ, Leibler S, Murray AW. From molecular to modular cell biology. Nature. 1999;402(6761supp):C47–52.
21. Vandin F, Upfal E, Raphael BJ. Algorithms for detecting significantly mutated pathways in cancer. J Comput Biol. 2011;18(3):507–22.
22. Alvarez MJ, Shen Y, Giorgi FM, Lachmann A, Ding BB, Ye BH, Califano A. Functional characterization of somatic mutations in cancer using network-based inference of protein activity. Nat Genet. 2016;48(8):838–47. 23. Barabási A-L, Gulbahce N, Loscalzo J. Network medicine: a network-based
approach to human disease. Nat Rev Genet. 2011;12(1):56–68.
24. Keiser MJ, Roth BL, Armbruster BN, Ernsberger P, Irwin JJ, Shoichet BK. Relating protein pharmacology by ligand chemistry. Nat Biotechnol. 2007;25(2):197–206. 25. Dančík V, Carrel H, Bodycombe NE, Seiler KP, Fomina-Yadlin D, Kubicek ST,
Hartwell K, Shamji AF, Wagner BK, Clemons PA. Connecting small molecules with similar assay performance profiles leads to new biological hypotheses. J Biomol Screen. 2014;19(5):771–81.
26. Ashburner M, Ball CA, Blake JA, Botstein D, Butler H, Cherry JM, Davis AP, Dolinski K, Dwight SS, Eppig JTet al: Gene ontology: tool for the unification of biology. The Gene Ontology Consortium Nat Genet 2000, 25(1):25–29. 27. Wishart DS, Knox C, Guo AC, Shrivastava S, Hassanali M, Stothard P, Chang Z,
Woolsey J. DrugBank: a comprehensive resource for in silico drug discovery and exploration. Nucleic Acids Res. 2006;34(Database issue):D668–72. 28. Subramanian A, Tamayo P, Mootha VK, Mukherjee S, Ebert BL, Gillette MA,
29. Ghiassian SD, Menche J, Barabási A-L. A DIseAse MOdule Detection (DIAMOnD) algorithm derived from a systematic analysis of connectivity patterns of disease proteins in the human interactome. PLoS Comput Biol. 2015;11(4):e1004120.
30. Fabregat A, Jupe S, Matthews L, Sidiropoulos K, Gillespie M, Garapati P, Haw R, Jassal B, Korninger F, May B, et al. The Reactome pathway
knowledgebase. Nucleic Acids Res. 2018;46(D1):D649–55.
31. Leiserson MDM, Vandin F, Wu H-T, Dobson JR, Eldridge JV, Thomas JL, Papoutsaki A, Kim Y, Niu B, McLellan M, et al. Pan-cancer network analysis identifies combinations of rare somatic mutations across pathways and protein complexes. Nat Genet. 2015;47(2):106–14.
32. Szklarczyk D, Morris JH, Cook H, Kuhn M, Wyder S, Simonovic M, Santos A, Doncheva NT, Roth A, Bork P, et al. The STRING database in 2017: quality-controlled protein–protein association networks, made broadly accessible. Nucleic Acids Res. 2016;45(D1):D362–8.
33. Oprea TI, Bologa CG, Brunak S, Campbell A, Gan GN, Gaulton A, et al. Unexplored therapeutic opportunities in the human genome. Nat Rev Drug Discov. Nature Publishing Group. 2018;17:317.
34. Menche J, Sharma A, Kitsak M, Ghiassian SD, Vidal M, Loscalzo J, Barabási A-L. Disease networks. Uncovering disease-disease relationships through the incomplete interactome. Science. 2015;347(6224):1257601.
35. Freeman LC. Centrality in social networks conceptual clarification. Soc Networks. 1978;1(3):215–39.
36. Mateo L, Guitart-Pla O, Duran-Frigola M, Aloy P. Exploring the OncoGenomic Landscape of cancer. Genome Medicine. 2018;10(1):61. 37. Smirnov PaK V, Maru A, Freeman M, Ho C, El-Hachem N, Adam GA, Ba-Alawi
W, Safikhani Z, Haibe-Kains B. PharmacoDB: an integrative database for mining in vitro anticancer drug screening studies. Nucleic Acids Res. 2018; 46(D1):D994–D1002.
38. Gilcrease MZ. Integrin signaling in epithelial cells. Cancer Lett. 2007;247(1):1– 25.
39. Givant-Horwitz V, Davidson B, Reich R. Laminin-induced signaling in tumor cells. Cancer Lett. 2005;223(1):1–10.
40. Keely PJ, Westwick JK, Whitehead IP, Der CJ, Parise LV. Cdc42 and Rac1 induce integrin-mediated cell motility and invasiveness through PI(3)K. Nature. 1997;390(6660):632–6.
41. Gelderloos JA, Rosenkranz S, Bazenet C, Kazlauskas A. A role for Src in signal relay by the platelet-derived growth factorαreceptor. J Biol Chem. 1998; 273(10):5908–15.
42. Patarroyo M, Tryggvason K, Virtanen I. Laminin isoforms in tumor invasion, angiogenesis and metastasis. Semin Cancer Biol. 2002;12(3):197–207. 43. Keely P, Parise L, Juliano R. Integrins and GTPases in tumour cell growth,
motility and invasion. Trends Cell Biol. 1998;8(3):101–6.
44. Kim S-H, Turnbull J, Guimond S. Extracellular matrix and cell signalling: the dynamic cooperation of integrin, proteoglycan and growth factor receptor. J Endocrinol. 2011;209(2):139–51.
45. Du J, Zu Y, Li J, Du S, Xu Y, Zhang L, Jiang L, Wang Z, Chien S, Yang C. Extracellular matrix stiffness dictates Wnt expression through integrin pathway. Sci Rep. 2016;6:20395.
46. Moreno-Layseca P, Streuli CH. Signalling pathways linking integrins with cell cycle progression. Matrix Biol. 2014;34:144–53.
47. Lee CA, Neul D, Clouser-Roche A, Dalvie D, Wester MR, Jiang Y, Jones JP 3rd, Freiwald S, Zientek M, Totah RA. Identification of novel substrates for human cytochrome P450 2J2. Drug Metab Dispos. 2010;38(2):347–56. 48. Zanger UM, Schwab M. Cytochrome P450 enzymes in drug metabolism:
regulation of gene expression, enzyme activities, and impact of genetic variation. Pharmacol Ther. 2013;138(1):103–41.
49. Allocati N, Masulli M, Di Ilio C, Federici L. Glutathione transferases: substrates, inihibitors and pro-drugs in cancer and neurodegenerative diseases. Oncogenesis. 2018;7(1):8.
50. Hayes JD, Flanagan JU, Jowsey IR. Glutathione transferases. Annu Rev Pharmacol Toxicol. 2005;45:51–88.
51. Green MD, Francis PA, Gebski V, Harvey V, Karapetis C, Chan A, Snyder R, Fong A, Basser R, Forbes JF, et al. Gefitinib treatment in hormone-resistant and hormone receptor-negative advanced breast cancer. Ann Oncol. 2009; 20(11):1813–7.
52. Zhang X, Zhang B, Liu J, Liu J, Li C, Dong W, Fang S, Li M, Song B, Tang B, et al. Mechanisms of Gefitinib-mediated reversal of tamoxifen resistance in MCF-7 breast cancer cells by inducing ERαre-expression. Sci Rep. 2015;5:7835. 53. Huguet F, Fernet M, Giocanti N, Favaudon V, Larsen AK. Afatinib, an
irreversible EGFR family inhibitor, shows activity toward pancreatic cancer
cells, alone and in combination with radiotherapy, independent of KRAS status. Target Oncol. 2016;11(3):371–81.
54. Ioannou N, Dalgleish AG, Seddon AM, Mackintosh D, Guertler U, Solca F, Modjtahedi H. Anti-tumour activity of afatinib, an irreversible ErbB family blocker, in human pancreatic tumour cells. Br J Cancer. 2011;105(10):1554–62. 55. Mahajan K, Mahajan NP. Cross talk of tyrosine kinases with the DNA
damage signaling pathways. Nucleic Acids Res. 2015;43(22):10588–601. 56. Chen M-K, Hung M-C. Regulation of therapeutic resistance in cancers by
receptor tyrosine kinases. Am J Cancer Res. 2016;6(4):827–42.
57. Ish-Shalom D, Christoffersen CT, Vorwerk P, Sacerdoti-Sierra N, Shymko RM, Naor D, DeMeyts P. Mitogenic properties of insulin and insulin analogues mediated by the insulin receptor. Diabetologia. 1997;40(Suppl 2):25–31. 58. Borisov N, Aksamitiene E, Kiyatkin A, Legewie S, Berkhout J, Maiwald T,
Kaimachnikov NP, Timmer J, Hoek JB, Kholodenko BN. Systems-level interactions between insulin–EGF networks amplify mitogenic signaling. Mol Syst Biol. 2009;5(1):256.
59. Mairet-Coello G, Tury A, DiCicco-Bloom E. Insulin-like growth factor-1 promotes G(1)/S cell cycle progression through bidirectional regulation of cyclins and cyclin-dependent kinase inhibitors via the phosphatidylinositol 3-kinase/Akt pathway in developing rat cerebral cortex. J Neurosci. 2009; 29(3):775.
60. Geeleher P, Cox NJ, Huang RS. Clinical drug response can be predicted using baseline gene expression levels and in vitro drug sensitivity in cell lines. Genome Biol. 2014;15(3):R47.
61. Juan-Blanco T, Duran-Frigola M, Aloy P. Rationalizing drug response in cancer cell lines. J Mol Biol. 2018.
62. Ferranti D, Krane D, Craft D. The value of prior knowledge in machine learning of complex network systems. Bioinformatics. 2017;33(22):3610–8. 63. Liberzon A, Birger C, Thorvaldsdóttir H, Ghandi M, Mesirov JP, Tamayo P.
The molecular signatures database hallmark gene set collection. Cell Systems. 2015;1(6):417–25.
64. Freudenberg JM, Joshi VK, Hu Z, Medvedovic M. CLEAN: CLustering Enrichment ANalysis. BMC Bioinformatics. 2009;10(1):234.
65. Glück AA, Aebersold DM, Zimmer Y, Medová M. Interplay between receptor tyrosine kinases and hypoxia signaling in cancer. Int J Biochem Cell Biol. 2015;62:101–14.
66. Thiery JP. Epithelial–mesenchymal transitions in development and pathologies. Curr Opin Cell Biol. 2003;15(6):740–6.
67. Lindblad O, Cordero E, Puissant A, Macaulay L, Ramos A, Kabir NN, Sun J, Vallon-Christersson J, Haraldsson K, Hemann MT, et al. Aberrant activation of the PI3K/mTOR pathway promotes resistance to sorafenib in AML. Oncogene. 2016;35(39):5119–31.
68. Nogami A, Oshikawa G, Okada K, Fukutake S, Umezawa Y, Nagao T, Kurosu T, Miura O. FLT3-ITD confers resistance to the PI3K/Akt pathway inhibitors by protecting the mTOR/4EBP1/Mcl-1 pathway through STAT5 activation in acute myeloid leukemia. Oncotarget. 2015;6(11):9189–205.
69. Haq R, Shoag J, Andreu-Perez P, Yokoyama S, Edelman H, Rowe GC, Frederick DT, Hurley AD, Nellore A, Kung AL, et al. Oncogenic BRAF regulates oxidative metabolism via PGC1αand MITF. Cancer Cell. 2013;23(3):302–15.
70. Haq R, Fisher DE, Widlund HR. Molecular pathways: BRAF induces bioenergetic adaptation by attenuating oxidative phosphorylation. Clin Cancer Res. 2014;20(9):2257–63.
71. Amatangelo MD, Goodyear S, Varma D, Stearns ME. c-Myc expression and MEK1-induced Erk2 nuclear localization are required for TGF-beta induced epithelial–mesenchymal transition and invasion in prostate cancer. Carcinogenesis. 2012;33(10):1965–75.
72. Marampon F, Ciccarelli C, Zani BM. Down-regulation of c-Myc following MEK/ERK inhibition halts the expression of malignant phenotype in rhabdomyosarcoma and in non muscle-derived human tumors. Mol Cancer. 2006;5:31.
73. Moens U, Kostenko S, Sveinbjørnsson B. The role of mitogen-activated protein kinase-activated protein kinases (MAPKAPKs) in inflammation. Genes. 2013;4(2):101–33.
74. Cho Y-Y, He Z, Zhang Y, Choi HS, Zhu F, Choi BY, Kang BS, Ma W-Y, Bode AM, Dong Z. The p53 protein is a novel substrate of ribosomal S6 kinase 2 and a critical intermediary for ribosomal S6 kinase 2 and histone H3 interaction. Cancer Res. 2005;65(9):3596–603.
75. Schadendorf D. Peroxisome proliferator-activating receptors: a new way to treat melanoma? J Investig Dermatol. 2009;129(5):1061–3.
proliferator-activated receptor (PPAR)-dependent cell cycle blocks in human skin carcinoma cells. Toxicology. 2018;404-405:25–32.
77. Ardito Christine M, Grüner Barbara M, Takeuchi Kenneth K, Lubeseder-Martellato C, Teichmann N, Mazur Pawel K, DelGiorno KE, Carpenter Eileen S, Halbrook Christopher J, Hall Jason C, et al. EGF receptor is required for KRAS-induced pancreatic tumorigenesis. Cancer Cell. 2012;22(3):304–17. 78. Tzeng C-WD, Frolov A, Frolova N, Jhala NC, Howard JH, Buchsbaum DJ,
Vickers SM, Heslin MJ, Arnoletti JP. Epidermal growth factor receptor (EGFR) is highly conserved in pancreatic cancer. Surgery. 2007;141(4):464–9. 79. Lee Y, Lee J-K, Ahn SH, Lee J, Nam D-H. WNT signaling in glioblastoma and
therapeutic opportunities. Lab Investig. 2015;96:137.
80. Rao SK, Edwards J, Joshi AD, Siu IM, Riggins GJ. A survey of glioblastoma genomic amplifications and deletions. J Neuro-Oncol. 2010;96(2):169–79. 81. Higuchi F, Fink AL, Kiyokawa J, Miller JJ, Koerner MVA, Cahill DP, Wakimoto
H. PLK1 inhibition targets Myc-activated malignant glioma cells irrespective of mismatch repair deficiency–mediated acquired resistance to
temozolomide. Mol Cancer Ther. 2018;17(12):2551.
82. Paplomata E, O’Regan R. The PI3K/AKT/mTOR pathway in breast cancer: targets, trials and biomarkers. Ther Adv Med Oncol. 2014;6(4):154–66. 83. Wee ZN, Yatim SMJM, Kohlbauer VK, Feng M, Goh JY, Bao Y, Lee PL, Zhang
S, Wang PP, Lim E, et al. IRAK1 is a therapeutic target that drives breast cancer metastasis and resistance to paclitaxel. Nat Commun. 2015;6:8746. 84. Fallah Y, Brundage J, Allegakoen P, Shajahan-Haq AN. MYC-Driven Pathways
in Breast Cancer Subtypes. Biomolecules. Multidisciplinary Digital Publishing Institute. 2017;7:53.
85. Van Aelst L, Barr M, Marcus S, Polverino A, Wigler M. Complex formation between RAS and RAF and other protein kinases. Proc Natl Acad Sci. 1993; 90(13):6213.
86. Moodie SA, Willumsen BM, Weber MJ, Wolfman A. Complexes of Ras.GTP with Raf-1 and mitogen-activated protein kinase kinase. Science. 1993; 260(5114):1658.
87. Fitzgerald TL, Lertpiriyapong K, Cocco L, Martelli AM, Libra M, Candido S, Montalto G, Cervello M, Steelman L, Abrams SL, et al. Roles of EGFR and KRAS and their downstream signaling pathways in pancreatic cancer and pancreatic cancer stem cells. Adv Biol Regul. 2015;59:65–81.
88. Liu J, Lichtenberg T, Hoadley KA, Poisson LM, Lazar AJ, Cherniack AD, Kovatich AJ, Benz CC, Levine DA, Lee AV, et al. An integrated TCGA Pan-Cancer Clinical Data Resource to drive high-quality survival outcome analytics. Cell. 2018;173(2):400–416.e411.
89. Jaeger S, Duran-Frigola M, Aloy P. Drug sensitivity in cancer cell lines is not tissue-specific. Mol Cancer. 2015;14(1):40.
90. Subramanian A, Narayan R, Corsello SM, Peck DD, Natoli TE, Lu X, Gould J, Davis JF, Tubelli AA, Asiedu JK, et al. A next generation connectivity map: L1000 platform and the first 1,000,000 profiles. Cell. 2017;171(6):1437–1452.e1417. 91. Wawer MJ, Li K, Gustafsdottir SM, Ljosa V, Bodycombe NE, Marton MA,
Sokolnicki KL, Bray M-A, Kemp MM, Winchester E, et al. Toward performance-diverse small-molecule libraries for cell-based phenotypic screening using multiplexed high-dimensional profiling. Proc Natl Acad Sci U S A. 2014;111(30):10911–6.