R E S E A R C H A R T I C L E
Open Access
The role of social network analysis as a
learning analytics tool in online problem
based learning
Mohammed Saqr
1,2*and Ahmad Alamro
3Abstract
Background:Social network analysis (SNA) might have an unexplored value in the study of interactions in technology-enhanced learning at large and in online (Problem Based Learning) PBL in particular. Using SNA to study students’positions in information exchange networks, communicational activities, and interactions, we can broaden our understanding of the process of PBL, evaluate the significance of each participant role and learn how interactions can affect academic performance.
The aim of this study was to study how SNA visual and mathematical analysis can be sued to investigate online PBL, furthermore, to see if students’position and interaction parameters are associated with better performance. Methods:This study involved 135 students and 15 teachers in 15 PBL groups in the course of“growth and development”at Qassim University. The course uses blended PBL as the teaching method. All interaction data were extracted from the learning management system, analyzed with SNA visual and mathematical techniques on the individual student and group level, centrality measures were calculated, and participants’roles were mapped. Correlation among variables was performed using the non-parametric Spearman rank correlation test.
Results:The course had 2620 online interactions, mostly from students to students (89%), students to teacher interactions were 4.9%, and teacher to student interactions were 6.15%. Results have shown that SNA visual analysis can precisely map each PBL group and the level of activity within the group as well as outline the interactions among group participants, identify the isolated and the active students (leaders and facilitators) and evaluate the role of the tutor. Statistical analysis has shown that students’level of activity (outdegree rs(133) = 0.27,p= 0.01), interaction with tutors (rs(133) = 0.22,p= 0.02) are positively correlated with academic performance.
Conclusions:Social network analysis is a practical method that can reliably monitor the interactions in an online PBL environment. Using SNA could reveal important information about the course, the group, and individual students. The insights generated by SNA may be useful in the context of learning analytics to help monitor students’activity.
Keywords:Social network analysis, problem-based learning, Blended learning, blended problem-based learning,
Learning analytics
© The Author(s). 2019Open AccessThis article is distributed under the terms of the Creative Commons Attribution 4.0 International License (http://creativecommons.org/licenses/by/4.0/), which permits unrestricted use, distribution, and reproduction in any medium, provided you give appropriate credit to the original author(s) and the source, provide a link to the Creative Commons license, and indicate if changes were made. The Creative Commons Public Domain Dedication waiver (http://creativecommons.org/publicdomain/zero/1.0/) applies to the data made available in this article, unless otherwise stated. * Correspondence:[email protected]
1
School of Computing, University of Eastern Finland, Joensuu Campus, Yliopistokatu 2, P.O. Box 111, fi-80100 Joensuu, Finland
2Department of Computer and System Sciences (DSV), Stockholm University,
Background
Social constructivists view learning as an active construction of knowledge that occurs through social interaction and dialogue among learners. Interaction becomes particularly meaningful when learners are coached in a positive atmosphere and when the students have the chance to argue, debate, and offer alternate perspectives or contribute to ideas [1, 2]. Aiming to harness the potentials of the approach, the social constructivist methods have been embraced by several modern pedagogies such as problem and team-based learning that encourage collaboration and promote meaningful interactions among learners. Problem-based learning (PBL) uses problems as triggers to facilitate dis-course and interaction among students, the discussions occur in small groups and are facilitated by teachers [3]. The PBL process is structured in a way to help students elaborate and activate previous information [3,4].
Online problem-based learning requires students to engage in active discussions in two types of dialogical spaces; the content and the relational spaces. Learners interact in the content space towards the goal of acquir-ing a deeper understandacquir-ing of the domain of knowledge; activities include collecting information, discussing con-cepts and proposing solutions to the problem [5–7]. Communicative activities in the relational space deal with the interpersonal relations and interactions among collaborators. The primary goal of these interactions is to reach a common understanding of the concepts and content under discussion [5,8].
There is overwhelming evidence of the value of learners’ interaction with peers, teachers, and the content, which is widely recognized as a pivotal ingredi-ent of modern education [9, 10]. However, offering the learners the opportunity to interact does not directly translate to effective interactions and working online together does not mean collaboration [6, 11, 12]. More-over, online collaboration requires instructional support, scaffolding by teachers, active coordinating of collabor-ation dynamics, engagement of learners in a stimulating environment [11, 13], which begs the need for a mech-anism to monitor the efficiency of online interactions and design a data-driven intervention that supports effective collaboration.
Social network analysis
Social network analysis (SNA) is a collection of methods and tools that could be used to study the relationships, interactions and communications. As such, SNA is suit-able for the study and possibly monitoring of online interactions as it can automatically analyze interaction data, bringing a bird-eye view of the group social struc-ture, the interaction patterns, as well as the mapping of all communications in the relational space [14–17]. SNA
can be implemented in two main ways, visualization, and mathematical analysis.
SNA visualization renders relationships between actors in social networks by graphs known as sociograms; the sociogram portrays actors (nodes in SNA terms) as points, and relationships (edges in SNA terms) as arrows originating from the source of the interaction and point-ing to the target of interaction [17]. SNA may help visualize the interactions among participants and may reveal who are the important actors in the interactions and who are the isolated actors, what are the groups that shows dense interactions or sparse interactions that may need support. It may also reveal the active moderators who are participating and interacting with students, and the extent of their interactions. PBL is a collaborative learning where small groups interdependently work together and as such evaluation of collaborative interac-tions is important.
The SNA mathematical analysis quantifies network parameters on individual actor levels, as well as group level. The mathematical analysis of SNA uses graph theory concepts to calculate metrics representing the nodes, the links or the network. Such as the distance to other actors in the network, the number of interactions with other actors, or how many times it bridged interac-tions between communities. These metrics are import-ant in quimport-antifying interactions, ranking nodes, or relationships. Parameters calculated at the actor level are called centrality scores, these scores are measures of the node position or importance in the social network. Since there are different contexts and probably different ways to consider the role important, there are different centrality scores. The measures chosen for this study are centrality measures of role and position in information exchange [17]. For example: number of received interac-tions are quantified as in-degree centrality, number of contributed interactions is called out-degree centrality. These parameters can add to our portfolio of informa-tion about students and might extend to learning analyt-ics [14, 15]. In the context of PBL, one would be interested in the interactivity of participants, and their groups, and how these metrics could tell us about online PBL.
stimulated or supported. M Saqr, U Fors and M Tedre [19] used social network analysis to monitor collabora-tive groups and create a data-driven intervention that results in a meaningful improvement in the way students collaborate. Previous research results in learning analyt-ics are promising, and some studies have given an indication of the potential of SNA centrality measures in predicting students’performance [20,21].
There is an apparent gap of the studies about the in-teractions in online PBL, particularly the relational and communicative activities. Most studies about the inter-actions in PBL targeted the content dimension through effortful resource intensive methods such as interviewing the learners, recording, and coding of PBL sessions or text mining techniques. Other researchers have used indirect examination and exploration using surveys and open-ended questionnaires [7,22]. Such methods are prac-tically demanding as well as challenging to standardize and difficult to implement by instructors [23,24]. It is reason-able to argue that there is a need for mechanisms to ensure that online PBL meets the required curricular goals and objective and is actually collaborative. The methods need to be automatic, easy to implement and offer meaningful information that can help stakeholders improve the PBL process. In this study, we investigate the use the potentials of SNA in supporting learning and teaching. We have considered both visualization and mathematical analysis. Since the PBL process has three important aspects: the stu-dent, the actor and the group, we have used these aspects as the units of analysis.
The research question of this study can be formulated as follows:
– What can SNA visual and mathematical analysis tell about PBL?
– What interaction parameters as measured by SNA associated with better performance?
Methods Design
The study was designed as an exploratory case study; a case study design allows an in-depth investigation of a case (Online PBL course in our study) from different perspectives.
Participants
The study included data from 135 first year students (42 females and 93 males) and 15 tutors (10 males and 5 females), three students did not sign the ethical approval and 11 students dropped out of the course and so their data were not included. The course chosen was the Growth and Development of the year 2017, attended by first year students, the course is the third course in the year. The course covers issues of growth and
development from different aspects, including anatomy, physiology and embryology. By the third course, students should have acquired a fair experience of the educational system and practiced online PBL for three months. The course duration is around 45 days, within them four weeks of PBL sessions were completed by all students.
Setting
Qassim College of Medicine, Saudi Arabia has intro-duced PBL since 2001. The college adopted the seven jumps approach, student is expected to attend two ses-sions physically, one at the beginning of the week and another at the end, in between these sessions, students are offered an online forum where they continue to interact. The interactions start on the first day of the week by posting the learning issues of the weekly prob-lem. Students are encouraged to discuss the learning issues, share information, collaboratively construct the required knowledge and work towards achieving the goals and the objectives of the PBL problem. By the last day of the week, each group is expected to wrap up what they have learnt together. The online discussions are assigned to the same students in the physical group and facilitated by the same tutors [7].
Measures
The PBL represents the backbone of the educational system at the medical college and the objectives of the PBL sessions are written to cover the course objectives. The lectures, seminars and other educational activities are designed to support students understand the prob-lem used in the PBL. The students are evaluated by multiple choice questions (MCQ), modified essay ques-tions (MEQs) and Short-answer Essay Quesques-tions (SEQ) as well as practical exams. The grades considered for this study are only the sum of MCQ, MEQ and SEQ as they are designed to test students’knowledge acquisition of PBL objectives and the exam blueprint is designed according to these objectives. The mean difficulty index of MCQs was 0.67, the mean discrimination index was 0.32 and the reliability index was 89.2%.
Data collection
re-coded, so the students labeled as S1 to S135 and the tutors were recoded as T1 to T15.
SNA analysis
The analysis of SNA was done using Gephi version 9.2. Gephi is an open source application that has the capabil-ity to visually and mathematically analyze social networks through a graphical user interface. It can import a range of formats as well as export analysis data in an easy to use format for analysis [25].
SNA visual analysis
The course network, as well as group networks, were analyzed and studied visually. Visualization was imple-mented to describe the general properties of the course network, such as the interactivity level, participants’ contributions, who is participating and identify the types of communications. The same was performed for each PBL group with special emphasis on the student-student and student tutor communications.
SNA mathematical analysis
Mathematical analysis of participants’ interactivity may shed lights on important aspects such as interactivity and information exchange. As such, mathematical ana-lysis was done at two levels, Individual students’ level (student and tutor), and group level, since they are the important factors in the PBL process.
Student level
For each student, we collected the following parameters: Type of interactions (student-student, student-tutor, and tutor-tutor). We also calculated centrality measures that are relevant to interactions and role in information exchange:
– Indegree centrality: the number of posts that are directed to a user, such as replies. A user receives more replies to contribution if the contribution is noteworthy, useful or arguable. As such in-degree centrality in this context reflect the importance of a user contribution as voted by other users. Out-degree centrality: the frequency of posts made by the user and reflects the activity of the user in the discussions.
– Degree centrality: is the sum of indegree and outdegree centralities and reflects the overall activity of the user
– Betweenness centrality: is the frequency a user connected two other unconnected users, or lied in-between their interactions. As such, it may be viewed as a measure of bridging others and helping communications among interacting participants.
– Closeness centrality: reflects the distance between a user and all other users in the group, a user with high closeness centrality can be easily reachable by all others.
As this article is beyond the discussion of the theory, mathematics and concepts of centrality measures, inter-ested readers can have further details in this article [26].
Group level
For each group, we collected the following parameters: The total number of interactions and type (student-stu-dent, student-tutor, and tutor-tutor), average in-degree centrality (average in-degree of all group members), average degree centrality (average degree of group members).
Statistical analysis
Statistics were performed using Paleontological Statistics Software Package for Education and Data Analysis version 3.2. Correlation among variables was performed using the non-parametric Spearman rank correlation test [27].
Results
Descriptive statistics
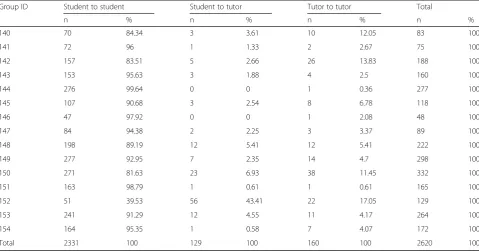
The course included 15 PBL groups; each group had a range of 6 to 12 students with one tutor. There were six discussion forums: five PBL discussion forums and a news forum (for course announcements, data of the news forum were excluded from the study. The course had 2620 interactions, mostly from students to students (89%), students to teacher interactions were 4.9% and teacher to student interactions were 6.15%. The range of interactions in each group was 48 to 332 (mean 216, SD 81.5). The picture was also similar on the course level; students dominated the interactions. Some groups were highly interactive such as groups 150, 144 and 149 and some were not such as groups 146, 140 and 141. A breakdown of each interaction type is presented in the course is presented in Table1for group level.
RQ1: what can SNA visual and mathematical analysis tell about PBL?
Visual analysis
SNA visual analysis can be used on different levels, in our case three levels are relevant: the whole course level, the PBL group level and individuals’level. Following is a demonstration of what each level can reveal visually.
On course level
One of SNA biggest advantages is the ability to sum up and map all interactions, as such it offers a bird-eye view of the relational dynamics in a course or a group. In the next Fig.1, SNA rendered each PBL separately and iden-tified each group, a property known asfinding communi-ties. This property is useful in finding the group of members who frequently interact with each other. The Figure shows each PBL group and the interactions among participants. Active groups can be recognized; an example is group A, B, and C; the three groups have dense interactions among participants. Groups D, E, and F, have a moderate level of activity; while G and H groups are less active with very few interactions among participants. Using such method may help pick the groups that need attention, a focused review or support.
On group level
While the insights from the whole course network can be helpful to have a course overview, a focus on each group separately can demonstrate deeper information. In each group, the visual analysis using SNA can reveal the patterns of the interactions occurring in the group and how the students and the tutor perform; which are rele-vant factors for the evaluation of the PBL process. To
demonstrate the potential of SNA and how much insight it can give, we present three Figures, in Fig.2, group (A) is visually rendered in a sociogram. Regarding partici-pants’ roles, it can be noted that student S83, S84, S15 are the most active students, while S110, S98 are the least active and are relatively isolated. The interactions are mostly occurring among students S15, S101, S84, S106 and the tutor. The role of the tutor who is coded as T150 can also be recognized, the node size indicates a moderate level of activity, and the arrows directions are indications that he received many interactions as well as communicated back with most students, the dark node color is an indication that his role was mostly moderat-ing discussions among students. It is reasonable to say here that the information about the tutor was assuring that that tutor acted as expected from him. Regarding the group, the multiple interactions are an indication of an active group with diverse participation among most participants. To summarize, the picture SNA is rendered in Fig.2, a picture of an active group with many active students, and few inactive students S110 who might need more attention from the tutor.
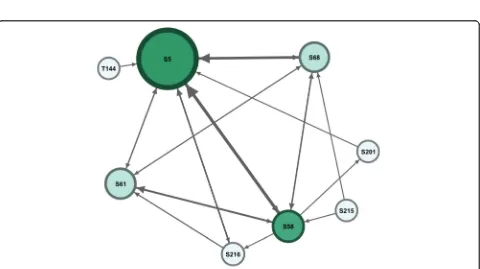
In contrast to the previous group, the next group (I) shows far lower level of activity. However, as shown in Fig. 3, student S5 is the most active participant, less so are students s58, S61 and S68, the remaining students are mostly inactive, the tutor role was very limited and made a single interaction with S5. Apparently, such group requires attention and the tutor might be con-tacted to play a more active role in the group, to stimu-late students and promote interactions.
Table 1Summary of interaction types in each group
Group ID Student to student Student to tutor Tutor to tutor Total
n % n % n % n %
140 70 84.34 3 3.61 10 12.05 83 100
141 72 96 1 1.33 2 2.67 75 100
142 157 83.51 5 2.66 26 13.83 188 100
143 153 95.63 3 1.88 4 2.5 160 100
144 276 99.64 0 0 1 0.36 277 100
145 107 90.68 3 2.54 8 6.78 118 100
146 47 97.92 0 0 1 2.08 48 100
147 84 94.38 2 2.25 3 3.37 89 100
148 198 89.19 12 5.41 12 5.41 222 100
149 277 92.95 7 2.35 14 4.7 298 100
150 271 81.63 23 6.93 38 11.45 332 100
151 163 98.79 1 0.61 1 0.61 165 100
152 51 39.53 56 43.41 22 17.05 129 100
153 241 91.29 12 4.55 11 4.17 264 100
154 164 95.35 1 0.58 7 4.07 172 100
On individual level
On the individual level, SNA can highlight the network of individual users. For instance, we can have a student of interest that we would like to see his performance. For that situation, we can isolate his network in what is known as an ego network. To demonstrate this, we dem-onstrate the ego network of the tutor in another group, namely the ego network of the tutor of group I in Fig.4. Although the group included 11 students, the tutor had only five students who communicated with him. A look at the full network in the side image, we can see that the students who needed help the most (the less active) were not helped, this is a clear example of an opportunity where an improvement can be made, by alerting the tutor to diversify his interactions and focus on the iso-lated students.
Mathematical analysis On the course level
Mathematical analysis offers a quantification of interac-tions and roles which may enable accurate comparison of students and groups. It is also potentially useful as a
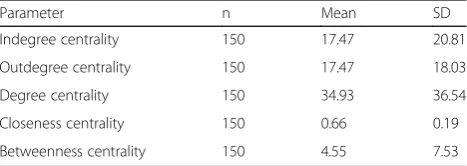
measurement that can be used to forecast performance. The descriptive properties of participants in our study were as follows: the average outdegree centrality was 17.47, which means each participant has contributed with an average of 3.5 posts/week during the five weeks duration of the course, which is an indication of a relatively interactive course. The centrality measures of information exchange were also acceptable, the closeness centrality normalized score was 0.66, meaning that most students had moderate to high reachability. Same parameters can be obtained for the group and they are presentenced in the next section.
Further details are in Table2.
On the group and individual level
Fig. 3Interactions in group I. The node size was configured as degree centrality to reflect participants’activity. The edges were configured so that the more frequent the interactions between two participants are, the thicker the line will be. The colour intensity reflects role in moderating interactions
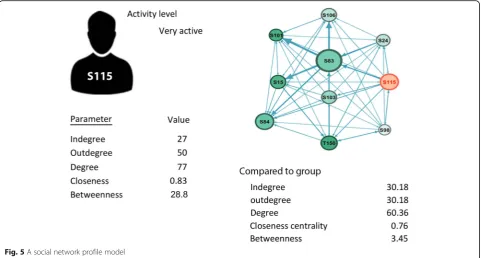
he was close in the discussions to all other collabora-tors. However, betweenness 28.8 centrality is high, an indication that the student has connected and bridged interactions with others. The parameters of the group were also listed on the side to see how the student compared to others in the same group. The parame-ters were relatively high (high indegree, high outde-gree, high closeness and betweenness centralities). One can reach the conclusion that that this was an active student in an active group.
Social profile
To sum up a student or a user activity, we propose using SNA as a monitoring tool that displays the activity of a use (visual and mathematical) compared to own group for the teachers to use. The social network profile con-cept we propose can be applied in a learning manage-ment system dashboard to show social profile, connections and parameters. To demonstrate this, we chose a student from group A, showing ego network, the activity level and parameters for clarity, we also com-pare the activity to the group side by side. Comparison to his group will show if his activity level is proportional to colleagues or not and will highlight the other
participants’role. In case there is an unsatisfactory level of activity, one can understand the reason.
RQ2 do interaction parameters as measured by SNA -correlate with better performance?
To see which of the SNA factors might correlate with better achievement, we categorized the parameters into three main groups: personal, group and tutor factors. The results indicated that outdegree centrality of a student, being in a group with higher average grade, communicating with the tutors, are the factors most correlated with better learning. The full details of correlation coefficient are displayed in Tables3.
Discussion
This study was done to evaluate the role SNA can be used to evaluate online PBL and offer insights to admin-istrators, tutors, and students. We have looked at the visual analysis and the quantitative interaction statistics. The type of interaction based on the involved participant whether he is a tutor or a student was considered. We also used role classification to try to understand the dynamics of intragroup interactions.
On the quantitative level, SNA interaction analysis of-fered simple, easy to interpret indicators for the level of activity of students and tutors; these indicators helped identify the active groups, tutors, and students alike. The indicators also helped flag a potentially dysfunctional or inactive group and the inactive student or a disengaged tutor. The SNA measures of role and position in infor-mation transfer highlighted qualities that can’t be easily recognized by the interaction parameters (number of posts). For instance, betweenness centrality reflected the role of students in moderating information, connecting Fig. 4The tutor ego network compared to the whole network showing the tutor has interacted with a limited number of students. The node size was configured as degree centrality to reflect participants’activity. The edges were configured so that the more frequent the interactions between two participants are, the thicker the line will be. The colour intensity reflects role in moderating interactions
Table 2Descriptive statistics of participants
Parameter n Mean SD
Indegree centrality 150 17.47 20.81
Outdegree centrality 150 17.47 18.03
Degree centrality 150 34.93 36.54
Closeness centrality 150 0.66 0.19
the unconnected students and brings them into the discussion. Closeness centrality pointed to students who were not easily engaged in the discussions.
When coupled with visual analysis, it gave further insights into the dynamics of the interactions in the groups, such as who was active, who were the students interacting together and highlighted the isolated students. The role analysis we have performed in our study added another dimension to the utility of SNA. Identifying each role and who plays it enables tutors to understand dynamics in the group, helps motivate discussions and mitigate conflict or prevent dysfunction
in interacting groups as well as appreciate different points of view [28,29].
Studies of interaction analysis in online PBL are scarce, our review of the literature identified one study about the analysis of problem-solving online discussions, which is apparently not precisely online PBL [30, 31]. Another study by Saqr et al. that focused on using social network metrics as proxy leaning analytics indicators to predict performance using machine learning methods and advanced modelling techniques. The importance of our study is that it offers a practical monitoring solution that can be implemented and interpreted by different stakeholders, the insights generated have the potential to improve many aspects of the online PBL, and at times help intervention in a dysfunctional group or a disen-gaged student [32]. SNA based intervention has proved practical and effective in bringing tangible results that could support teaching and learning in other settings and such methods are similarly applicable in PBL [32].
While content analysis might have added insights about the exchanged information in online PBL, it is resource intensive and requires long, exhaustive work. Since content analysis is usually done manually, it is not a practical choice for automatic monitoring of thousands of interactions. Content analysis has also been criticized for being subjective and difficult to standardize [33–35]. Educational data mining (EDM) offers a potential alter-native as it can automatically analyze text in the real-time. Nonetheless, EDM is impractical beyond research purposes since the instruments and frameworks used are difficult to use by teachers. The most Fig. 5A social network profile model
Table 3Correlation between SNA parameters and achievement
Factors Correlation with achievement Sig. (2-tailed)
Student’s factors
Indegree 0.08 0.38
Outdegree 0.27 0.01
Degree 0.17 0.06
Closeness centrality 0.13 0.16
Betweenness centrality 0.08 0.39
Group’s factors
Average Degree 0.02 0.84
Average Group grade 0.39 0.00
Number of users −0.07 0.47
Tutor’s factors
Teacher-student −0.02 0.79
challenging hindrance we found in the context of online PBL was the absence of context-specific tools since most of the available tools are from outside the field of educa-tion, a problem Alejandro [36] stated as “Many of the EDM researchers are in reality users of Data mining frameworks and tools. Because student modeling com-mands the focus of more than half the approaches.”
While our research was feasible due to the availability of data recorded by the learning management system and the relative ease of obtaining it, a similar approach can be extended to include the face-to-face PBL. The modern voice recognition techniques can accomplish it, since transcribing tools that are becoming more accur-ate, cheaper and easier to implement. The implementa-tion would require more discussion about what to transcribe, what to store and how to handle this data.
We think that our study offered a demonstration of the potentials of SNA as a tool for interaction analysis of online PBL. We hope that this study can kindle the dis-cussions about the need for automatic monitoring of PBL. We hope that future research can examine, im-prove or critique our approach. An obvious future ap-proach to online PBL could couple learning analytics methods with SNA methods.
While this study has shed lights on the communicative and relational aspects of the online PBL, it is not with-out limitations. We recognize the limitation and the need for a reliable content analysis method. An auto-matic EDM method that is designed to capture the PBL elements and give a credible insight into the content of the discussions. We also recognize that our results might need further confirmation in other contexts to advance our understanding of the process, especially different implementations of online PBL.
Conclusions
Social network analysis is a practical method that can reliably monitor the interactions in an online PBL envir-onment. Using SNA can reveal important information about the course, such as the general activity and the active groups. On the group level, it renders a more detailed picture about the group and the participants. Thus, helping to identify the active, inactive or isolated students and tutors alike. Using mathematical parame-ters can also help add insights about the level of activity in a precise way. Furthermore, the insights generated by SNA can be useful in the context of learning analytics to help monitor students’activity.
Abbreviations
EDM:Educational Data mining; MCQ: Multiple Choice Questions; MEQ: Modified Essay Questions; PBL: Problem Based Learning; RQ: Research Question; SD: Standard Deviation; SEQ: Short-answer Essay Questions; SNA: Social Network Analysis; SQL: Structured Query Language
Acknowledgements
Not applicable
Funding
There was no funding source to report for this research.
Availability of data and materials
The data used in this can be obtained upon request from the corresponding author Mohammed Saqr after approval of the ethical approval body of the university. The data cannot be shared publicly because it contains private information and student’s grade data that if released would compromise articles 5, 6,7,10 of Data usage and protection policy section of the Qassim College of Medicine Privacy Policy and User Agreement.
Authors’contributions
MS: Made significant contributions to the conception, design, data acquisition, analysis, interpretation and reporting of the results as well as drafting and revising the manuscript. Moreover, agree to be accountable for all aspects of the work. AA: Made significant work in the design of the study, analysis of the data, drafting and revising it critically for important intellectual content, He also approved the version to be published and agree to be accountable for all aspects of the work. Both authors read and approved the final manuscript.
Ethics approval and consent to participate
The study was granted an approval by the Medical Research Ethics Committee of Qassim University College of Medicine. The participants in this study agreed to participate by electronically signing the participation agreement and the College Data Privacy Policy that details user rights and protection guarantees. All data in this study were anonymized, and private data were excluded. College Privacy guidelines and policies of dealing with students’data were strictly followed.
Consent for publication
Not applicable.
Competing interests
The authors have no competing interests to report.
Publisher’s Note
Springer Nature remains neutral with regard to jurisdictional claims in published maps and institutional affiliations.
Author details
1
School of Computing, University of Eastern Finland, Joensuu Campus, Yliopistokatu 2, P.O. Box 111, fi-80100 Joensuu, Finland.2Department of
Computer and System Sciences (DSV), Stockholm University,
Borgarfjordsgatan 12, PO Box 7003, SE-164 07 Kista, Sweden.3College of
Medicine, Qassim University, Qassim, Kingdom of Saudi Arabia.
Received: 1 January 2019 Accepted: 8 May 2019
References
1. Woo Y, Reeves TC. Meaningful interaction in web-based learning: a social constructivist interpretation. Internet High Educ. 2007;10(1):15–25. 2. Michael Nussbaum E. Collaborative discourse, argumentation, and learning:
preface and literature review. Contemp Educ Psychol. 2008;33(3):345–59. 3. Neville AJ. Problem-based learning and medical education forty years on.
Med Princ Pract. 2009;18(1):1–9.
4. Schmidt HG, Rotgans JI, Yew EHJ. The process of problem-based learning: what works and why. Med Educ. 2011;45(8):792–806.
5. Slof B, Erkens G, Kirschner PA, Jaspers JG, Janssen J. Guiding students’online complex learning-task behavior through representational scripting. Comput Hum Behav. 2010;26(5):927–39.
6. Barron B. When smart groups fail. J Learn Sci. 2003;12(3):307–59. 7. Alamro AS, Schofield S. Supporting traditional PBL with online discussion
8. Janssen J, Bodemer D. Coordinated computer-supported collaborative learning : awareness and awareness tools. Educ Psychol.
2013;48(December 2014):40–55.
9. Borokhovski E, Bernard RM, Tamim RM, Schmid RF, Sokolovskaya A. Technology-supported student interaction in post-secondary education: a meta-analysis of designed versus contextual treatments. Comput Educ. 2016;96:15–28.
10. Bernard RM, Abrami PC, Borokhovski E, Wade CA, Tamim RM, Surkes MA, Bethel EC. A meta-analysis of three types of interaction treatments in distance education. Rev Educ Res. 2009;79(3):1243–89.
11. Laal M, Naseri AS, Laal M, Khattami-Kermanshahi Z. What do we achieve from learning in collaboration? Procedia - Social and Behavioral Sciences. 2013;93(2012):1427–32.
12. Kreijns K, Kirschner PA, Jochems W. Identifying the pitfalls for social interaction in computer-supported collaborative learning environments: a review of the research. Comput Hum Behav. 2003;19(3):335–53. 13. Abrami PC, Bernard RM, Bures EM, Borokhovski E, Tamim RM. Interaction in
distance education and online learning: using evidence and theory to improve practice. J Comput High Educ. 2011;23(2–3):82–103. 14. Bakharia A, Dawson S: SNAPP: a Bird’s-eye view of temporal participant
interaction. Proceedings of the 1st international conference on learning analytics and knowledge - LAK‘11 2011:168–168.
15. de Laat M, Lally V, Lipponen L, Simons R-J. Investigating patterns of interaction in networked learning and computer-supported collaborative learning: a role for social network analysis. Int J Comput-Support Collab Learn. 2007;2(1):87–103. 16. Rabbany R, Takaffoli M, Zaïane O. Analyzing participation of students in
online courses using social network analysis techniques. Eindhoven: Proceedings of educational data mining: 2011; 2011. p. 21–30. 17. Borgatti SP, Mehra A, Brass DJ, Labianca G. Network analysis in the social
sciences. science. 2009;323(5916):892–5.
18. Zhang J, Zhang J. A case study on web-based knowledge construction in Moodle platform. In: Computer science and education (ICCSE), 2010 5th international conference on, vol. 2010. Hefei: IEEE; 2010. p. 1110–4. 19. Saqr M, Fors U, Tedre M. How the study of online collaborative learning can
guide teachers and predict students' performance in a medical course. BMC Med Educ. 2018;18(1):24.
20. Saqr M, Fors U, Tedre M. How learning analytics can early predict under-achieving students in a blended medical education course. Med Teach. 2017;39(7):757–67.
21. Lockyer L, Heathcote E, Dawson S. Informing pedagogical action: aligning learning analytics with learning design. Am Behav Sci. 2013;57(10):1439–59. 22. Azer SA, Azer D. Group interaction in problem-based learning tutorials: a
systematic review. Eur J Dent Educ. 2015;19(4):194–208.
23. De Wever B, Schellens T, Valcke M, Van Keer H. Content analysis schemes to analyze transcripts of online asynchronous discussion groups: a review. Comput Educ. 2006;46(1):6–28.
24. Calvani A, Fini A, Molino M, Ranieri M. Visualizing and monitoring effective interactions in online collaborative groups. Br J Educ Technol. 2010;41(2):213–26. 25. Bastian M, Heymann S, Jacomy M. Gephi: an open source software for
exploring and manipulating networks. Icwsm. 2009;8:361–2.
26. Das K, Samanta S, Pal M. Study on centrality measures in social networks: a survey. Soc Netw Anal Min. 2018;8(1):13.
27. Hammer Ø, Harper DA, Ryan PD. PAST: paleontological statistics software package for education and data analysis. Palaeontol Electron. 2001;4(1):9. 28. Kollar I, Fischer F, Hesse FW. Collaboration scripts–a conceptual analysis.
Educ Psychol Rev. 2006;18(2):159–85.
29. Marcos-García J-A, Martínez-Monés A, Dimitriadis Y. DESPRO: a method based on roles to provide collaboration analysis support adapted to the participants in CSCL situations. Comput Educ. 2015;82:335–53. 30. Hou H-T, Chang K-E, Sung Y-T. Analysis of problem-solving-based online
asynchronous discussion pattern. J Educ Technol Soc. 2008;11(1):17–28. 31. Saqr M, Fors U, Nouri J. Using social network analysis to understand online
problem-based learning and predict performance. PLoS One. 2018;13(9): e0203590.
32. Saqr M, Fors U, Tedre M, Nouri J. How social network analysis can be used to monitor online collaborative learning and guide an informed intervention. PLoS One. 2018;13(3):e0194777.
33. Romero C, Ventura S. Data mining in education. Wiley Interdisciplinary Reviews: Data Mining and Knowledge Discovery. 2013;3(1):12–27.
34. Papamitsiou ZK, Economides AA. Learning analytics and educational data Mining in Practice: a systematic literature review of empirical evidence. Educational Technology & Society. 2014;17(4):49–64.
35. Al-Razgan M, Al-Khalifa AS, Al-Khalifa HS. Educational data mining: a systematic review of the published literature 2006-2013. In: Herawan T, Deris MM, Abawajy J, editors. Proceedings of the First International Conference on Advanced Data and Information Engineering (DaEng-2013). Singapore: Springer Singapore; 2014. p. 711–9.