GSJ: VOLUME 6, ISSUE 5, May 2018 37
GSJ: Volume 6, Issue 5, May 2018, Online: ISSN 2320-9186
www.globalscientificjournal.com
EFFECT OF TRAMADOL ON BIOCHEMICAL
PARAMETER USING MALE ALBINO RATS
1
Nwaogwugwu, C.J* ., 1Egege A.N.,1Okereke S.C., 2Ezekwe A.S., 1Akara E.U 1Department of Biochemistry, Faculty of Biological and Physical Sciences. Abia State University, PMB 2000, Uturu, Nigeria. 2Department Medical Biochemistry Imo State University, Owerri
*Corresponding Author Email: [email protected] Phone: +2348060539271
Abstract
Introduction: Analgesics are the traditional pain killer medications that are easily and commonly consume for different types of aches and pains. But the way young people abuse it is in increase in the society.
Aim: The present study investigated the effect of Tramadol administration on renal, liver and body
weight on albino rats. The present study was conducted to assess the effects of Tramadol on both liver
and kidney functions biomarkers using albino rat. Antioxidant levels, hematological parameter, liver, kidney histopathology were also evaluated.
Methods: Twenty five (25) male albino rats were randomly assigned into four groups 1, 2, 3 and 4. Animals in Group A served as control. Group 2: Received 600 mg/kg body weight tramadol treatment. Group 3: Received 800 mg/kg body weight tramadol treatment. Group 4: Received 1000 mg/kg body weight tramadol treatment. Group 5: Received 1500 mg/kg body weight tramadol treatment respectively for 28 days. The animals were sacrificed under ether anesthesia and the hepatic biomarkers were analyzed for aspartate aminotransferase (AST), alanine aminotransferase (ALT); alkaline phosphatase (ALP); triglyceride (TG); total bilirubin (TB); conjugated bilirubin (CB); albumin (ALB) and kidney biomarkers urea, creatinine, sodium, potassium and bicarbonate were investigated. Statistical Analysis: The result was statistically analysed using statistical package for social sciences (SPSS) version , Means were separated using Least Significant Difference. Group means were compared for significance at P<0.05. Data were represented as mean ± standard deviation.
Result: There was progressive increase in body weight at doses of 600mg/kg, 800mg/kg, 1000mg/kg and 1500mg/kg of rats during 28 days oral administration of the extract(p<0.05). The relative organ weight of the pancreas, the liver and the kidney however showed significant difference at p<0.05 between the Groups feed with Tramadol. The control group (group 1) showed prominent reduction of subcutaneous fat, compared to groups fed with high doses of Tramadol doses
(600mg/kg, 800mg/kg, 1000mg/kg and 1500mg/kg mg/b.w).There were significant increases in
kidney function biomarkers such as creatinine, urea and electrolytes at 800 mg/kg and 1000 mg/kg and 1500 mg/kg (p<0.05). AL, AST and ALP values showed significant (p<0.05) increase as dose administered exceeded 200mg/kg body weight. It was observed that as the dose administered to animals increased from 300 mg/kg body weight there was a significantly increase in ALT, AST and ALP were observed. There was a significant reduction in levels of RBC, HB, PCV MCHC, platelet, MCH and MCV in all groups from the control (p<0.05). The levels of SOD and GPx were found to be significantly higher in study group as compared to control group (P>0.05) while the level of CAT in the study group was significantly higher as compared to the control group (p>0.05). There is also significant increase in the levels of SOD as dose increased in the study group (p>0.05) when compared to control group.
Conclusion : Generally, the observed changes in the biochemical indices of liver and kidneyfunctions as well as histopathology are manifestations of moderate hepatotoxicity and nephropathy precipitated this drug administration
Key word: Hepatotoxicity, Nephropathy, Analgesics, Tramadol, Antioxidant.
GSJ© 2018
GSJ: VOLUME 6, ISSUE 5, May 2018 38
INTRODUCTION
Analgesics are the traditional pain medications that we all consume for different types of aches and pains. Common over-the-counter pain medications such as Aspirin and Tylenol are classified as NSAIDs (Non-steroidal anti-inflammatory drugs) and can treat most trivial muscular pains (Dworkin et al.,
2003). However, moderate to severe pain
(for example pain as a result of surgery or a fracture) is normally not responsive to over-the-counter pain medications. Tramadol is one of the most potent analgesics available today to treat moderately severe pain; however, like all pharmacological medications, tramadol is also harmful in large doses (or even in normal dosage in some genetically susceptible individuals) (Raffa et al.,1992).
For these situations, opioids are normally prescribed by healthcare professionals. Tramadol is considered superior to most opioids in terms of its clinical effectiveness and comparatively lower addiction potential when compared to other opioids such as morphine or codeine. It is indeed a top choice for the short-term management of post-operative or acute pain.
Tramadol is a centrally active synthetic opioid analgesic that is used extensively. Its mode of action is not completely understood, but two acceptable complementary mechanisms are binding to muopioid receptors (MOR) and inhibition of reuptake of noradrenaline and serotonin (Raffa et al.,1992).The drug exerted hypoglycaemia in users (Grandvuillemin et al.,2006) which influence growth hormone (GH) secretion suggesting that their GH
deficiency has a hypothalamic rather than pituitary origin (Spiller et al.,1997). From literature, multiple cases of toxicity and abuse of tramadol have been reported. The main symptoms of tramadol toxicity include central nervous system depression, nausea and vomiting, tachycardia, and seizures (Spiller et al.,1997; Shadnia et al.,2008) Fatal cases have been reported as a result of tramadol overdose. In those instances, death has been attributed to cardiopulmonary arrest and hepatic failure as well as hypoglycaemia (Loughrey et al.,2003; Daubin et al.,2007) The tramadol absorption is more than morphine reached to about 95-100% and absorbed rapidly in the small intestine and reached highest peak after 5 hours
(Lintz et al.,1981). It is widely distributed throughout the body, especially liver and kidneys . The present work was conducted to assess the effect of the drug on renal and liver biomarkers using male albino rats.
Biochemical Analysis
Whole blood samples were collected and allowed to clot. The sera samples collected were analyzed for creatinine, urea, potassium, sodium, bicarbonate and chloride based on the principles outlined by (Bartels et al., 1972), (Weatherburn, 1967), (Terri and Sesin, 1958), (Maruna, 1958; Trinder, 1951), (Forrester et al.,1976) and (skeegs and Hochestrasser, 1964) respectively, using standard biochemical reagent kits (Randox Laboratories Ltd., UK).
GSJ© 2018
GSJ: VOLUME 6, ISSUE 5, May 2018 39
Drug and Dose Treatment:
Tramal (Tramadol HCl), 50 mg capsules, was obtained from Jonat- Pharm, Umuahia, Abia State Nigeria. Its chemical name is (+) cis-2- [(dimethylamino) methyl]-1-(3-m ethoxyph-enyl) cyclo hexanol hydrochloride. According to Matthiesen et al. 1998, the LD50 values of oral administration were estimated to be around 300–350 mg/kg body weight for (rat and mouse).The therapeutic dose (40 mg/kg body weight) of this drug for rat was calculated according to Paget and Barnes 1964. The chosen dose was nearly comparable to the human effective therapeutic dose (ETD)
Determination of liver Integrity
Serum level of liver enzymes (AST, ALT and ALP) was also analyzed using method described by Reitman and Frankel (1957).
Histopathological Studies
The kidneys were embebbed in paraffin wax, sectioned at 5µm and stained with haematoxylin and eosin (Drury et al., 1993). Detailed microscopic examination was conducted on the kidneys from both control and treatment groups.
Experimental Designs:
Twenty five (25) male albino rats of the same stock were obtained from the animal house of Abia State University, Uturu. The animals were taken to the laboratory where they were housed in
plastic cage and placed on commercial feeds bought from the local market as produced by Nigeria Flour Mills, and were allowed food and water ad libitum. Ethical principles in animal handling was adhered to strictly. The albino rats were randomly divided into five groups of five animals each.
ANIMAL GROUP
Group 1: Served as control and were not
treated with the extract.
Group 2: Received 600 mg/kg body weight
tramadol treatment.
Group 3: Received 800 mg/kg body
weight tramadol treatment.
Group 4: Received 1000 mg/kg body
weight tramadol treatment.
Group 5: Received 1,500 mg/kg body
weight tramadol treatment.
Statistical Analysis
The results will be subjected to statistical analysis using Analysis of Variance (ANOVA). Group means will be compared for significance at p<0.05. Using Duncans multiple range tests data will be represented as mean ± standard deviation.
GSJ© 2018
GSJ: VOLUME 6, ISSUE 5, May 2018 40
Table 2: Body Weight of animals before and administration Tramadol (g)
Groups Body weight before Body weight after extract
n=5 Experiment. administration (after 28 days)
Group 1 91.517 + 8.565a 98.550 + 6.647b
Group 2 85.883 + 12.439a 74.933 + 12.315a
Group 3 76.950 + 3.532a 110.10 + 8.92c
6.290a 88.95 +
Group 4 85.567 + 12.065b
10.999a
Group 5 87.933 + 96.133 + 14.721b
Values are Mean + SD, of Triplicate determination. Values in the column (groups) with different superscripts are significantly different at (p<0.05) Mean in the column having different alphabet are statistical significant (p< 0.05)
Group 1 (control) showed increase in body weight from 91.517 + 8.565 to 98.550 + 6.647 after 28 days of administration while group 2 showed significant decrease in weight from 85.883 to 74.933, while groups 3,4 and 5 showed no significant (p<0.05) increase in body weight.
Therefore from this study it was observed that there was a general reduction in body weight between the control group when compared
with animals in the other groups feed with
Tramadol at different doses. The test groups lost more weight probably because of the high dose administration condition. (Akhere and Iyere, 2008).
TABLE 3: Effects of Tramadol on Relative Organ weight (%) After 28 Days of Administration
Group LIVER PANCREASE RIGHT KIDNEY LEFT KIDNEY
1 6.41 ± 1.87 3.44 ± 0.25 3.37 ± 0.22 3.53 ± 0.21 2 7.20 ± 5.34 1.83 ± 0.33 2.99 ± 0.58 3.03 ± 0.58 3 8.66 ± 3.32 4.27 ± 0.51* 3.91 ± 0.38* 3.88 ± 0.52* 4 5.33 ± 4.37* 2.12 ± 0.41 4.05± 0.77* 3.87 ± 0.85 * 5 6.41 ± 6.49 2.99 ± 0.68* 4.30 ±0. 78 * 4.32 ± 0.66 *
Values are the mean ± Standard deviation (SD) n=5, *The mean difference is significant the p<0.05 level from the controls group.
There was a remarkable change in the relative organ weight of the liver in all the group however there was a significant change in the weight of the kidney and the pancrese especially in animals in group 3 (three) to 5 (five) when compared to animals in group 2.
The organ weight and relative organ weight were determined because the animal weight before dissection would not have given a true effect of Tramadol on these organs. The relative organ weight of the pancreas, the liver and the kidney however showed significant difference at p<0.05 between the Groups feed with Tramadol. The control group (group 1) showed prominent reduction of subcutaneous fat compared to groups fed with high doses of Tramadol (1000 and 1500 mg/b.w). This was noticed during dissection.
GSJ© 2018
GSJ: VOLUME 6, ISSUE 5, May 2018 41
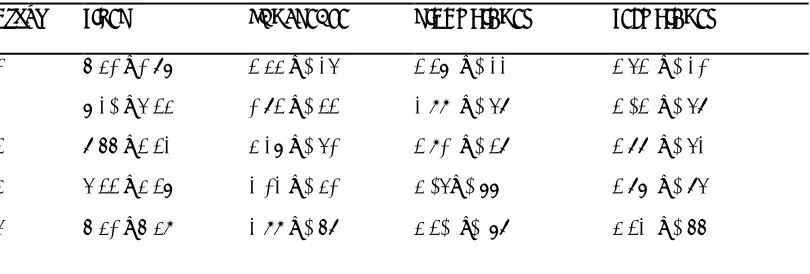
TABLE 3: EFFECTS OF TRAMADOL ON RENAL FUNCTIONS USING ALBINO RAT
Groups (mEq/L) Cl- (mEq/L) K+ (mEq/L) (mEq/L) (mg/dl) Urea(mg/L)
1 139.94+0.34e 98.567+0.72a 4.20+0.90c 24.10+0.09a 0.80+0.01a 40.76+1.85a 2 145.93+0.41d 100.75+0.52b 5.00+0.02c 25.99+0.09a 0.84+0.01b 46.79+2.13b 3 151.98+0.43c 104.17+0.47c 9.70+0.021b 28.01+0.08b 0.89+0.02c 51.32+2.82c 4 167.16+0.36b 105.67+0.26d 10.49+0.3 30.02+0.12b 0.94+0.01d 61.89+2.39d
Values are mean + Standard Deviation (SD) for n=5 and mean along the column with different alphabetical superscripts indicates a significant different (P<0.05).
There were significant improvement in renal function paremeters of animals fed with of Tramadol from groups 2-5 when compared with animals in group 1 which serves as the control group.
The Kidney is highly susceptible to toxicants because, a high volume of blood flows through it and its ability to filter large amounts of toxins which can concentrate in the kidney tubules. It can result in systemic toxicity causing: decreased ability to excrete body wastes, inability to maintain body fluid and electrolyte balance and decreased synthesis of essential hormones.
Sodium ions are necessary in small amounts for some types of plants, but sodium as a nutrient is more generally needed in larger amounts by animals, due to their use of it for generation of nerve impulses and for maintenance of electrolyte balance and fluid balance. In animals, sodium ions are necessary for the aforementioned functions and for heart activity and certain metabolic functions. The health effects of salt reflect what happens when the body has too much or too little sodium (Pohl et al.,2013). From this study there was increase in Sodium ions concentration. Whenever there is an increase in sodium concentration in the blood, the kidney releases most of it in order that there will be enough water for use of the body.
GSJ© 2018
www
.globalscientificjournal.com
But when there is a decrease in its concentration, there is more release of water to store more sodium which the body needs dearly. This process is known as osmoregulation. Sodium acts on the juxtaglomerular cells of the kidney, which are then activated to produce and secrete renin. Renin hydrolyses angiotensinogen into angiotensin I. Next angiotensin converting enzyme (ACE) converts angiotensin I to angiotensin II. Angiotensin II is the product that causes the increase in blood pressure, because it is a potent vasoconstrictor. With peripheral vasocontriction the heart has more resistance to pump blood against, thus higher blood pressure. Additionally, angiotensin II stimulates secretion of aldosterone from the adrenal glands, which acts on the distal tubules and collecting ducts in the kidney to retain sodium and water, thereby increasing blood volume and thus blood pressure. From this study high dosage of tramadol can cause increase in blood pressure.
There was increase in Potassium ion when compared to the control. Potassium is an essential electrolyte, which is a mineral your body needs to function correctly. Potassium is especially important for your nerves and muscles, including your heart. While potassium
is important to your health, getting too much of the nutrient can be just as bad as, or worse
than, not getting enough. Normally, your kidneys keep a healthy balance of potassium by flushing excess potassium out of your body. But for many reasons, the level of potassium in your blood can get too high. This is called hyperkalemia, or high potassium. This could be as a result of over intake of Tramadol.
There where increase in Urea when compared with the control group. Urea is the principal nitrogenous waste product of metabolism and is generated from protein breakdown. In renal disease, the serum urea accumulates because the rate of serum urea production exceeds the rate of clearance (Mayne and Mayne, 1994). It is eliminated from the body almost exclusively by the kidneys in urine, and measurement of its concentration, first in urine and later in blood, has had clinical application in the assessment of kidney (renal) function for well over 150 years.
Creatinine is derived from creatinine and creatine phosphate in muscle tissues and may be defined as a nitrogenous waste product. Creatinine is not reutilized but is excreted from the body in the urine via the kidney. It is
produced and excreted at a constant rate which is proportional to the body muscle mass. In this study, there were significant changes in the level of creatinine between control and test groups which suggests kidney impairment. Also in the case of serum urea, there was also significant difference p<0.05 between the values of control group and test groups, which implies that there was elevation of serum urea due to administration of Tramadol. The increase is more pronounced at the group that receive high dosage. The rate of creatinine production is constant, elevation of serum creatinine is an indicative of under-excretion, suggesting kidney impairment (Adekola et al.,2006)
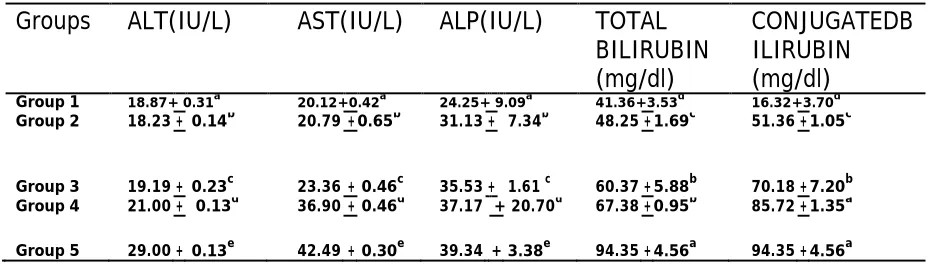
TABLE 5: EFFECTS OF Tramadol on LIVER ENZYMES
Groups ALT(IU/L) AST(IU/L) ALP(IU/L) TOTAL CONJUGATEDB
BILIRUBIN ILIRUBIN
(mg/dl) (mg/dl)
Group 1 18.87+ 0.31a 20.12+0.42a 24.25+ 9.09a 41.36+3.53d 16.32+3.70d
Group 2 18.23 + 0.14b 20.79 + 0.65b 31.13 + 7.34b 48.25 + 1.69c 51.36 + 1.05c
Group 3 19.19 + 0.23c 23.36 + 0.46c 35.53 + 1.61 c 60.37 + 5.88b 70.18 + 7.20b
Group 4 21.00 + 0.13d 36.90 + 0.46d 37.17 + 20.70d 67.38 + 0.95b 85.72 + 1.35a
Group 5 29.00 + 0.13e 42.49 + 0.30e 39.34 + 3.38e 94.35 + 4.56a 94.35 + 4.56a
Values are Mean + SD of Triplicate determination. Values in the Colum (group) with different superscripts are significantly different (p<0.05)
Legend: AST = Asparate Aminotransferase, ALT = Alanine Aminotransferase, ALP = Alkaline Phosphatase, U/L = Unit per litre
GSJ© 2018
ALT,AST and ALP values showed significantly (p<0.05) increase as dose administered exceeded 800mg/kg body weight. It was observed that as the dose administered to animals increased from 800 mg/kg body weight there was a significantly increase in ALT, AST and ALP were observed. This implies that above 800mg/kg body weight dose, the drug affects liver of the animals. Total Bilirubin and Conjugated Bilirubin increased significantly. Bilirubin is associated with serum albumin and transported to the liver where it is conjugated by Glucuronic acid to form Bilirubin Dylucuonide (Conjugated Bilirubin). The conjugated Bilirubin is soluble and then excreted into the bile.
ALP, ALT and AST are important liver marker enzymes that are associated to the hepatocellular damage, with ALT being more specific. AST and
ALT are of higher concentrations in the hepatocytes, however only ALT is remarkably specific for liver function since AST is also present in the myocardium, skeletal muscle, brain and kidneys A mild elevation of AST level has been shown to be associated with liver injury or myocardial infarctions (Witthawasku et al., 2003). A significant difference (P>0.05) were observed in serum alkaline phosphatise (ALP), alanine aminotransferase (ALT), and aspartate aminotransferase (AST) activities in all the groups when compared with the control group. The increase was pronounced in group 5, which received 1000 mg/kg. This suggests that there is a compromise on the integrity of the liver since elevation of these enzymes in the serum are indications of their leakage into the bloodstream due to liver damage. This correlates with the histopathology findings.
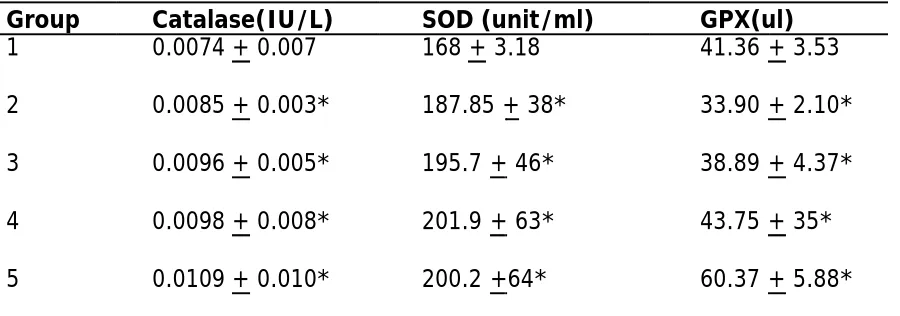
Table 4: Effect of Tramadol Administration on antioxidant activities
Group Catalase(IU/L) SOD (unit/ml) GPX(ul)
1 0.0074 + 0.007 168 + 3.18 41.36 + 3.53
2 0.0085 + 0.003* 187.85 + 38* 33.90 + 2.10*
3 0.0096 + 0.005* 195.7 + 46* 38.89 + 4.37*
4 0.0098 + 0.008* 201.9 + 63* 43.75 + 35*
5 0.0109 + 0.010* 200.2 +64* 60.37 + 5.88*
Values are the mean ± Standard deviation (SD) n=5, *The mean difference is significant the p<0.05 level from the controls group.
GSJ© 2018
www.globalscientificjournal.com
The levels of SOD and GPx were found to be significantly higher in study group as compared to control group (P>0.05) while the level of CAT in the study group was significantly higher as compared to the control group (p>0.05). There is also significant increase in the levels of SOD as dose increased in the study group (p>0.05) when compared to control group.
The interplay between free radicals, antioxidants, and co-factors is important in maintaining health, aging and age-related diseases. Free radicals induce oxidative stress, which is balanced by the body’s endogenous antioxidant systems with an input from co-factors, and by the ingestion of exogenous antioxidants. If the generation of free radicals exceeds the protective effects of antioxidants, and some co-factors, this can cause oxidative damage which accumulates during the life cycle, and has been implicated in aging, and age dependent diseases such as cardiovascular disease, cancer, neurodegenerative disorders, and other chronic conditions.
Comparison of enzymatic antioxidants in the serum between the study and control group is shown in Table 4. The levels of SOD and GPx were found to be significantly higher in study group as compared to control group (P>0.05) while the level of CAT in the study group was significantly higher as compared to the control group (p>0.05). Catalase is an enzyme that is present in the peroxisome of aerobic cells and is very efficient in promoting the conversion of hydrogen peroxide to water and molecular oxygen. Catalase has one of the highest turnover rates for all enzymes: one molecule of catalase can convert approximately 6 million molecules of hydrogen peroxide to water and oxygen each minute (Mates et al .1999).
The level of SOD was found to be significantly increased as dose increased in the study group (p>0.05) when compared to control group. SOD is one of the most effective intracellular enzymatic antioxidants and it catalyzes the conversion of superoxide anions to dioxygen and hydrogen peroxide. Superoxide dismutase exists in several isoforms, which differ in the nature of active metal centre, amino acid composition, co-factors and other features. There are three forms of SOD present in humans: cytosolic Cu, Zn-SOD, mitochondrial Mn-SOD, and extra cellular-SOD (Landis and Tower 2005). Superoxide dismutase neutralizes superoxide ions by going through successive oxidative and reductive cycles of transition metal ions at its active site (Chaudière and Ferrari-Iliou 1999). Cu, Zn-SOD has two identical subunits with a molecular weight of 32 kDa (Mates et al. 1999) and each of the subunit contains as the active site, a dinulcear metal cluster constituted by copper and zinc ions, and it specifically catalyzes the dismutation of the superoxide anion to oxygen and water. The mitochondrial Mn-SOD is a homotetramer with a molecular weight of 96 kDa and contains one manganese atom per subunit (Mates et al. 1999), and it cycles from Mn(III) to Mn(II), and back to Mn(III) during the two-step dismutation of superoxide. Extra cellular superoxide dismutase contains copper and zinc, and is a tetrameric secretary glycoprotein having a high affinity for certain glycosaminoglycans such as heparin and heparin sulphate (Mates et al. 1999), however, its regulation in mammalian tissues occurs primarily in a manner coordinated by cytokines, rather than as a response to oxidative stress.
GSJ© 2018
From the study there was increase in GPx when compared to the control(p<0.05). Glutathione peroxidase (GPx) is a selenium-containing antioxidant enzyme that effectively reduces H2O2 and lipid peroxides to water and lipid alcohols, respectively, and in turn oxidizes glutathione to glutathione disulfide. Reduced glutathione plays a major role in the regulation of the intracellular redox state of vascular cells by providing reducing equivalents for many biochemical pathways. In the absence of adequate
GPx activity or glutathione levels, hydrogen peroxide and lipid peroxides are not detoxified and may be converted to OH-radicals and lipid peroxyl radicals, respectively, by transition metals (Fe2+)( Muller et al. 2007). The GPx/glutathione system is thought to be a major defense in low-level oxidative stress. Four isoforms of GPx have been identified and characterized: GPx-1 (cellular GPx) is ubiquitous and reduces H2O2 and fatty acid peroxides, and has been inversely associated with increased cardiovascular risk (Bhabak et al. 2010).
HISTOPATHOLOGY RESULTS
KIDNEY
G
G BV
BV
Plate 1: Photomicrograph of the kidney group 1(Control) showing the normal
renal histo-architecture. Glomeruli (G); Renal tubules (arrow), Blood vessels
(BV). H&Ex100.
GSJ© 2018
GSJ: VOLUME 6, ISSUE 5, May 2018 48
RT
G
RT
RT
Plate 2
: Photomicrograph of the kidney collected from the animals in group 2
showing the normal renal histo-architecture. Glomeruli (G); Renal tubules (RT),
Bowman’s capsule (arrow). H&Ex400.
RT
RT
RT
G RT
Plate 3
: Photomicrograph of the kidney tissue collected from the animals in
group 3 showing the normal renal histo-architecture. Glomeruli (G); Renal
tubules (RT), Bowman’s capsule (arrow). H&Ex400.
GSJ© 2018
GSJ: VOLUME 6, ISSUE 5, May 2018 49
BV
G
G G
Plate 4: Photomicrograph of the kidney tissue collected from the animals in
group 3 showing the normal renal histo-architecture. Glomeruli(G); Renal
tubules (arrow), Blood vessel (BV). H&Ex100.
G G
G
Plate 5.: Section of the kidney tissue collected from group 5 showing numerous renal tubules of the cortex undergoing degenerative and necrotic changes (arrow). Glomeruli (G).Pyknotic nucleus (red arrow).H&Ex100;400
Sections of the kidney from
group 5
which was administered the highest
dose of the extract showed changes
consistent with renotoxicity. Normal
structures of the glomeruli and
Bowman’s capsules were observed.
However, the renal tubules in both
the cortex and outer medulla showed
varying degenerative and necrotic
changes in the tubular epithelial
lining cells. The lesions was randomly
observed affecting all the proximal
convoluted tubules, pars recta and
distal convoluted tubules of the
cortex and outer medulla while the
collecting ducts appeared normal.
The changes varied from cellular
swelling and vacuolar degeneration
to cellular necrosis with nuclear
pyknosis and/or karyorrhexis. The
basement membranes of the renal
tubules were unaffected.
GSJ© 2018
GSJ: VOLUME 6, ISSUE 5, May 2018 50
LIVER
G
Plate 6: Photomicrograph of the liver tissue from animals in group 1 showing the
arrangement of normal hepatocytes in interconnecting chords (arrow) around a central vein (V). H&EX400 .
The sections of the liver collected from groups 1 to 4 did not show any alteration from the normal hepatic histo-architecture of laboratory rodents. The sections showed normal hepatic lobules consisting of normal hepatocytes arranged in interconnecting chords, in a radiating manner around the central veins. The hepatic chords were separated by the hepatic sinusoids and radiate towards the periphery of the hepatic lobules where they join the portal triads which were made up of normal hepatic artery, hepatic vein and bile ducts.
B V
A
C
Plate 7: Photomicrograph of the liver tissue collected from the animals in group 2 showing the normal hepatic histo-architecture. The hepatocytes can be observed, arranged in chords and converging towards the portal area which contains the hepatic artery (A), hepatic vein (V) and bile duct (B). Central vein (C).H&Ex100.
GSJ© 2018
GSJ: VOLUME 6, ISSUE 5, May 2018 51
C
Plate 8: Photomicrograph of the liver tissue from animals in group 3 showing the normal hepatic histo-architecture. Normal hepatocytes arranged in chords (arrow) can be seen around the central vein (C). H&Ex400.
C
A
B
Plate 9: Photomicrograph of the liver tissue collected from the animals in group 4 showing the normal hepatic histo-architecture. Normal hepatocytes arranged in radiating chords around the central veins can be observed. Normal components of the portal area can also be observed. Hepatic artery (A), Bile duct (B,H&Ex100.
GSJ© 2018
GSJ: VOLUME 6, ISSUE 5, May 2018 52
C
Plate 10: Photomicrograph of the liver tissue collected from the animals in group 5 showing a mild to moderate, widespread vacuolar degeneration of the hepatocytes (arrow). The hepatocytes appear slightly swollen and contain numerous minute vesicles (clear spaces) in their cytoplasms. Central vein (C).H&Ex400. Sections of the liver collected from the animals in group 5 which was treated with the highest dose of the test extract showed changes consistent with hepatotoxicity. Mild to moderate cellular swelling were observed, involving all the described anatomic zones of the hepatic lobule (centrilobular, mid-zonal and periportal zones). The hepatic chords consisted of hepatocytes with swollen, micro-gesticulated cytoplasm. The swollen hepatocytes tend to occlude the hepatic sinusoids.
REFERENCES
Adekola FA, Salami N, Lawal SO(2006)Trace elements in surface water and sedi-ments of Oyun River, Kwara State,
Nigeria.Research Communications in
Chemistry;1(1): 24-30.
Adekola, F.A., Salami, N. and Lawal, S.O. (2003) Some trace elements determination in surface water and sediments of Oyun River, Kwara State, Nigeria.
Akhere, A. and O. Iyere,O (2008) Effect of Irvingia grandifolia, Urena lobata and Carica papaya on the oxidative status of normal rabbit. Int. J. Nutr. Wellness, Vol. 6.
Bartles H, Bohmer M and Heierli C (1972) Serum creatinine determination without protein
precipitation. Clinica Chimica
Acta 37: 193-197
Bhabak, K.P. and Mugesh, G. ( 2010). "Functional mimics of glutathione peroxidase: bioinspired synthetic
antioxidants". Accounts of
Chemical Research. 43 (11):
1408–19.
Forrester, J.S., Diamond, G. and Chatterjee, K., (1976) Medical therapy of acute myocardial infarction by application of
hemodynamic subsets (second of two parts). The New England Journal of Medicine, 295, 1404-1413.
Grandvuillemin A., Jolimoy, G., Authier,
F., Dautriche A., Duhoux F. and Sgro C.(2006) Tramadol-induced
hypoglycemia. 2 cases. Presse
Med. 35(12 Pt 1):1842-4
GSJ© 2018
GSJ: VOLUME 6, ISSUE 5, May 2018 53
Landis G.N and Tower J.(2005)Superoxide dismutase evolution and life span regulation. Mech Ageing Dev. 126(3):365-79
Lintz W, Erlacin S, Frankus E, Uragg H.(1981) Metabolismus von Tramadol bei Mensch und Teir. Arzneimittel-Forschung/Drug Research 31: 1932–1943 Loughrey,m.b., Trivett, M., Beshay, V.,Dobrovic, A., Kovalenko, S., Murray, W.,
Lade, S., Turner, H., McArtur G.A., Zalcberg, J. and Waring,
P.M.(2007) Kit immunohistochemistry and
mutation status in gastrointestinal stromal tumour, evaluated for treatment with imatinib. Histopathology 49(1)52-65
Maruna, R. F. L. (1958). Clinica Chimica Acta, 21, 581.
Mates JM, Perez-Gomez C, De Castro (1999) Antioxidant enzymes and human diseases. Clin Biochem. 32:595–603
Muller FL, Lustgarten MS, Jang Y, Richardson A, Van Remmen H ( 2007). "Trends in oxidative aging theories". Free Radical Biology &
Medicine. 43 (4): 477– 503.
Paget, G. E. and Barnes, J. M., Toxicity tests in evaluation of drug
activities pharmacometries (Laurence, D. R. and Bacharach, A. L. eds) Academic Press, London and New York, 1964. Pierri, J.N, Chaudry, A.S, Woo, T.U. and
Lewis, D.A.(1999) Alterations in chandelier neuron axon terminals in the prefrontal cortex of
schizophrenic subjects. Am J
Psychiatry. 156(11):1709-19 Pohl, Hanna R.; Wheeler, John S.;
Murray, H. Edward (2013). "Chapter 2. Sodium and Potassium in Health and
Disease". In Astrid Sigel, Helmut Sigel and Roland K. O. Sigel. Interrelations between Essential Metal Ions and Human Diseases.
Metal Ions in Life Sciences. 13.
Springer. pp. 29–47.
Raffa,R.B., Friderichs,E., Reimann,W., Shank,R.P., Codd, E. and Vaught J.L.(1992) Opioid and nonopioid components independently contribute to the mechanism of action of tramadol, an 'atypical' opioid analgesic.Journal of Pharmacology and Experimental Therapeutics January, 260 (1) 275-285
Reitman, S. and Frankel, S. (1957) A colorimetric methid for the determination of serum glutamic oxaloacetic and glutamic pyruvic transaminases activity. American Journal of Clinical Pathology 28:56- 63
spiller, D.G and TIDD, D.M.(1995) Nuclear delivery of antiscnse oligodeoxynucleotide through reversible permeable of human leukemia cells with streptolysin . Antisense Rev. Dev. 5,13-21 Skeggs, L.T. and Hochstrasser,
H.C.(1964). Thiocyanate (colometric) Method of Chloride Estimation. J. Clin. Chem. 10 : 918
Trinder, P. (1969) Determination of glucose in blood glucose oxidase with an alternative oxygen
acceptor. Annals of Clinical Biochemistry 6:24-27
Weatherburn, M. W. (1967): Phytochemical. Anal Chem. 39:971.
Dworkin RH, Backonja M, Rowbotham MC, Allen RR, Argoff CR, Bennett GJ, (2003).
"Advances in neuropathic pain: diagnosis, mechanisms, and treatment
recommendations". Archives of
Neurology. 60 (11): 1524–34
GSJ© 2018