A Novel Method to Detect Public Health in Online Social
Network Using Graph-based Algorithm
R.Devika
1, S.Sinduja
1, V.Subramaniyaswamy
1,*1School of Computing, SASTRA Deemed University, Thanjavur, Tamilnadu, India.
Abstract
INTRODUCTION: Twitter has played an important role in the social life of people. The health-related tweets are extracted and find the spread of epidemic disease on network. It can provide as a starting place of individual data to learn the physical condition of users.
OBJECTIVES: Key objective is to develop graph-based algorithm to detect public health in online social network.
METHODS: The proposed method collect the tweets relating to general health in twitter using the min-cut algorithm. The algorithm finds the minimum cut off an undirected edge-weighted graph. The runtime of the algorithm seems to be faster than other graph algorithms. Min-cut is reliable and good in network optimization and prevents redundancy.
RESULTS: To evaluate the performance, we utilize the health dataset on the detection of epidemic disease. The proposed method using a graph-based algorithm is the best in terms of accuracy, precision, and recall. With respect to the confusion matrix, Min-cut provides the highest true positive when compared to Text rank and K-Means algorithm.
CONCLUSION: Proposed health detection method using graph-based algorithm is better than Text Rank and K-Means in all aspects.
Keywords: Online Social Network (OSN), Support Vector Machine (SVM), Min cut, Text rank, K-Means, Twitter, Tweets. Received on 04 April 2019, accepted on 10 May 2019, published on 15 May 2019
Copyright © 2019 R.Devika et al., licensed to EAI. This is an open access article distributed under the terms of the Creative Commons Attribution licence (http://creativecommons.org/licenses/by/3.0/), which permits unlimited use, distribution and reproduction in any medium so long as the original work is properly cited.
doi: 10.4108/eai.13-7-2018.162669
*Corresponding author Email: [email protected]
1. Introduction
Social website improvements and the fast blast in sum and multifaceted nature of data created with the helpful asset of Internet contributions have turned out to be troublesome now not handiest mechanically, however moreover regarding programming program application areas[1]. Performance and accessibility of data handling are significant components that should be assessed considering the truth that traditional information preparing instruments won't offer alright valuable assets.
It has been viewed as an incredible gadget by and by utilized by each little and enormous gatherings and organizations, similar to Google and Facebook, anyway furthermore open and private medicinal services establishments [2].
Online life is the place one gets the chance to learn, offer, and express their decisions on explicit issues. We may build some additional data about the issue from that opinion [5]. These stages interface people over the globe. We live in general people where the scholarly data on the Internet is making at a fast pace and various affiliations are endeavoring to use this tempest of data to focus people's points of view towards their things [6]. An inconceivable wellspring of unstructured substance information is consolidated into social affiliations, where it is unfeasible to physically separate such degrees of data. There are limitless nice affiliations areas that enable customers to contribute, change and grade the substance, similarly as to express their emphatically held assessments about unequivocal center interests [7].
A few models circuit goals, social gatherings, thing examines targets, in addition, agreeable frameworks, like Twitter (http://twitter.com/). These models are showing up as the future model in mining making data streams. The tweets are colossal for appraisal since data get in contact at a high repeat and figurings that approach them must do in that cutoff under mentioning goals of the purpose of control and time [8]. To amass classifiers for tweets setting, we need to accumulate masterminding data with the objective that we can apply credible learning counts.
With the increased usage of social media in recent years; an individual’s knowledge sources have got expanded Twitter among all other social media is the most popular micro-blogging service with the highest amount of followers [9]. People share their opinions irrespective of the place or the time. Generally, the length of a tweet is limited to 240 characters (experimental) which previously were 140. Although only a little amount of information can be gained from one particular tweet, a vast amount of information can be obtained from an accumulated content. Twitter has been a valuable source of information for a long time in various issues [10].
Twitter has helped in the investigation of different issues like political race result, recognizing seismic tremors before the legislature could. Tweets can likewise be convenient in some significant issues, for example, general wellbeing. For instance clients for the most part tweet in such a manner "I have extreme migraine", "I have been determined to have pneumonia". Tweets like this may give us a way to find any comparative cases [11]. Twitter information is utilized as a source, for instance, in assessment evaluation where the undertaking is to depict messages into two classes relying upon whether they pass on positive or negative inclinations, since wandering tweets physically as positive or negative is a hazardous and lavish task [12]. Nevertheless, a huge perfect condition of Twitter information is that different tweets have producers given supposition markers:
changing supposition ensures in the utilization of different sorts of emoticons [13].
Smileys or emojis are a visual sign that is connected with stimulated states [19]. Exactly, when the producer of a tweet utilizes an emoji he is commenting on his have content with a blasting state. Such commented on tweets can be utilized to set up a supposition classifier [14]. Spouting figurings utilize probabilistic information structures with estimations that may offer splendid approximated responses. Adventitiously, dynamic online checks are bound by the memory and data to move motivation behind the confinement of a solitary machine. Accomplishing results snappier and scaling to continuously significant information streams as a last resort requires the utilization of parallel and orbited figuring [15].
Information stream pushing assessment are depended on to deal with the information beginning at now made, at a dependably broadening rate, from different sources: sensor systems, estimations in structure checking and traffic the bosses log records or click streams in web seeing, making structures call detail records, email, blogging, Twitter posts, etc [16]. In reality, all information made can be considered as spilling information or as a depiction of gushing information, since it is confirmed during a period break. This information is not overseen and passed on in immense sums and is referenced as goliath data [20]. By definition, colossal information in human affiliations proposes electronic tremendous and complex prospering illuminating aggregations, difficult to control standard checks[17]. Gigantic information in government oversaw reserve funds is overpowering a quick after effect of its volume, paying little respect to in like manner consider the changing collection of information types and the speed at which it must be overseen. Information related to quiet restorative affiliations and thriving is cosmetics "tremendous information" in the administration handicap industry [18].
analyzed its performance with other algorithms and proved min-cut outperforms the text rank algorithm.
2. Related works
To get health data, we have analyzed many common and prevalent diseases. Some of the diseases are TB, HIV, Rabies, Malaria, Cholera, Influenza, Measles, Hepatitis A, Whooping cough, Mumps, Chickenpox, Rubella, Gonorrhea, Syphilis, Zika, Ebola, Yellow fever, Typhoid, Dengue, Chikungunya, Diabetes, Obesity, Heart disease, Cancer, Mental illness, Auto immune diseases, Stroke, Alzheimer’s disease, etc. These diseases related words are chosen as keywords to retrieve the tweets [22].
The health-related tweets arrive at very high frequency and have a large volume of unstructured data. These tweets are most important for analysis and predict health-related issues. An online clustering algorithm is restricted by memory and bandwidth of stand-alone machines [23 24]. Various clustering algorithm has been surveyed to replace text rank keyphrase extraction algorithm and they are mentioned below,
2.1 Connectivity models
In availability models, closeness is found through the information that focuses on untruth closer in information space than the information point that lies far away. These models pursue two approaches. They either characterize all information into discrete bunches and afterward total them as the separation diminishes or group information as a solitary group and after that parcel as the separation between them increments. Additionally, the decision of separation capacity is natural. In spite of the fact that these models are anything but difficult to clarify while taking care of enormous datasets, it needs adaptability. Models that utilization this are various leveled bunching calculations and their variations[25].
2.2 Centroid models
Centroid models are grouping strategy that runs iteratively, and likeness is determined through the closeness of information that focuses on the centroid of the bunches. One of the most mainstream calculations in this model is K-Means grouping. Toward the starting itself, we should make reference to the number of groups required, which makes it significant for these models to have earlier learning of the data set. So as to locate the neighborhood optima these models run iteratively [26].
2.3 Distribution models
The transport model is a verifiable approach. Over the data, it performs iteratively. Continuously every data record is examined. The closeness between each record and at present existing gatherings is resolved. From the start, no bundles exist. The record is added to the material gathering if the decided comparability lands at the farthest point. In like manner the qualities of this gathering change. Another gathering is made, if the resemblance decided doesn't land at the edge, or if there is no pack, where the record alone is contained. It is possible to decide as far as possible similarly as the most outrageous number of groups [27].
2.4 Density models
In thickness models bunching depends on thickness, determined either from privately associated thickness focuses or by unequivocally developed thickness work. Here bunches are isolated by low thickness areas objects. Information in low-thickness areas is considered as commotion or exceptions. Its job in discovering nonlinear shapes structure is a crucial one. Its primary component is discovering bunches with subjective shapes [28].
2.5 Graph models
Clustering is performed in graph models by grouping graph into several clusters/groups based on some relevance. Cluster is made by cutting or discarding the useless edges. The clusters are called community clusters. The graph clustering applications are different from other clusterings. It has its own methods such as MST clustering, Markov clustering, Chameleon and Star Clustering. After analyzing various clustering algorithms, we have proposed a min-cut clustering algorithm for keyphrase extraction [29]. For persuasive recommendation, a travel plan is created based upon active target user, user id and location [30][33]. Many types of wearable sensor devices contain unobtrusive sensors, smart textiles and printable electronic tattoos for health detection [31]. The cloud service has an enormous amount of health information will provide information to healthcare service which will reduce cost [32][34]. It also helps to improve the early detection and prevention of chronic diseases [35][36].
4 talks about test set-up and test results. Figure 5 closes the paper with dialog.
3. Health detection method
3.1 Data preprocessing
Tweets are collected through twitter API. Twitter API can be accessed by creating an API account. By creating account we get API key, API secret key, access token, access token secret key. By mentioning these authorization keys, the tweets are retrieved for the keywords separately, and then the tweets are merged as one document. The retrieved tweets are preprocessed and are classified as positive and negative manually based on our implementation. To find key phrases from min cut, the frequency matrix must be fed as input to min-cut algorithm. For that, first the frequencies among words have to be noted and the matrix has to be constructed manually. Fig. 1 represent the word cloud of the preprocessed text.
3.2 Retrieving Health data
The classified positive and negative tweets are separately fed as input to text rank and the positive and negative key phrases are extracted. In the same way, the positive and negative tweets frequency matrix is fed to min-cut and the corresponding is obtained, from which the key phrases have to selected manually
Fig. 1. Word cloud using the Min-cut algorithm
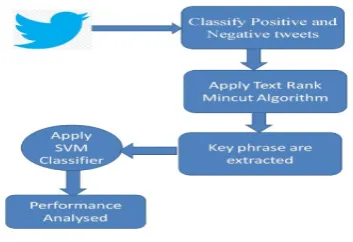
Fig. 2. Architecture Diagram for Health Detection System.
Twitter Data has both negative and positive tweets. The tweets are preprocessed. Keyword extraction algorithms such as Text Rank and Min-cut algorithms are applied to the processed tweets as shown in Fig. 2. Keyphrases are extracted and converted into a dataset of the different algorithms. SVM classifier algorithm is applied for both the datasets. Then the performance of both the algorithm is analyzed.
After selecting the key phrases, the dataset has to be constructed manually for text rank and min-cut separately. The dataset consists of both labeled tweets and key phrases. The SVM classifier is trained by both text rank and min-cut dataset separately. SVM predicts the test data for both trainings separately, by which the performance can be measured. After implementing SVM we get health-related tweets.
Algorithm for Health Detection System
Input: Streaming Data from Online Social Network(OSN)
Output: MinCutPhase(G,W,a))
1.function: MinCutPhase(Graph G, Weights W, Vertex a):
2. A <- {a} 3. while A != V:
3.1 add tightly connected vertex to A
3.2 store cut_of_the_phase and shrink G by merging the two vertices added last
4. minimum = INFfunction: MinCut(Graph G, Weights W, Vertex a):
5.1 MinCutPhase(G,W,a)
5.2 if cut_of_the_phase < minimum: 5.3 minimum = cut_of_the_phase 6. return minimum
Table 1. Confusion matrix value for three algorithms
Table 1. says that Min-cut Algorithm gives the best value for the confusion matrix.
In Table 1, The further analysis of min-cut and text rank algorithm performance, confusion matrix have been constructed which consists of True Positive (TP), True Negative (TN), False Positive (FP) and False Negative (FN) data. Using this confusion matrix, Accuracy, Sensitivity, Specificity, F1, Recall, Precision have been calculated and their formulas are mentioned below,
4. Analyses
We have analyzed the performance of min-cut and text rank algorithm by considering the following parameters, such as, number of tweets, accuracy, sensitivity, specificity, F1 score, Precision, and Recall, each of which are described below,
Accuracy: It is the measurement of being precise or that
conforms to the appropriate value or a standard as given in equ (1).
Accuracy = (TP+TN)/TP+FP+FN+TN (1)
Sensitivity: Sensitivity calculates from equ (2) the
fraction of positives that are correctly identified as positives.
Sensitivity= TP/ (TP+FN) (2)
Specificity: Specificity calculates from equ(3) the
fraction of negatives that are correctly identified as negatives.
Specificity = TN/ (TN+FP) (3)
Precision: Precision otherwise called positive predictive
value is used to find the fraction of relevant instances among the retrieved instances using the following equ(4).
Precision = TP/ (TP+FP) (4)
Recall: Recall in equ(5) otherwise called sensitivity is
used to find the fraction of relevant instances that have been extracted over the whole amount of relevant instances.
Recall = TP/ (TP+FN) (5)
F1 Score: The F1 score otherwise called score or
F-measure is used to find test's accuracy. The obtained result of analysis are mentioned in equ(6). In fig 3 the predicted analysis is given and in fig 4 says that various performance analysis metric shows that min cut give best performance compared to text rank.
F1 score = 2TP/(2TP+FP+FN) (6)
Fig. 3. Predicted analysis for min-cut and text rank algorithm
Fig. 4. Various analysis for Min-Cut algorithm
ALGORITHM TP TN FP FN
MINCUT 210 90 53 47
TEXTRANK 174 62 73 57
Table 4. Represent the comparison between min-cut and text rank. It says that min-cut is better than the text rank algorithm. The correct number of tweets that match the total number of tweets in the min-cut algorithm is more than the algorithm.
Table 4. Comparison between Min-cut and Text Rank Algorithm
ALGORITHM PRECISION RECALL F1 TOTAL
NUMBER OF TWEETS
CORRECT NUMER OF TWEETS
TEXTRANK 0.7166 0.7403 0.7283 400 264
MINCUT 0.7981 0.7488 0.7727 400 264
The correct number of tweets that match the total number of tweets in the mincut algorithm is more than the TextRank algorithm. So mincut algorithm outperforms the TextRank algorithm. Other analysis conducted between Mincut and PageRank algorithm shows that Mincut performs better than the existing method.
5. Conclusion and Future Work
Our motive of the project to obtain health related data from twitter data is achieved along with the algorithm comparison for its efficient outcome. Min cut algorithm has many variations. This paper consider undirected graph using min cut algorithm. This algorithm is easier to implement that is it can be solved using n2 processors. It is used to divided the graph into smaller sub graph which still maintain the structural characteristic. Our future plan includes not only specifying health related data but also health related data along with its locations and severity.
References
[1] Dongkuan Xu1,· Yingjie Tian,2015, A Comprehensive Survey of Clustering Algorithms, Springer Link..
[2] J. T. Velmurugan and T. Santhanam,2011, A survey on partitioned based clustering algorithms in Data mining: An experimental approach, Information technology journal, ISSN 1812-5638.
[3] J. T. Velmurugan and T. Santhanam, 2011, A survey on partitioned based clustering algorithms in Data
mining: An experimental approach, Information technology journal, ISSN 1812-5638.
[4] Sabhia Firdaus, Md. Ashraf Uddin2,2015, A Survey on Clustering Algorithms and Complexity, IJCSI International Journal of Computer Science Issues, Volume 12,
[5] Rui Xu ,2005, Survey of Clustering Algorithms, IEEE Transactions on neural networks, Vol. 16, No 3. [6] Rui Xu, Donald C. Wunsch, 2005,Survey of clustering algorithms, IEEE Transactions on Neural Networks.
[7] Estivill-Castro V, 2002,Why so many clustering algorithms: a position paper. ACMSIGKDD Explore news.
[8] Park H, Jun C, 2009,a simple and fast algorithm for K-medoids clustering. Expert System Applications. [9] Kaufman L, Rousseeuw P, 1990, Partitioning around medoids (program pam). Finding groups in data: an introduction to cluster analysis. Wiley, Hoboken.
[10] Murtagh F, 1983,a survey of recent advances in hierarchical clustering algorithms. Compute J 26:354– 359.
[11] Yang M, 1993,A survey of fuzzy clustering. Math Compute Model 18:1– 16.
[12] Wijaya, Derry T,2008, Graph, Clustering and Applications. Department of Computer Science National University of Singapore, Singapore.
[13] Feldman, Ronen, and James S, 2007, The Text Mining Handbook “Advanced Approaches in Analyzing Unstructured Data”. University Press, Cambridge. [14] A.D. King, 2004, Graph clustering with restricted neighborhood search. Master‟s Thesis, University of Toronto.S
[15] Jun Mu,2008, Hongxiao Fei, Xin Dong School of Information Science and Engineering, Central South University, Changsha 410083.
[16] Richard Merrell and David Diaz,2015, Comparison of Data Mining Methods on Different Applications: Clustering and Classification Methods, Information sciences letters, an international journal.Alexander Pak, Patrick Paroubek, 2010,
[18] Uppada, S. K. (2014). Centroid based clustering
algorithms—A clarion study. Int. Journal of Computer
Science Information Technologiesl, 5, 7309-7313 . [19] Orponen, P., Schaeffer, S. E., & Gaytán, V. Á. (2008). Locally computable approximations for spectral clustering and absorption times of random walks. Discrete Mathematics (cs.DM); Data Structures and Algorithms (cs.DS) arXiv preprint arXiv:0810.4061
[20] Cunha, J., Silva, C. and Antunes, M., 2015. Health twitter big bata management with hadoop framework.
Procedia Computer Science, 64, pp.425-431.
[21] King, D., Ramirez-Cano, D., Greaves, F., Vlaev, I., Beales, S. and Darzi, A., 2013. Twitter and the health reforms in the English National Health Service. Health
policy, 110(2-3), pp.291-297.
[22] Trupthi, M., Pabboju, S. and Narasimha, G., 2017, January. Sentiment analysis on twitter using streaming API. In 2017 IEEE 7th International Advance
Computing Conference (IACC) (pp. 915-919). IEEE.
[23] Pinho-Costa, L., Yakubu, K., Hoedebecke, K., Laranjo, L., Reichel, C.P., Colon-Gonzalez, M.D.C., Neves, A.L. and Errami, H., 2016. Healthcare hashtag index development: Identifying global impact in social media. Journal of biomedical informatics, 63, pp.390-399.
[24] Gagnon, K., 2015. Using twitter in health professional education: A case study. Journal of Allied
Health, 44(1), pp.25-33.
[25]McRae, B.H., Shah, V. and Edelman, A., 2016. Circuitscape: modeling landscape connectivity to promote conservation and human health. The Nature
Conservancy, 14.
[26]Young, L.J., Gotway, C.A., Yang, J., Kearney, G. and DuClos, C., 2009. Linking health and environmental data in geographical analysis: it’s so much more than centroids. Spatial and spatio-temporal epidemiology,
1(1), pp.73-84.
[27]Holt, A.C., Salkeld, D.J., Fritz, C.L., Tucker, J.R. and Gong, P., 2009. Spatial analysis of plague in California: niche modeling predictions of the current distribution and potential response to climate change.
International Journal of Health Geographics, 8(1), p.38.
[28]Su, G., Brøndum, R.F., Ma, P., Guldbrandtsen, B., Aamand, G.P. and Lund, M.S., 2012. Comparison of genomic predictions using medium-density (∼ 54,000) and high-density (∼ 777,000) single nucleotide polymorphism marker panels in Nordic Holstein and Red
Dairy Cattle populations. Journal of Dairy Science,
95(8), pp.4657-4665.
[29]Spiegelhalter, D.J., 1998. Bayesian graphical modelling: a case‐study in monitoring health outcomes.
Journal of the Royal Statistical Society: Series C
(Applied Statistics), 47(1), pp.115-133.
[30]Logesh, R., Subramaniyaswamy, V., & Vijayakumar, V. (2018). A personalised travel recommender system utilising social network profile and accurate GPS data. Electronic Government, an International Journal, 14(1), 90-113.
[31]Subramaniyaswamy, V., Manogaran, G., Logesh, R., Vijayakumar, V., Chilamkurti, N., Malathi, D., & Senthilselvan, N. (2019). An ontology-driven personalized food recommendation in IoT-based healthcare system. The Journal of Supercomputing, 75(6), 3184-3216.
[32]Subramaniyaswamy, V., Logesh, R., Vijayakumar, V., & Indragandhi, V. (2015). Automated message filtering system in online social network. Procedia Computer Science, 50, 466-475.
[33]Subramaniyaswamy, V., Logesh, R., Abejith, M., Umasankar, S., & Umamakeswari, A. (2017). Sentiment analysis of tweets for estimating criticality and security of events. Journal of Organizational and End User Computing (JOEUC), 29(4), 51-71.
[34]Logesh, R., Subramaniyaswamy, V., Malathi, D., Senthilselvan, N., Sasikumar, A., Saravanan, P., & Manikandan, G. (2017). Dynamic particle swarm optimization for personalized recommender system based on electroencephalography feedback. Biomedical Research (0970-938X), 28(13).
[35]Logesh, R., & Subramaniyaswamy, V. (2017). Learning Recency and Inferring Associations in Location Based Social Network for Emotion Induced Point-of-Interest Recommendation. Journal of Information Science & Engineering, 33(6), 1629-1647.