ABSTRACT
In this study, we focused on the amalgamations of local public enterprises and analyzed cost behavior before and after the amalgamations. From the perspective of cost management, it is possible that the amalgamations not only increase the burden of resource adjustment cost, but also make it more inefficient. For this reason, we classified management resources into tangible fixed assets, intangible fixed assets, and human resources to examine how each one affects the cost behavior of local public enterprises. As a result of our analysis, in local public enterprises, sticky costs after the amalgamation are stronger than before. It suggests that the larger management resources that resulted from the amalgamation increased the burden of the resource adjustment cost, which in turn strengthened sticky costs. Next, tangible fixed assets, which is the proxy index of material resources, has the effect of strengthening sticky costs after the amalgamation. Therefore, it is possible that the committed capacity cost increased even further with the amalgamation instead of improving the efficiency of the management. However, with respect to the hypothesis regarding intangible assets, we were unable to obtain significant results. Although various factors can be considered, since the types and nature of intangible fixed assets are diverse, it can be said that future studies such as analysis by each industry and ingenuity of analysis methods are necessary. On the other hand, we thought that human resources would act to strengthen sticky costs after the amalgamation, but this hypothesis was not supported. It is possible that, regarding human resources, the resource adjustment cost even decreases with amalgamations, weakening the influence of the costs.
Keywords: amalgamation, local public enterprises, sticky costs, resource adjustment costs, tangible fixed assets, intangible fixed assets, human
resources
COST BEHAVIOR OF LOCAL PUBLIC ENTERPRISES
Shoichiro Hosomi and Shohei Nagasawa
Graduate School of Management, Tokyo Metropolitan University, Japan E-mail: [email protected], [email protected]
ARTICLE INFO
Article History:
INTRODUCTION
Cost fluctuations are influenced by a variety of factors, such as changes in the external environment, decisions of managers, and so on. For this reason, it is important to understand cost behavior when managing costs. In traditional studies on cost behavior, changes in cost and activity levels were presented in a linear and symmetric fashion. Also, in terms of behavior, costs were normally classified as fixed costs or variable costs.
The cost-related studies of recent years, however, are very different from their traditional counterparts. These new studies look at changes in cost behavior from the perspective of capacity costs, including changes in management resources (Noreen & Soderstrom, 1997). They also confirm that a non-linear relationship appears between costs, which include the
adjustment of management resources, and activity levels (Anderson et al.
2003). In other words, an asymmetric cost behavior appears between an increase and decrease in activity. Anderson et al. (2003) coined the term “Sticky costs” (or “Cost Stickiness”) for the phenomenon in which the cost reduction rate when activity falls is smaller than the cost increase rate when activity rises.
One of the factors that cause sticky costs is the influence of resource adjustment costs (Anderson et al., 2003; Banker et al., 2013). Resource adjustment costs are costs generated when management resources are adjusted to match the activity level. In terms of human resources, for example, when activity increases, the costs of hiring and training new employees are incurred; conversely, dismissing employees involves compensation costs such as retirement allowances.
These studies are mainly focused on the private sector, with very few dedicated to the public sector. One of the two reasons behind this neglect is that government accounting follows a special accounting system (Shust & Weiss, 2014). The other is the argument that the analysis model of cost behavior is not suitable for public organizations. In the private sector, sales or operating revenue are used as proxy indices for activity level, but there are no equivalent measures in the public sector. There is also the claim that taxes that can be compulsorily collected cannot be used to represent activity (Banker et al., 2016). But there are organizations in the public sector that can be analyzed even under these limiting conditions, namely the local public enterprises in Japan.
Local public enterprises are owned by the prefectures and municipalities, but are managed with an independent profit according to the usage fee, which is the price paid for their services. Also, instead of being directly managed by the head of the municipal government, the management of local public enterprises is usually entrusted to administrators for each service, as if they were independent companies. In addition, the accounting processes of local public enterprises are based on the corporate accounting system of the private sector. Based on these characteristics, if cost behavior analysis is performed in local public enterprises, the two aforementioned issues related to the public sector can be overcome.
In Japan, many municipalities have been merged since 1999. The number of municipalities nearly halved between 1999 and 2013, from 3,232 to 1,719. As a consequence of this process, local public enterprises managed by the municipalities were also merged. The objective of this study was to examine the changes in cost behavior before and after the amalgamation. Therefore, we l focused on the amalgamations of local public enterprises that caused large changes in management resources.
This study also analyzed the adjustment cost of management resources as a factor that affects cost behavior in the amalgamation of local public
enterprises.
affect cost management negatively. Conversely, as Jang et al. (2016) pointed out, it is also possible that after an amalgamation, intangible fixed assets improve cost management through synergy.
Another focus of this study was on the relationship between human resources and cost behavior. It has been demonstrated that human resources have the effect of strengthening sticky costs (Anderson et al., 2003; Calleja et al., 2006; Banker et al., 2013). However, we analyzed whether this assertion also applies to local public enterprises.
As shown above, this study has a few unique features. First, it focused on amalgamations to clarify cost behavior in the public sector. Second, it looked at resource adjustment cost as a factor that affects cost behavior. Third, it divided cost management resources into material resources and human resources to examine the influence of resource adjustment. Lastly, it separated fixed assets into tangible and intangible fixed assets to analyze them.
Section 2 shares an outline of cost management of local public enterprises and the amalgamation of local public enterprises. In Section 3, hypotheses will be derived based on a review of prior studies. Section 4 explains the research method and section 5 describes the analysis results. Lastly, Section 6 is a summary and discussion of this study, and shares its limitations and problems, as well as future research tasks.
COST MANAGEMENT OF LOCAL PUBLIC
ENTERPRISES AND MUNICIPAL AMALGAMATION
Cost Management of Local Public Enterprises
The business administration of local public enterprises has two main characteristics. The first is that although local public enterprises are owned by local governments (prefectures and municipalities), they are not directly managed by heads of local governments. Instead, they are usually under the responsibility of business managers for each service. Because of this, the involvement of heads of local governments are only indirect, making these enterprises independent entities. Moreover, public taxes offer only limited support for the services of these local public enterprises, requiring them to be financially independent. Therefore, while local public enterprises are part of the local governments, they are also independent, similar to business entities.
Another characteristic of local public enterprises is that they have a different code of business conduct different from private companies. That is, while private companies seek to maximize profits, the objective of local public enterprises is to promote public welfare and pursue economic rationality. Since local public enterprises provide services of public interest, improving public welfare is one of their goals. This can be considered a common goal for the entire public sector.
Improving economic rationality, which includes economy, efficiency, and effect, is a characteristic of local public enterprises that no other entity in the public sector share. In managing local public enterprises, it is necessary to harmonize these two models (Kawarada, 2005), which creates the need for local public enterprises to pursue a model that actively generates profits. However, it is important to bear in mind that, unlike commercial enterprises, which seek to maximize returns, local public enterprises only aim for a moderate financial gain that keeps them profitable (Eldenburg et al., 2004; Kawarada, 2005; Yasukata et al., 2011).
The next section is an outline of the characteristics of management resources in local public enterprises, which can be separated into material and human resources. The material resources in local public enterprises have high fixed-asset composition and fixed asset-to-equity ratios. On the other hand, fixed assets have a low turnover rate1. One explanation for
ratio is low. In other words, it suggests that material resources account for a large portion of the committed capacity costs. For this reason, it is often difficult to adjust material resources in a quick and flexible way. Meanwhile, in terms of human resources, one notable characteristic of the personnel of local public enterprises is that they have guaranteed employment, similar to local government employees. This means that dismissing employees of local public enterprises is restricted to exceptional circumstances that involve unlawful actions, for instance. Because of this, even in the cases where a layoff is necessary due to unfavorable management conditions, if it goes to trial, there is a high probability that the decision will favor the worker protection laws and the dismissal will be invalidated. As a result, it is difficult to make quick adjustments to human resources as activity fluctuates, and a high resource adjustment cost can be expected.
As shown above, the material and human resources of local public enterprises differ from those of commercial enterprises in certain aspects. It is also true that reducing these management resources is likely to result in higher resource adjustment costs than in commercial enterprises.
The Relationship Between Municipal Amalgamation and Local Public Enterprises
One of the consequence of a drastic change in management resources is amalgamation. When amalgamation occurs, management resources go through a radical reconfiguration. In terms of material resources, for example, facilities and equipment are consolidated; in the case of human resources, the personnel are reorganized. Hence, an amalgamation is likely to bring large changes to management resources. This leads to the conclusion that, to verify how changes in management resources affect cost behavior, it is appropriate to analyze amalgamations. We believe that by examining how cost behavior changed before and after the amalgamation, it is possible to identify the relationship between changes in management resources and cost behavior.
by the federal government and prefectures and were performed on a large scale across the entire country. This process reached its peak between 2004 and 2005, nearly halving the number of municipalities from 3,232 in 1999
to 1,719 in 2013.
The federal government and prefectures endorsed municipal amalgamation as a measure to rebuild municipalities with budget deficits. The same applied to local public enterprises owned by municipalities. The effect of the amalgamation was later studied both by academics and in practice, but these have yet to reach a consensus2.
Moreover, the main interest of academic research was the economic validation of scale based on economics and efficiency verification. However, a confirmation from the perspective of cost management has not yet been carried out. It has been reported that some merged local public enterprises had to take over the assets such as facilities and equipment even if they were deemed unprofitable or inefficient3. Also, the merged local public enterprises
were legally mandated to retain the employees of the merged side. As indicated by these cases, it is speculated that in local public enterprises that were merged, the integration of management resources resulted in even higher resource adjustment costs.
PRIOR STUDIES AND DERIVATION OF RESEARCH
HYPOTHESES
Prior Studies
companies with smaller assets, anti-sticky costs occur. This is attributed to the fact that the cost burden for adjusting the management resources is not as large (Dalla Via & Perego, 2014).
Meanwhile, a study focused on amalgamations points out that when companies with large-scale assets merge, sticky costs are strengthened (Jang et al. 2016). Since an amalgamation is a process in which multiple management resources are integrated, it is difficult to obtain a result that meets the expectations of the managers before the amalgamation (Lubatkin, 1983). Furthermore, even if a financial effect is obtained in the short term, in some cases, it may cause a negative impact in terms of long-term
competitiveness (Hitt et al., 1991).
Most of these prior studies on asymmetric cost behavior are focused on commercial enterprises, with very few cases dedicated to public organizations. However, the existence of an asymmetric cost behavior was confirmed even in these few cases (Yasukata et al., 2011; Cohen et al., 2014; Bradbury & Scott, 2014; Holzhacker et al., 2015). It has also been verified in local public enterprises (Hosomi & Nagasawa, 2018a; Hosomi & Nagasawa, 2018b).
Here is a quick summary of these studies: first, the asymmetry of cost behavior exists in public organizations as well. Second, it is possible that the asymmetric cost behavior is affected by the resource adjustment cost. Third, it has been pointed out that as the scale of management resources increases, the burden of resource adjustment cost also increases. And finally,
since an amalgamation involves an extensive adjustment of management
resources, it is suggested that it may impact cost management negatively. Based on these prior studies, we derived concrete hypotheses for this study as discussed below.
Research Hypotheses
Therefore, the cost behavior in local public enterprises suffered a dramatic change at some point. It is possible that this change in cost behavior in the period around 2000 was affected by Heisei no Dai Gappei (“the Great Amalgamations of the Heisei Era”) that took place in the country.
In the period when municipal amalgamations were implemented, management resources were consolidated. As a result, the burden of resource adjustment costs increased, possibly strengthening sticky costs after the amalgamation (Sepasi & Hassani, 2015; Jang et al., 2016). In other words, it is possible that on the one hand, an amalgamation leads to a significant increase in management resources, but on the other, it makes cost control more difficult. That is, in local public enterprises that are merged, it is likely to be more difficult to make a flexible adjustment to the management resources when activity is reduced. In this case, as shown in prior studies, sticky costs should appear in the cost behavior. Therefore:
H1: In local public enterprises that were merged, sticky costs after amalgamation are stronger than before.
The next step is to examine the relationship between the changes brought about by an amalgamation in management resources and cost behavior. In local public enterprises, making a flexible adjustment to the material resources when activity is reduced is expected to be particularly difficult. In the case of the water supply business, for example, it is not possible to stop the water supply because it is inefficient, as it would disrupt the lives of the residents of that region. If the administrator makes the decision to stop the water supply, it is necessary to allocate sufficient time to explain the situation to the residents and obtain their consent. Then, to stop the inefficient service, it is necessary that the residents of that region move away. Finally, and only then, is it possible to remove the facilities
and equipment.
reduction in activity. When an amalgamation is performed, in particular, it is necessary to make an extensive consolidation of facilities and equipment, which makes the adjustment even more difficult. Even if there are excessive management resources, there is no choice but to absorb these after the amalgamation. It is considered the only alternative to keep providing services of public interest. In this case, the burden of resource adjustment cost that results from the amalgamation is presumably heavy, and if it increases according to the scale of management resources, it impacts even more after the amalgamation. It is possible that, as a result, it becomes a factor that strengthens sticky costs (Dalla Via & Perego, 2014; Sepasi &
Hassani, 2015).
To examine the influence of resource adjustment costs, it is necessary to analyze the material resources in more detail. More specifically, it is preferable that the assets are treated separately, as tangible and intangible fixed assets. Jang et al. (2016) identified that each type of asset has a different effect on cost behavior. That is, as the scale of tangible fixed assets increases, the burden of resource adjustment cost grows proportionally heavier. This makes it impossible to adjust costs flexibly as activity changes, strengthening sticky costs. Conversely, in the case of intangible fixed assets, even if they grow in scale, the resource adjustment cost does not grow in proportion; in some cases, it may even act favorably in terms of cost management through a synergy effect. Hence, in the case of intangible fixed assets, even if the amalgamation causes them to grow in scale, either sticky costs are weakened, or anti-sticky costs appear. Therefore:
H2: In local public enterprises, sticky costs become stronger after amalgamation due to the influence of tangible fixed assets.
H3: In local public enterprises, sticky costs become weaker after amalgamation due to the influence of intangible fixed assets.
the managers’ flexible cost management were identified. The first is the influence of dismissal restriction laws to protect workers (Calleja et al., 2006; Banker et al., 2013). Another is that in cases where it is difficult to re-secure specialists that are let go, managers hesitate to dismiss them even if activity is reduced (Yasukata et al., 2011). The burden of retirement compensation also increases with layoffs. In addition, it is difficult to maintain the morale of the remaining employees (Dierynck et al., 2012). All these factors have the possibility of increasing the resource adjustment cost of human resources.
Merged local public enterprises are also legally obliged to retain the personnel of the merged side. As a result, even if the amalgamation produces an excess of employees, it is difficult for the administrator of local public enterprises to reorganize their personnel. Therefore, adjusting the human resources of local public enterprises is expected to generate a large resource adjustment cost. Therefore:
H4: In local public enterprises, sticky costs become stronger after amalgamation due to the influence of human resources.
RESEARCH METHOD
Sample Selection and Descriptive Statistics
To examine the cost behavior of local public enterprises considering municipal amalgamations, the analysis of this study focused on 1999 onwards, when municipal amalgamations were promoted. Also, the local public enterprise law in Japan was revised in 2014, changing the accounting method. Therefore, to avoid bias due to these changes, the end of the analysis period was set as 2013. As a result, the analysis period was defined as the 15 years between 1999 and 2013.
and loss statement and balance sheet were used4. Also, operating revenue,
operating expenses, tangible and intangible fixed assets, and personnel wages were used as proxy indices for activity amount, cost, fixed assets, and human resources, respectively.
In addition, the data were classified into before- and after-amalgamation sets based on the amalgamation information5 published by the Ministry of
Internal Affairs and Communications. The two categories of data were the fiscal years before the amalgamation and the years since the amalgamation. Also, if the amalgamation occurred in the middle of the fiscal year, that year was considered as data after the amalgamation, so that the influence of the amalgamation could be examined. Moreover, cases in which entities were merged multiple times during the analysis period, were classified based on the fiscal year before and after the first amalgamation.
Since the data would be analyzed with the year-on-year rate, the number of samples was 17,4716, excluding the data for 1999. When 1% of
outliers were removed from the top and bottom of the samples, it resulted in a final number of 17,049. Also, there are two types of amalgamations— equal and absorption-type—but since it does not influence this analysis, such distinction was not considered in the findings.
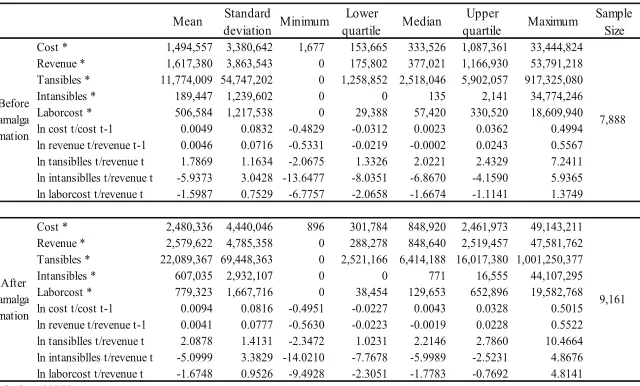
Table 1 shows the descriptive statistics of local public enterprises before and after the amalgamations. The value of each index was higher after the amalgamation, which means that the scale of management resources increased after the amalgamation. Also, a comparison between operating revenue and operating expenses revealed that operating revenue was higher, which indicated that, overall, the enterprises were not in a state of deficit
management.
A Study on the Effect of Amalgamation on Cost Behavior
Table 1: Descriptive statistics
Mean deviationStandard Minimum Lowerquartile Median quartileUpper Maximum SampleSize Cost * 1,494,557 3,380,642 1,677 153,665 333,526 1,087,361 33,444,824 Revenue * 1,617,380 3,863,543 0 175,802 377,021 1,166,930 53,791,218 Tansibles * 11,774,009 54,747,202 0 1,258,852 2,518,046 5,902,057 917,325,080 Intansibles * 189,447 1,239,602 0 0 135 2,141 34,774,246 Laborcost * 506,584 1,217,538 0 29,388 57,420 330,520 18,609,940 ln cost t/cost t-1 0.0049 0.0832 -0.4829 -0.0312 0.0023 0.0362 0.4994 ln revenue t/revenue t-1 0.0046 0.0716 -0.5331 -0.0219 -0.0002 0.0243 0.5567 ln tansiblles t/revenue t 1.7869 1.1634 -2.0675 1.3326 2.0221 2.4329 7.2411 ln intansiblles t/revenue t -5.9373 3.0428 -13.6477 -8.0351 -6.8670 -4.1590 5.9365 ln laborcost t/revenue t -1.5987 0.7529 -6.7757 -2.0658 -1.6674 -1.1141 1.3749
Cost * 2,480,336 4,440,046 896 301,784 848,920 2,461,973 49,143,211 Revenue * 2,579,622 4,785,358 0 288,278 848,640 2,519,457 47,581,762 Tansibles * 22,089,367 69,448,363 0 2,521,166 6,414,188 16,017,380 1,001,250,377 Intansibles * 607,035 2,932,107 0 0 771 16,555 44,107,295 Laborcost * 779,323 1,667,716 0 38,454 129,653 652,896 19,582,768 ln cost t/cost t-1 0.0094 0.0816 -0.4951 -0.0227 0.0043 0.0328 0.5015 ln revenue t/revenue t-1 0.0041 0.0777 -0.5630 -0.0223 -0.0019 0.0228 0.5522 ln tansiblles t/revenue t 2.0878 1.4131 -2.3472 1.0231 2.2146 2.7860 10.4664 ln intansiblles t/revenue t -5.0999 3.3829 -14.0210 -7.7678 -5.9989 -2.5231 4.8676 ln laborcost t/revenue t -1.6748 0.9526 -9.4928 -2.3051 -1.7783 -0.7692 4.8141 * Scale: 1,000 Yen
Before amalga mation 7,888 After amalga mation 9,161 Analysis Method
Anderson et al. (2003) established an analysis model that applies a Cobb-Douglas-type cost function as an empirical research method of cost behavior. It was later adopted by many studies (Banker & Byzalov, 2014), and hypothesis 1 of this study will also be examined with this model.
Model I
of the enterprises were included. Some authors argue that these samples should be excluded from the analysis, but since the removal may lead to survival bias, we decided to include them in this study.
Table 1: Descriptive statistics
Mean Standard
deviationMinimum Lowerquartile Median quartileUpper Maximum SampleSize Cost * 1,494,557 3,380,642 1,677 153,665 333,526 1,087,361 33,444,824 Revenue * 1,617,380 3,863,543 0 175,802 377,021 1,166,930 53,791,218 Tansibles * 11,774,009 54,747,202 0 1,258,852 2,518,046 5,902,057 917,325,080 Intansibles * 189,447 1,239,602 0 0 135 2,141 34,774,246 Laborcost * 506,584 1,217,538 0 29,388 57,420 330,520 18,609,940 ln cost t/cost t-1 0.0049 0.0832 -0.4829 -0.0312 0.0023 0.0362 0.4994 ln revenue t/revenue t-1 0.0046 0.0716 -0.5331 -0.0219 -0.0002 0.0243 0.5567 ln tansiblles t/revenue t 1.7869 1.1634 -2.0675 1.3326 2.0221 2.4329 7.2411 ln intansiblles t/revenue t -5.9373 3.0428 -13.6477 -8.0351 -6.8670 -4.1590 5.9365 ln laborcost t/revenue t -1.5987 0.7529 -6.7757 -2.0658 -1.6674 -1.1141 1.3749
Cost * 2,480,336 4,440,046 896 301,784 848,920 2,461,973 49,143,211 Revenue * 2,579,622 4,785,358 0 288,278 848,640 2,519,457 47,581,762 Tansibles * 22,089,367 69,448,363 0 2,521,166 6,414,188 16,017,380 1,001,250,377 Intansibles * 607,035 2,932,107 0 0 771 16,555 44,107,295 Laborcost * 779,323 1,667,716 0 38,454 129,653 652,896 19,582,768 ln cost t/cost t-1 0.0094 0.0816 -0.4951 -0.0227 0.0043 0.0328 0.5015 ln revenue t/revenue t-1 0.0041 0.0777 -0.5630 -0.0223 -0.0019 0.0228 0.5522 ln tansiblles t/revenue t 2.0878 1.4131 -2.3472 1.0231 2.2146 2.7860 10.4664 ln intansiblles t/revenue t -5.0999 3.3829 -14.0210 -7.7678 -5.9989 -2.5231 4.8676 ln laborcost t/revenue t -1.6748 0.9526 -9.4928 -2.3051 -1.7783 -0.7692 4.8141 * Scale: 1,000 Yen
Before amalga mation 7,888 After amalga mation 9,161 Analysis Method
Anderson et al. (2003) established an analysis model that applies a Cobb-Douglas-type cost function as an empirical research method of cost behavior. It was later adopted by many studies (Banker & Byzalov, 2014), and hypothesis 1 of this study will also be examined with this model. Model I �� � ������� ���������� � 𝛽𝛽�+ 𝛽𝛽�∗ �� � ���������� ������������� + 𝛽𝛽�∗ 𝐷𝐷𝐷𝐷𝐷𝐷𝐷𝐷𝐷𝐷𝐷𝐷𝐷𝐷𝐷𝐷𝐷𝐷𝐷𝐷𝐷𝐷𝐷𝐷𝐷𝐷𝐷���∗ �� ����������������������� � + ���� (1) (1)
In this equation, Cost represents the operating expenses and Revenue
Asia-Pacific Management Accounting Journal, Volume 13 Issue 3
Likewise, to examine hypotheses 2 to 4, tangible and intangible fixed assets and personnel wages were used as proxy variables for material resources and human resources, respectively. The influence of the respective management resources on cost behavior were then be verified using the model below.
Model II
In this equation, Cost represents the operating expenses and Revenue represents the operating revenue. Decrease_Dummy is a dummy variable that takes 1 if the operating revenue was lower than the preceding fiscal year, and 0 otherwise. ln represents a natural logarithm. If sticky costs are strengthened after the amalgamation, β1>β1+β2 should hold true.
Likewise, to examine hypotheses 2 to 4, tangible and intangible fixed assets and personnel wages were used as proxy variables for material resources and human resources, respectively. The influence of the respective management resources on cost behavior were then be verified using the model below.
Model II
ln �𝐶𝐶𝐶𝐶𝐶𝐶𝐶𝐶𝐶𝐶𝐶𝐶𝐶𝐶𝐶𝐶���
������ = 𝛽𝛽�+ 𝛽𝛽�∗ ln �
𝑅𝑅𝑅𝑅𝑅𝑅𝑅𝑅𝑅𝑅𝑅𝑅𝑅𝑅���
𝑅𝑅𝑅𝑅𝑅𝑅𝑅𝑅𝑅𝑅𝑅𝑅𝑅𝑅������ + 𝛽𝛽�∗ 𝐷𝐷𝑅𝑅𝐷𝐷𝐷𝐷𝑅𝑅𝐷𝐷𝐶𝐶𝑅𝑅𝐷𝐷𝐷𝑅𝑅𝐷𝐷𝐷𝐷𝐷𝐷���
∗ ln �𝑅𝑅𝑅𝑅𝑅𝑅𝑅𝑅𝑅𝑅𝑅𝑅𝑅𝑅𝑅𝑅𝑅𝑅𝑅𝑅𝑅𝑅𝑅𝑅𝑅𝑅𝑅𝑅���
������ + � 𝛽𝛽� � ��� 𝐶𝐶𝐶𝐶𝑅𝑅𝐶𝐶𝐷𝐷𝐶𝐶𝐶𝐶𝐶𝐶����� + � 𝛽𝛽� � ��� 𝐶𝐶𝐶𝐶𝑅𝑅𝐶𝐶𝐷𝐷𝐶𝐶𝐶𝐶𝐶𝐶�����∗ 𝐷𝐷𝑅𝑅𝐷𝐷𝐷𝐷𝑅𝑅𝐷𝐷𝐶𝐶𝑅𝑅𝐷𝐷𝐷𝑅𝑅𝐷𝐷𝐷𝐷𝐷𝐷���
∗ ln �𝑅𝑅𝑅𝑅𝑅𝑅𝑅𝑅𝑅𝑅𝑅𝑅𝑅𝑅𝑅𝑅𝑅𝑅𝑅𝑅𝑅𝑅𝑅𝑅𝑅𝑅𝑅𝑅��� ������ + 𝜀𝜀���
(2)
In this equation, Controls represents the natural logarithm of tangible fixed assets, intangible fixed assets, and personnel wages divided by operating revenue. The other variables are the same as in model I.
ANALYSIS RESULT
In panel data analysis, three models were used for verification: the pooled model, the fixed effect model, and the variable effect model. Then, we conducted the F test and the Hausman test to confirm the result of the most effective model. The results of this analysis using models I and II are shown
(2)
In this equation, Controls represents the natural logarithm of tangible fixed assets, intangible fixed assets, and personnel wages divided by operating revenue. The other variables are the same as in model I.
ANALYSIS RESULT
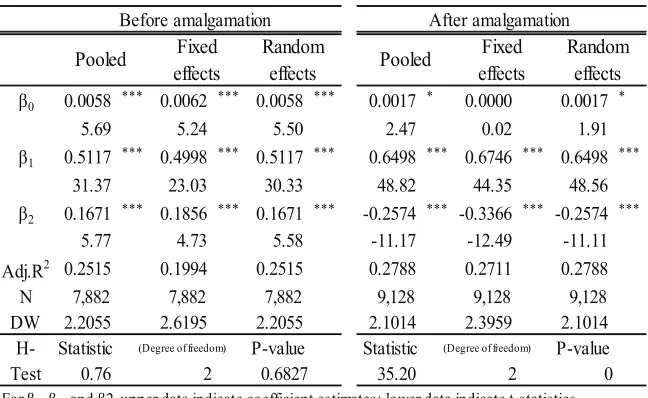
In panel data analysis, three models were used for verification: the pooled model, the fixed effect model, and the variable effect model. Then, we conducted the F test and the Hausman test to confirm the result of the most effective model. The results of this analysis using models I and II are shown in Tables 2 and 3, respectively.
sticky costs. These analysis results confirm that the cost adjustment capacity decreased after the amalgamation, which supported hypothesis 1.
Table 2: Analysis Result of Hypothesis 1
β0 0.0058 *** 0.0062 *** 0.0058 *** 0.0017 * 0.0000 0.0017 *
5.69 5.24 5.50 2.47 0.02 1.91
β1 0.5117 *** 0.4998 *** 0.5117 *** 0.6498 *** 0.6746 *** 0.6498 ***
31.37 23.03 30.33 48.82 44.35 48.56
β2 0.1671 *** 0.1856 *** 0.1671 *** -0.2574 *** -0.3366 *** -0.2574 ***
5.77 4.73 5.58 -11.17 -12.49 -11.11
Adj.R2 0.2515 0.1994 0.2515 0.2788 0.2711 0.2788
N 7,882 7,882 7,882 9,128 9,128 9,128
DW 2.2055 2.6195 2.2055 2.1014 2.3959 2.1014
Statistic (Degree of freedom) P-value Statistic (Degree of freedom) P-value
0.76 2 0.6827 35.20 2 0
For β0, β1, and β2, upper data indicate coefficient estimates; lower data indicate t-statistics,
*significant at the 10% level, **significant at the 5% level, ***significant at the 1% level,
Adj.R2=Adjusted R2, N=Number of Observations, DW=Durbin-Watson ratio, H-Test=HausmanTest
H-Test
Before amalgamation After amalgamation
Pooled effectsFixed Randomeffects Pooled effectsFixed Randomeffects
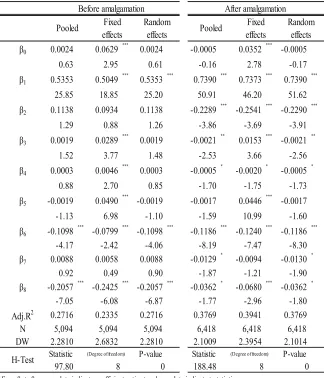
The next step was to verify the influence of material and human resources on cost behavior using model II. We performed panel data analysis on the samples before and after the amalgamation, and this analysis showed that the fixed effect model was supported both before and after the
amalgamation.
Regarding hypothesis 2, the influence of tangible fixed assets (one of the two types of fixed assets) was verified in terms of β6. The negative value of -0.799 before the amalgamation increased to -0.1240 afterwards. This result reveals that the influence of tangible fixed assets on sticky costs strengthened after the amalgamation, which supported hypothesis 2.
As for hypothesis 3, the influence of intangible fixed assets is indicated by β7, but no significant value was obtained before or after the amalgamation. Therefore, hypothesis 3 was not supported by any of the
Lastly, regarding hypothesis 4, the influence of human resources was verified in terms of β8. The negative value of -0.2425 before the amalgamation decreased to -0.0680 afterwards, which confirmed that the influence of personnel wages on sticky costs weakened after the amalgamation. Therefore, hypothesis 4 was not supported.
Table 3: Analysis Result of Hypotheses 2 to 4
β0 0.0024 0.0629 ***
0.0024 -0.0005 0.0352 ***
-0.0005
0.63 2.95 0.61 -0.16 2.78 -0.17
β1 0.5353 0.5049 ***
0.5353 ***
0.7390 ***
0.7373 ***
0.7390 ***
25.85 18.85 25.20 50.91 46.20 51.62
β2 0.1138 0.0934 0.1138 -0.2289 ***
-0.2541 ***
-0.2290 ***
1.29 0.88 1.26 -3.86 -3.69 -3.91
β3 0.0019 0.0289 ***
0.0019 -0.0021 **
0.0153 ***
-0.0021 **
1.52 3.77 1.48 -2.53 3.66 -2.56
β4 0.0003 0.0046 ***
0.0003 -0.0005 *
-0.0020 *
-0.0005 *
0.88 2.70 0.85 -1.70 -1.75 -1.73
β5 -0.0019 0.0490 ***
-0.0019 -0.0017 0.0446 ***
-0.0017
-1.13 6.98 -1.10 -1.59 10.99 -1.60
β6 -0.1098 ***
-0.0799 ***
-0.1098 ***
-0.1186 ***
-0.1240 ***
-0.1186 ***
-4.17 -2.42 -4.06 -8.19 -7.47 -8.30
β7 0.0088 0.0058 0.0088 -0.0129 *
-0.0094 -0.0130 *
0.92 0.49 0.90 -1.87 -1.21 -1.90
β8 -0.2057 *** -0.2425 *** -0.2057 *** -0.0362 * -0.0680 *** -0.0362 *
-7.05 -6.08 -6.87 -1.77 -2.96 -1.80
Adj.R2 0.2716 0.2335 0.2716 0.3769 0.3941 0.3769
N 5,094 5,094 5,094 6,418 6,418 6,418
DW 2.2810 2.6832 2.2810 2.1009 2.3954 2.1014
Statistic (Degree of freedom) P-value Statistic (Degree of freedom) P-value
97.80 8 0 188.48 8 0
From β0 toβ8, upper data indicate coefficient estimates; lower data indicate t-statistics,
*significant at the 10% level, **significant at the 5% level, ***significant at the 1% level, Adj.R2=Adjusted R2, N=Number of Observations, DW=Durbin-Watson ratio, H-Test=HausmanTest
H-Test
Before amalgamation After amalgamation
CONCLUSION
In this study, we focused on the amalgamations of local public enterprises and analyzed the cost behavior before and after the amalgamations.
From the perspective of cost management, it is possible that the amalgamations not only increase the burden of resource adjustment cost, but also make it more inefficient. For this reason, we classified management resources into tangible fixed assets, intangible fixed assets, and human resources to examine how each one affects the cost behavior of local public
enterprises.
Following below is a summary and discussion of this study along with the limitations and problems, as well as future research tasks.
First of all, the verification of hypothesis 1 identified that in local public enterprises, sticky costs after the amalgamation are stronger than before. It suggests that the larger management resources that resulted from the amalgamation increased the burden of the resource adjustment cost, which in turn strengthened sticky costs.
Next, the verification of hypothesis 2 indicated that tangible fixed assets, which is the proxy index of material resources, has the effect of strengthening sticky costs after the amalgamation, which supports hypothesis 2. In other words, with the amalgamation, the resource adjustment cost that arises from tangible fixed assets increased, which means that the administrators lost the capacity to adjust costs. One possible reason for this is that when the amalgamations were performed, the stance of improving cost management was not fully taken into account, resulting in the facilities and equipment being maintained even after the amalgamation. Therefore, it is possible that the committed capacity cost increased even further with the amalgamation instead of improving the efficiency of the management.
are equally diverse. This suggests that it may be a valid approach to make an individual verification for each type of industry in future studies. Another possibility is to modify the analysis method to test of structural change or method of instrumental variables. This indicates that intangible fixed assets need to be examined further in the future.
When an amalgamation takes place, the local public enterprises of the amalgamation side are legally mandated to retain the personnel of the merged side. For this reason, we thought that human resources would have the effect of strengthening sticky costs after the amalgamation, but hypothesis 4 was not supported. This can be explained by the fact that in local public enterprises that were merged, when permanent employees retire, non-permanent employees are hired over new permanent employees. It is speculated that this kind of cost management is practiced as an attempt to change labor costs from fixed costs to variable costs7. As a result, it is
possible that, regarding human resources, the resource adjustment cost even decreases with amalgamations, weakening the influence of the sticky costs.
With increasingly harsher financial conditions, cost management is expected to gain even more importance in public organizations in the coming years, including local public enterprises. In this study, to examine the influence of the resource adjustment cost, we focused on the amalgamations, which cause significant changes in management resources. We also determined whether there were effects caused by the amalgamations from the perspective of cost management.
In Japan, there is an on-going policy debate about widening services of public interest even further. We believe that this study, which reinterprets the verification of amalgamations of local public enterprises from a cost management perspective, will play an important role in future policy debates concerning public organizations.
Also, this study did not consider the types of amalgamations such as incorporation and consolidation, the number of amalgamations performed, or the scale of the municipalities. These can also be considered as a limitation or problem of this study.
We believe that a valid task for future research is to verify the cost behavior of local public enterprises that were not merged and make a comparative analysis with those that were merged. In addition, since the influence on cost behavior is likely to vary according to different business environments, we believe it is also valid to verify how the cost behavior changes with amalgamations in each type of industry.
NOTE
1 According to the “Local public enterprise yearbook No. 61” (Local Public Finance Bureau, Ministry of Internal Affairs and Communications, Japan), the fixed asset component ratio is 91.6%, the fixed ratio is 146.7%, and the fixed asset turnover ratio is 0.11%.
2 The researches that verified the effect of the municipal amalgamation s are in research fields such as public economics and finance. However, their opinions are divided into three categories, such as the existence of meregers’positive effects (Sato 2002), no effects (Goishi 2012), and the limited effects (Hayashi 2002; Hayashi 2013). Therefore the academic views have not been unified yet. 3 According to “Guide to water supply business integration accompanying municipal amalgamation”
(Japan Water Works Association, January, 2004), Examples that the merging local public enterprises take over facilities and equipment are seen.
4 The balance sheets of the industrial water supply business and hospitals businesses are consolidated by each municipalities. Conversely, the income statement are unconsolidated. Therefore, we sum up the data of the income statement into each municipality business.
5 The data of amalgamations are based on the information on the website of the Ministry of Internal Affairs and Communications, Japan. (http://www.soumu.go.jp/gapei/gapei.html)
6 The reason why the number of samples after the amalgamation exceeds is derived from each analysis period. The amalgamations took place mainly from 2004 to 2005, though the analysis periods are from 1999 to 2013. Therefore, the average composition of the sample data is 6 fiscal years before the merging (2004) and 9 fiscal years after the merging (2005).
REFERENCES
Anderson, M. C., Banker, R. D. & Janakiraman, S. N. (2003). Are selling, general, and administrative costs “sticky”? Journal of Accounting Research, 41, 47-63.
Banker, R. D. & Byzalov, D. (2014). Asymmetric cost behavior. Journal of Management Accounting Research, 26(2), 43-79.
Banker, R. D., Byzalov, D. & Chen, L. T. (2013). Employment protection legislation, adjustment costs and cross-country differences in cost behavior. Journal of Accounting and Economics, 55(1), 111-127.
Banker, R. D., Byzalov, D., Fang, S. & Liang, Y. (2016). Cost Behavior Research. Social Science Research Network.
Bradbury, M. & Scott, T. (2014). Do Managers Understand Asymmetric Cost Behavior. Working paper, Massey University.
Calleja, K., Steliaros, M. & Thomas, D. C. (2006). A note on cost stickiness:
Some international comparisons. Management Accounting Research
17(2), 127-140.
Cohen, S., Karatzimas, S. & Naoum, V. C. (2014). The sticky cost phenomenon at the local government level: Empirical evidence from
Greece. Journal of Applied Accounting Research, 18(4), 445-463.
Dalla Via, N. & Perego, P. M. (2014). Sticky cost behavior: Evidence from small and medium sized companies. Accounting and Finance 54(3),
753-778.
Dierynck, B., Landsman, W. R. & Renders, A. (2012). Do managerial incentives drive cost behavior? Evidence about the role of the zero earnings benchmark for labor cost behavior in private Belgian firms.
The Accounting Review 87(4), 1219-1246.
Goishi, N. (2012). Scale economy analysis of the local government
amalgamations in Heisei period. Research Journal for Creative Cities
8(1), 31-45.
Günther, T. W., Riehl, A. & Rößler, R. (2014). Cost stickiness state of the art of research and implications. Journal of Management Control 24(4),
301-318.
Hayashi, M. (2002). Returns to scale, congestion and the minimal efficient scales of the local public services in Japan. Financial Review, 61,59-89.
Hayashi, R. (2013). Municipal amalgamations and its impact on local public
expenditures. Kaikei-kensa Kenkyu, 47, 27-38.
Hitt, M., Hoskisson, R. E., Ireland, D. & Harrison, J. S. (1991). Effects of acquisitions on R&D inputs and outputs. Academy of Management Journal, 34(3), 693-707.
Holzhacker, M., Krishnan, R. & Mahlendorf, M. D. (2015). The impact of changes in regulation on cost behavior. Contemporary Accounting Research, 32(2), 534-566.
Jang, Y., Yehuda, N. & Radhakrishnan, S. (2016). Asymmetric Cost Behavior and Value Creation in M&A Deals. Social Science Research Network.
Kawarada, T. (2005). Local public enterprises accounts theory. Seibunsha.
Lubatkin, M. (1983). Mergers and the performance of the acquiring firm.
Academy of Management Journal, 8(2), 218-225.
Oshima, K. (1968). Basic problems of local public enterprises. The Accounting, 93(3), 88-102.
Sato, T. (2002). Empirical analysis of the effects of municipal mergers on local government finances. Studies of regional policy, 6.
Shust, E. & Weiss, D. (2014). Asymmetric cost behavior-sticky costs expenses versus cash flows. Journal of Management Accounting Research, 26(2), 81-90.
Weiss, D. (2010). Cost behavior and analysts’ earnings forecasts. The Accounting Review, 85(4), 1441-1474.