Volume 18, 2009 102
Examining ThE STrucTurES
Of STudEnTS’ cOncEpTS uSing
rEpErTOry grid analySiS
Thomas J. J. McCloughlin
St. patrick’s college, (a college of dublin city university), ireland E-mail: [email protected]
Philip S. C. Matthews
Trinity college, dublin university, ireland E-mail: [email protected]
Abstract
This work attempts to explore the methodological legacy of George Kelly – repertory grid analysis – as an aid to visually mapping the structures of students’ concepts. Although, Kelly formulated a complex Euclidian framework of psychological laws, axioms, and corollaries, we have concentrated on the methods that later workers took from Kelly’s original ‘RepGrid Test’. The central entity is a self-constructed concept, or set thereof, that may be represented in a matrix. As a matrix of integers can be manipulated by a large variety of statistical protocols, we explore in three studies how such matrices may be derived in relation to students` concepts of living kinds, and then how they may be analysed. Typcially, we use principal components analysis – a model-free form of factor analysis. The resultant loadings derived from these analyses are plotted on Cartesian planes from which additional information about the structure of the students’ conceptualizations may be derived.
Key words: repertory grid analysis, thoughts, structures.
Introduction
George Kelly (28th april, 1905 – 6th march, 1967). was responsible for two movements in clinical psychology that later found application in educational psychology: 1. the psychology of personal constructs (Kelly, 1992), 2. the repgrid test (Kelly, 1992; shaw, 1980; shaw & Gaines, 1995; slater, 1977; sutton, 1980) that forms part of a set of techniques known as repertory grid analysis. in this paper, we illustrate the application of both the theoretical and practical application of Kelly’s work to science education. previous research such as sutton (1980) recommended repertory grid analysis as a technique to probe learners’ prior knowledge. (fetherstonhaugh, 1994) used repertory grids to probe students’ ideas about energy, and (bezzi, 1996) used repertory grid analysis to study the concept construction (learning) in geology. here, we examine the structure of post-primary students’ concepts concerning living things.
The Origins of Kelly’s Theory
103 Volume 18, 2009 or clients (Boeree, 2006). While they saw themselves as engaged in the fine arts of reason and
empiricism, they tended to view ordinary people as the victims of their sexual energies or con-ditioning histories. but from his experience with Kansas’ students and farm people, Kelly noted that these ordinary people were trying to understand what was going on in their own lives. What mattered to these people was that they had an explanation of the difficulties they experienced, and that they had a way of understanding them.
Man as Scientist
The way in which his patients were trying to find ways of understanding themselves, and their perceptions of the world, struck Kelly as scientific. To consider the ‘common man’ as a scientist was something of a leap in Kelly’s day and his preference to visualise a human being as a scientist is a departure from his colleagues’ perception of human beings. Kelly describes his colleagues’ view of a person as an organism driven in „gluttonous pursuit of sustenance and shelter“, whereas the scientist’s ultimate aim is to predict and to control. What if the ordinary human being living out his or her life behaves like a scientist having theories, testing hypotheses, weighing experimental evidence? according to Kelly, people, i.e. ordinary people, are scientists too. they have constructions of their reality, like scientists have theories. they have anticipations or expectations, like scientists have hypotheses. they engage in behaviours that test those expectations, as scientists do experiments. they improve their understandings of reality on the basis of their experiences, like scientists adjust their theories to accommodate the facts. from this metaphor that he describes as his ‘fruitful metaphor’ comes Kelly’s entire theory.
others have sought to include the learner under the category of scientist e.g. „the pupil as scientist” by rosalind driver (driver, 1983) and „the child as scientist” by Jean piaget (oxford, 1997). however, there is some doubt as to whether a child really could be described as a scientist in the full sense of the word rather than performing behaviours similar to scientists and developing naive theories. Children do not use fully constructed scientific theories sanctioned by the community of practicing professional scientists.
developments in constructivism applied to science education have made use of Kelly’s theory of constructive alternativism. constructive alternativism is the idea that, while there is only one consistent objective reality, reality is always experienced from different perspectives, or alternative constructions. every human has a construction of what the world is like and some constructions are better than others. a teacher’s constructions may be better than that of her/his pupils. yet no-one’s construction is ever complete, because the world is too complicated, too big, for any one person to have the ‘perfect’ perspective. No-one’s perspective is ever to be completely ignored. each perspective is a perspective on ultimate reality, and has some value to that person in that time and place. In fact, Kelly says, there are an infinite number of alternative constructions a person may take towards the world, and if one is not doing a very good job, we can adopt another.
The Importance of Prior Knowledge
Kelly (in the posthumous reprint of his classic work of 1955) states categorically that „all thinking is based in part on prior convictions“ (Kelly, 1992, p. 5). this serves as a starting point for constructivist thinking in science education practice. current perspectives in cognition and learning in general describe the learner as actively and continually constructing internal models of the world which are used in making sense of personal experience (brook, driver, & Johnston, 1989, p. 63). even before entering formal science education, children have been constructing their own ideas of how they think the world works, and they may have constructed models that provide an alternative explanation to that given in formal science (driver, Guesne, & tiberghien, 1985). When brook et al. (1989) and driver et al. (driver, Guesne, & tiberghien, 1985) speak of making
Volume 18, 2009
104 sense of experience, they are speaking about experience of the physical world, whereas Kelly was primarily concerned with self-perception and social experience (Kelly, 1992). however, although such mental domains may be treated differently in neuronal processing, there are commonalities across these domains, such as:
• experience can be represented,
• prior experience always has some role to play, • experience is processed in part through classification.
The Role of Sensing and Responding
living things are often described as „sensitive and responsive” — one of the so-called seven characteristics of life taught in post-primary biology. Kelly viewed our psychological faculties as a system of sensing and responding to our environment, constructs being the out-comes of these processes. however, he goes further by stressing the creative capacity of the living thing to represent the environment rather than merely responding to it. because we can represent the environment we place alternative constructions upon it (Kelly, 1992, p. 6) and if we are not satisfied with them we can do something about the situation. A person can delude themselves in what (s) he may perceive as existing; however, the perception does exist. there is a distinction be-tween what is conceived and perceived: the concept and percept respectively (Kelly, 1992, p. 30). Humans interpret the world through the use of mental filters or templates, which they consciously or unconsciously create in an attempt to accommodate their perceptions of the world. as such, Kelly’s theory appears to mirror david marr’s thesis of how the human visual system interprets images by a system of template fitting (Marr, 1982). The fitting of the most appropriate template registers ‘recognition’. Without the ability to recognise patterns and thereby classify it would be impossible to make any sense of experience. Indeed, a poor fit to a classificatory scheme is often more helpful than no fit at all.
Constructs and Elements
Kelly gave the name constructs to those patterns that are tentatively used as ways of construing the world and which enables humanity and other animals to chart a course of behaviour. in general humans seek to improve their understanding of the world by increasing their repertory or repertoire of constructs; by altering them to provide better fits and by subsuming them with superordinate constructs or systems (Kelly, 1992, p. 7). the more constructs held, the more accurate and fine-tuned the recognition of features concerning the world becomes.
a construct is a representation of some aspect of the environment, a representation manufactured by a living creature and then tested against experience. We experience the environment as a course of events, in which entities are encountered and our expectations are challenged: the testing of a construct is a testing against the re-occurrence of such events, the entities encountered during those events and the way in which experience is confronted. a construct which is more viable than others has a higher predictive efficiency (Kelly, 1992, p. 9). But there are times when a person hesitates to act because (s) he dreads the outcome, with the fear that the conclusion of the act would place him/her in ambiguous position when (s) he would no longer be able to predict and control. Kelly, somewhat flippantly, suggested that this fear was caused by a person being in a situation where ‘he does not want to be caught with his constructs down’.
105 Volume 18, 2009
The Geometry of Psychological Space
George Kelly’s background in mathematics, coupled with a particular interest in multi-dimensional geometry and experience in navigation, lead him to formulate his theory in terms of euclid’s elements. Kelly summarised his theory in a euclidian paradigm with a fundamental postulate and eleven corollaries, terming the primitives involved elements and constructs. thus he presented his theory as a geometry of psychological space (Kelly, 1969). The Fundamental postulate is that a person’s processes are psychologically channelized by the ways in which he anticipates events (Kelly, 1992, p. 46). subject to this postulate are the eleven corollaries. the construction corollary (Kelly, 1992, p. 50) states that a person anticipates events by construing their replications. however, constructions and their replications can change over time, as expressed by the experience corollary: a person’s construct system varies as (s) he successively construes the replications of events. recognising biological natural kinds concepts involves anticipation to the extent that, for example, if a person is confronted by an animal the person anticipates the behaviour, risk and consequences of engaging with the animal. however, the processes of recognition and anticipation differ from person to person. the individuality corollary states that persons differ from each other in their constructions of events. however, there are similarities to other peoples’ constructions; hence the commonality corollary: to the extent that one person employs a construction of experience which is similar to that employed by another her/his psychological processes are similar to those of the other person.
the taxonomic, abstraction, or subsumption, hierarchy between concepts is the subject of Kelly’s organisation corollary (Kelly, 1992): each person characteristically evolves, for his convenience in anticipating events, a construction system embracing ordinal relationships between constructs. constructs are constrained by a number of factors which may be global in that most people have them and individual, consistent with the individuality corollary, in that they are specific to one person; hence the modulation corollary: the variation in a person’s construction system is limited by the permeability of the constructs within whose range of convenience the variants lie. figure 1 shows the main features of Kelly’s idea of psychological space. a construct is represented on a reference axis, the limits of which defines the dichotomous poles of the construct: each construct involves two poles, one at each end of its dichotomy. even though Kelly’s geometry is not metrically defined, he used the defined constructs to generate a metric (Shaw & Gaines, 1995).
Figure . The structure of Kelly’s psychological space.
Volume 18, 2009
106 for example, the following construct can be envisaged with two poles and the symbol | denoting the dichotomy between the poles:
Horse ----|--- Not Horse
(i.e., that which is horse-like) (i.e., that which is not horse-like)
On the axis, a scale which is usually a ranking scale, can be placed:
Horse 1-2-3-|-4-5-6 Not Horse
it is the researcher’s choice, or that of her/his subjects, to decide the number of ways the axis will be split; but, as in the diagram, common practice is to use six points. only one rank is allotted per orthogonal plane, and each rank is used as a marker for a specific element. For example, in relation to ‘horse’ one element might be labelled general horse shape. however, a key point is that the rank given to a particular element is decided by the subject (not by the researcher) as displayed below. the rank that a subject allocates to an element is a measure of the relevance of that feature to the subject’s construct, in this case of horse:
Horse 1----|--- Not Horse
the example above is, in effect, a propositional statement or statement of intensional logic: general horse shape is the element that, for this person, best characterises the construct horse. an iterative succession of similar propositional statements concerning a number of elements will generate a table of ranks until ultimately a matrix or grid is formed.
Methodology of Research
Grids
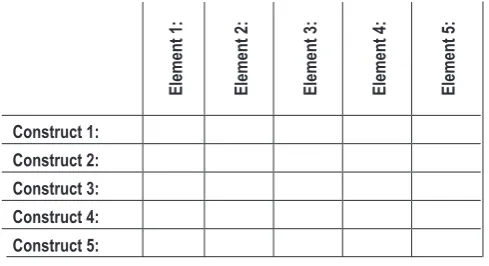
the term grid is used in a number of ways in different contexts. it can be used as a generic term for a number of rating-scale protocols (Jankowicz, 2004) or as a way of bringing mathematics into psychological theory – a means of expressing Kelly’s theory of personal constructs in action (fransella, bell, & bannister, 2004). physically, it represents a table of numbers characterised by columns and rows. the numbers may represent ratings, ranks or scores of relevance. in table 1 the elements are titular to the columns and the constructs are titular to the rows, though this is not an absolute rule – the opposite may be done. in this example each element is ranked once against each construct; thus, in each column only one 1, 2, 3, 4 and 5 appears. for each construct, the elements can occupy the same rank; thus for Construct 1, Element 2 and Element 3 both occupy the rank of 4 and it happens that for this construct none of the elements gain a rank of 5. some protocols insist on one rank per cell in a row or column or both; furthermore some protocols allow some cells to remain unranked, however this latter case may have implications for computer software dealing with the table as a matrix. a repertory grid can be thought to be simply a set of ratings, but only as an expedient mental device. a grid is a representation of the relationships between elements and constructs. Whereas concept maps tend to represent relationships of the ‘IS A’ type, repertory grids represent relationships that define the degree of ‘IS A’, thus, an example from table 1 could be: Element 2 or Element 4 is most important in characterising Construct 2. We can say this because on the second row, the ranks given under element 2 and element 4 are both ‘1’, i.e., the highest rank.
107 Volume 18, 2009 Table . An example of a completed grid.
Element 1 Element 2 Element 3 Element 4 Element 5
Construct 1 3 4 4 2 1
Construct 2 2 1 2 1 3
Construct 3 5 2 1 5 5
Construct 4 1 3 3 3 2
Construct 5 4 5 5 4 4
In addition, because the rating system defines a rank order, then there is an implied judgement of the other elements. To state that one thing is ‘most important’ is an evaluation that the other things are not so.
Kelly’s Repertory Grid Method
In this section, a simplified manual method for deriving a completed repertory grid (or „repGrid” as they are commonly called) is outlined as a stepwise protocol (after anon., 2006).
step 1. the individual or group begins with an empty repertory grid (figure 2), pen or pencil, and between five to eight blank index cards.
Element 1: Element 2: Element 3: Element 4: Element 5:
Construct 1: Construct 2: Construct 3: Construct 4: Construct 5:
Figure 2. An empty grid.
step 2. then the elements are written across the top of the grid.
step 3. after this, the subjects write numbers on one side of the cards, which correspond with the elements at the top of the grid.
Step 4. The cards are turned face down, shuffled, and then three cards are drawn at random.
step 5. the subject(s) mark on the grid which three elements were drawn with an „X“. they then decide: „Out of the three elements chosen, which two seem to have something more in common with each other?“ these two elements are connected with a line.
Volume 18, 2009
108 step 7. finally, the elements are rated to the constructs. each element is rated to the constructs on a scale of one to five, for example, with the left construct as „1“ and the right construct as „5“.
Once the first row has been rated, the individual or group turn the three cards over, shuffle them, and begin the process all over again. They may reshuffle in the case of drawing the same three-card combination as before.
the outcome of this procedure is a table of integers called a matrix or grid as discussed before.
Slater’s Repertory Grid Method
fransella et al., (2004, p. 93) relate how patrick slater published a monograph entitled: „the principal components of a repertory grid” (slater, 1964) based on matrix algebra and co-ordinate geometry. They believe that the title is misleading since ‘principal components’ is a generic term and that what is actually done is ‘Singular Value Decomposition’ (also known as eckart-young decomposition) which is a form of principal components analysis of correlation matrices. However, the importance of Slater’s work was that he was the first to see that this mathematical procedure could be applied to Kelly’s repGrid data, and his method of analysis became the ‘gold standard’ of research and practice using repertory grids (Fransella, Bell, & bannister, 2004, p. 94). further, a two-dimensional spatial representation of the constructs and elements became, and remains, the accepted way of viewing the grid. the graphics produced are technically known as Representations of Singular-Value Decompositions.
Study 1. Distinguishing a non-equine from equines
this study serves to illustrate the repGrid method using a small group of students (n = 11, average age = 16.5 years) as subjects. Six constructs were chosen: a group of five closely related mammals, and one that was a mammal distantly related to the set of five. The five closely related mammals were: horse, zebra, pony, mule, and donkey; horse, zebra and donkey are species of equids; pony is a varietal of horse and mule is a hybrid of horse and donkey. the sixth, goat, was the distantly related mammal. each student was seated in front of a computer and the circumgrids iii (chambers & Grice, 1986) program started. the options for six elements and six constructs were chosen and the names of the constructs and elements entered. then the student was asked a series of questions whereby (s) he was asked „how ‘horse’ is ‘stripes’?” Or, in others words, rate the relevance of the element ‘stripes’ to the construct ‘horse’ – the intensional logic mentioned earlier. this style of question was repeated for each combination of element and construct. the investigator remained at hand to deal with any queries – at the beginning, it took the students a short while to become accustomed to this style of questioning. once the grid was completed, the test was repeated in order to produce a difference grid – the subtraction of the two full grids — to monitor change and to assess consistency. this procedure produced matrices of six rows and six columns. principal component analysis was employed as part of the computer program and a set of co-ordinates based on first and second principal components was produced. These were plotted on a graph producing a visual representation of each student’s semantic space sensu George Kelly (1992). in effect each graph is a type of concept map.
Study 2. Distinguishing equines
109 Volume 18, 2009 school. secondary schooling in ireland is from 12 until 18 years.) the equines chosen were a
mixture of familiar, less familiar and fictitious taxa. They were quagga, zebra, horse, the appaloosa breed of horse, the melanic zebra and the speckled zebra. in the images the shape, size and habit were kept constant; in fact all of the equines were produced from an altered ‘bitmap’ of the zebra. an exhaustive list of features was presented to the subjects. students had to choose a feature that best described the first animal; another feature that best described the second and so on. They then had to rank each feature in turn with each animal thus again producing a matrix of six columns by six rows. the grids were entered into repGrid 2.1. principal component analysis was again employed as part of the computer program and a set of co-ordinates based on first and second principal components was produced. As in the first study, these were plotted on a graph producing a concept map of a particular student’s semantic space.
Study 3. Distinguishing plant families
in the third study, one class (n=12) of year 13 biology students in northern ireland and one class (n=23) of senior post-primary students in spain were given reproductions of botanical drawings of five sets (n=5 families) of dicotyledonous flowering plants. Here they were asked to arrange the drawings into the five families and then to reflect on how they did this by answering questions. they were then asked to rank their means of selecting members of a family as the most important, second most important and third most important. prompting the students to consider the degree of importance of an element, and subsequently repeating the question with reference to different elements, is a strategy taken from Kelly’s (1992) original repGrid test.
Results of Research
Study 1. Distinguishing a non-equine from equines
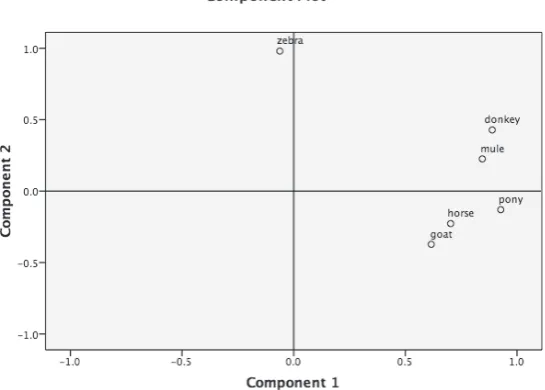
The results of the ‘questionnaires’ were represented as matrices and subjected to principal components analysis. table 2 displays a grid for one student (acssG5). Zebra is given a high rank of having stripes and a low rank of ‘having a chestnut’ etc. The grids and plots for all the subjects were very similar and indicate essentialistic thinking such as focussing on stripes as a feature to separate zebra from horse, which is why, for example, goat is placed close to horse – the ‘essence’ of ‘having stripes’ exerts a strong influence on the thinking of the learner.
Table 2. An example of a grid produced by ACSSG5.
Element 1: stripes Element 2: thick neck Element 3: hardly any mane or tail Element 4:horse shape Element 5: chestnut Element 6: short face or small head
Construct 1: horse 6 3 5 1 2 4
Construct 2: pony 6 3 5 1 4 2
Construct 3: donkey 5 2 4 1 6 3
Construct 4: mule 6 1 3 2 5 4
Construct 5: zebra 1 3 4 2 6 5
Volume 18, 2009
110 figure 3 indicates that for this student it was the presence, or absence, of stripes that dominated the way he classified the animals. Zebra is displaced far from its near relations (the other equines) and goat is placed much nearer to the equines even though it is not a close biological relative.
Figure 3. Component plot of the loadings calculated from a grid produced by ACSSG5.
Study 2. Distinguishing equines.
Figure 4. The grid for one student, PK, and associated cluster analyses.
111 Volume 18, 2009 order to introduce cognitive conflict – they both were given stripes on the legs and shared the
same characteristics except that the appaloosa was spotty. Which feature would take precedence? however, the features the students had drawn up themselves did not help them distinguish the two animals very well.
figure 4 shows an example of a more complex analysis of a grid produced in this study. the cluster analyses indicate the relative similairites and dissimilarities of the student’s ranking of the elements and constructs.
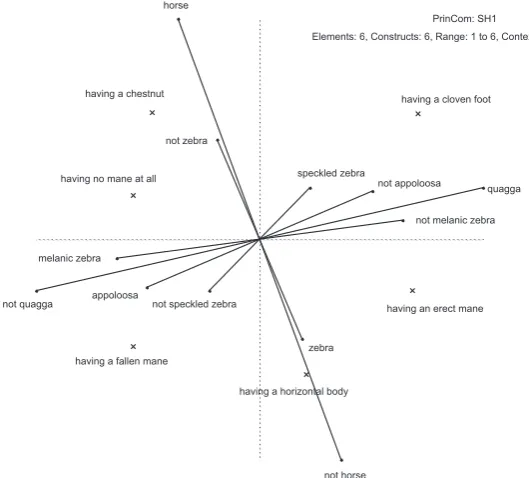
It is interesting to ask what happens when a new animal is encountered that does not fit currently acquired experience? one way in which the students resolved this was by arbitrarily deciding which of them deserved the highest rating ‘6’ on one feature whilst ranking a second feature ‘5’. Then they reversed this order for the second animal. This seems to be a mechanistic approach as there is not a real allocation of ranks based on careful thought. another way students resolved the conflict was to assign a feature that separated the appaloosa from the horse altogether; however this meant that the students were using a feature that did not deserve a rank of 6 for the appaloosa, i.e., it was an inappropriate choice. finally, in distinguishing the melanic (a genetic variant) zebra and speckled (fictitious) zebra, the concept maps of some students showed that these animals were placed close to zebra, which would be scientifically correct. Other students found the relationship between the animals more problematic. for these students the two strategies mentioned above were employed, mapping these animals in isolation or near another animal inappropriately. for student sh1, a typical plot of the principal components shows that the horse and zebra constructs have axes almost perpendicular to the other constructs, that zebra’s axis is much shorter and the proximity of certain elements, or features here, and the zebra’s axis is contra-directional to horse. see figure 5. however, the student in this case has deliberately omitted any elements relating to stripes, perhaps realising that they are a superficial and non-structural feature. thus educators may make inferences from such plots about what the student is thinking as well as being faced with a graphical display of the structure or geometry of such thinking.
Figure 5. Plot of first and second principal components for elements
Volume 18, 2009
112 Study 3. Distinguishing plant families
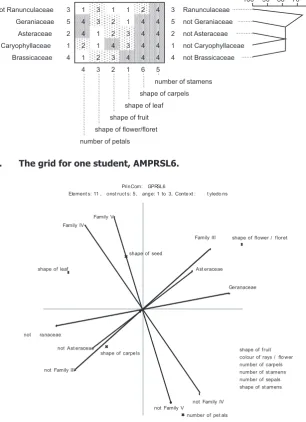
in distinguishing plant families, certain features take precedence over others, e.g. the number of petals or shape of leaf over others such as the number of stamens – compare the fre-quency of ranks ‘1’ and ‘6’ in Figure 6. This precedence denotes prior knowledge whereby the learners have adopted some ideas such as distinguishing trees by their leaves and some herbs by the number of petals. these two features are unreliable if relied on in general approaches to clas-sification where many features need to be employed as well. However, these tend to employ spe-cialist attributes such as number of stamens. as can be seen from figure 5, the number of stamens receives the lowest ranking consistently across the families presented, 4’s, in column 5. in figure 7, we see that this student has used one feature strongly to influence their idea of three families: ‘shape of flower/floret’ for asteraceae, geraniaceae and Family III. This is a general feature, which may be essentialistic, and non-scientific, depending on how it is used.
Figure 6. The grid for one student, AMPRSL6.
Figure 7. More open choice student, Northern Ireland
113 Volume 18, 2009
Conclusions
these brief examples demonstrate how repertory grid analysis may be used to investigate the conceptual structures of school-age children.
We found that children have complex concpetual structures, even of seemingly ‘simple’ concepts of horse, goat and donkey etc. such complex structures could be mapped as a graph and the relationships between components of the structures related to the observed distances between the points on the graphs.
alternative, or mis-, conceptions may be diagnosed using repGrids. by performing such analyses in different stages of a student’s education, changes in conceptual development and learning may be monitored and advice given on the strength of such snapshot assessments. thus, George Kelly’s original idea of the repGrid as a means to help people learn about the constructs they currently have, those they could have, and how to bridge the gap between them is honoured.
rGa is a viable option for the researcher in science education who wishes to work in analysing biological concepts and their structures. also, two ways in which students deal with cognitive conflict were noted.
furthermore, in spite of the renewed emphasis in biodiversity and conservation, and in spite of the fact that it appears to be an innate ability, classification and taxonomy continue to be neglected areas within science education, particularly in western education. a greater psychologi-cal understanding of how students approach the task of classification should lead to more effective ways of enhancing learning, in this, and other areas.
References
Anon. (2006). Repertory Grid Analysis [Electronic Version]. Retrieved 14th March 2006 fromhttp://www.
nuis.ac.jp/~hadley/publication/gridpresent/repgridprocedure.htm.
bezzi, a. (1996). use of repertory Grids in facilitating Knowledge construction and reconstruction in
Geology. Journal of Research in Science Education, 33(2), 179–204.
Boeree, C. G. (2006). George Kelly [Electronic Version]. Retrieved 12th March 2006 fromhttp://www.ship.
edu/~cgboeree/kelly.html.
brook, a., driver, r., & Johnston, K. (1989). learning processes in science: a classroom perspective. in
J. Wellington (ed.), Skills and processes in science education: a critical analysis. london: routledge.
Chambers, W. V., & Grice, J. W. (1986). Circumgrids: a repertory grid package for persoal computers.
Behaviour Research Methods, Instruments & Computers, 18, 468.
driver, r. (1983). The pupil as scientist. milton Keynes: open university press.
driver, r., Guesne, e., & tiberghien, a. (1985). Children’s ideas in science. milton Keynes: open
university press.
fetherstonhaugh, t. (1994). using the repertory grid to probe students’ ideas about energy. Research in
Science and Technological Education, 12(2), 117–127.
fransella, f., bell, r., & bannister, d. (2004). A manual for repertory grid technique. chichester: John
Wiley & sons ltd.
Jankowicz, d. (2004). An easy guide to repertory grids. chichester: John Wiley & sons ltd.
Kelly, G. (1969). a mathematical approach to psychology. in b. maher (ed.), Clinical psychology and
personality: the selected papers of George Kelly. new york: Wiley.
Kelly, G. (1992). The psychology of personal constructs: volume one – a theory of constructs (2nd ed.).
london: routledge.
marr, d. (1982). Vision: a computational investigation into the human representation and processing of
Volume 18, 2009
114 oxford, r. (1997). constructivism: shape-shifting, substance, and teacher education applications. Peabody
Journal of Education, 72, 35–66.
shaw, m. l. G. (1980). On becoming a personal scientist: interactive computer elicitation of personal
models of the world. london: academic press.
shaw, m. l. G., & Gaines, b. r. (1995, 4th august). Kelly’s geometry of psychological space and its
significance for cognitive modelling. Retrieved 13th June, 1997, from http://ksi.cpsc.ucalgary.ca/articles/
newpsych92/references
slater, p. (1964). The principal components of a repertory grid. London: Vincent Andrew.
slater, p. (ed.). (1977). The measurement of intrapersonal space by grid technique: dimensions of
intrapersonal space (Vol. 2). London: Wiley.
sutton, c. r. (1980). the learner’s prior knowledge: a critical view of techniques for probing its
organisation. European Journal of Science Education, 2(2), 107–120.
Adviced by Hugh Gash, St. Patrick’s College, Drumcondra, Ireland
Thomas J. J. McCloughlin BSc, HDipEd, MA(Ed), PhD, Lecturer in Education, St. Patrick’s College, (a college of Dublin City
University), Drumcondra, Dublin, D9, Ireland. Phone: +353 1 8842092.
E-mail: [email protected] Website: http://www.spd.dcu.ie/main/index.shtml
Philip S. C. Matthews Dr., Senior Lecturer in Education, Trinity College, Dublin University, College Green, Dublin 2,