Development of a Segmentation Algorithm for
Identifying the Life Cycle of Smartphone Applications
Umesha Pereraa*, Maiko Shigenoa, and Ushio Sumitab
aGraduate School of Systems and Information Engineering
University of Tsukuba
1-1-1 Tennodai, Tsukuba, Ibaraki, Japan
b
Graduate School of Business Administration, Keio University 4-1-1 Hiyoshi Kohoku-ku, Yokohama, Kanagawa, Japan
Corresponding Author: [email protected]
ABSTRACT
The concept of product life cycle has been applied extensively to a broad range of products and services that remain in use for a long time after they are purchased. Ordinarily, the stage of the product cycle can be determined by tracing the number of products sold during the underlying time unit along the time axis. For digital products and services offered through the Internet, however, life cycle may not be determined in a similar manner because such products and services may be repeatedly installed and uninstalled dynamically over time. Because of this, and the difficulty of acquiring real data, there is little literature on the product life cycle of Internet-related digital products and services. Recently, a Japanese software development company, Fuller, Inc., developed Android smartphone applications that enabled the company to obtain actual data concerning installments and un-installments of smartphone applications through the legitimate agreement between the company and the users of these applications. Based on the large volume of smartphone applications usage data acquired from Fuller, Inc., this paper aims to fill the above gap by capturing the product life cycle of smartphone applications. Keeping the feature of dynamic installment and un-installment of smartphone applications in mind, the authors develop a segmentation algorithm to classify smartphone applications into three categories based on product life cycle: Class (A), smartphone applications that are active in life cycle; Class (B), smartphone applications that are at the tail of the life cycle; and Class (C), smartphone applications that are already diminishing. Numerical results are presented to validate the proposed segmentation algorithm.
International Journal of Business and Information
1.
INTRODUCTION
In marketing, product life cycle consists of four stages: (I) introduction; (II) growth; (III) maturity; and (IV) decline (see, e.g., Kotler & Keller, 2012). For typical products and services, the stage of the product cycle may be determined by tracing the number of products sold during the underlying time unit (e.g., day, week, month, or year) along the time axis, as depicted in Figure 1.
Figure 1. The Four Stages of Product Life Cycle in Marketing
Ordinary products and services remain in use for a long period after they are purchased. Smartphone applications are different, however, because they may be repeatedly installed and uninstalled dynamically over time. It may not be appropriate, therefore, to describe the product life cycle of a smartphone application in terms of the number of devices that install it in the underlying time unit, say a month. Keeping the feature of dynamic installment and un-installment of smartphone applications in mind, Perera, Shigeno, Sumita, and Yamamoto (2016) introduced usage patterns of a device for a smartphone application based on whether the device had the underlying smartphone application over the last six months in order to develop key performance measures of individual smartphone applications. Furthermore, they established a statistical approach for estimating such performance measures.
the device, it may be appropriate to use the distribution of devices over different usage patterns for identifying the stage of the life cycle of individual smartphone applications. The purpose of this paper is to achieve this goal by developing segmentation criteria for classifying smartphone applications based on the concept of the product life cycle.
The structure of this paper is as follows. Section 2 is a summary of literature relevant to the study. Section 3 describes the underlying data set in detail and presents a specific subset for the study. In Section 4, usage patterns of a device for smartphone applications are summarized from Perera et al. (2016). In Section 5, usage patterns are formed into three groups: Group (a), Group (b), and Group (c). This, in turn, enables one to classify smartphone applications into three categories based on the concept of product life cycle: Class (A), for smartphone applications that are active in the life cycle; Class (B), for smartphone applications that are at the tail of the life cycle; and Class (C), for smartphone applications that are already diminishing. In Section 6, a discrete time Markov chain model is developed, where the Markov chain has the state space {(𝑎𝑎), (𝑏𝑏), (𝑐𝑐), (𝑑𝑑)} with (𝑑𝑑) being deceased. A numerical procedure is developed for computing the survival functions of the first passage times 𝑇𝑇𝑎𝑎→𝑑𝑑 and 𝑇𝑇𝑏𝑏→𝑑𝑑 . Quantifiable criteria for classifying smartphone applications into Class (A), Class (B), and Class (C) are then developed in terms of 𝑃𝑃[𝑇𝑇𝑎𝑎→𝑑𝑑> 10] and 𝑃𝑃[𝑇𝑇𝑏𝑏→𝑑𝑑 > 10]. In Section 7, the validity of the criteria is tested by applying them to a new set of applications. Section 8 presents concluding remarks.
2.
LITERATURE
REVIEW
As presented in an excellent review paper by Osland (1991), the concept of product life cycle dates to as early as the 1930s, when Kleppner (1933) suggested the three stages (pioneering stage, competitive stage, and retentive stage) through which a typical product goes. The concept was termed product life cycle for the first time by Dean (1950). Subsequently, Forrester (1959) provided the first graphical presentation of the product life cycle with the four stages, “introduction,” “growth,” “maturity,” and “decline.”
International Journal of Business and Information
identified by Cox Jr. (1967), demonstrating that the conceptual distribution might not necessarily be apparent for every product. Other early studies include, for example, Bass (1969), Rink and Swan (1979), Polli and Cook (1969), and Day (1986). More recently, the study of product life cycle has been expanded to include the brand beyond individual products, as well as technological products such as semi-conductors and computer models represented by Norton and Bass (1987), Kurawarwala and Matsuo (1998), and Peres, Mahajan, and Muller (2010).
Marketing studies of Internet-related products and services have been limited in the literature, primarily because of the difficulty of acquiring real data in reasonable volume. To analyze the market for mobile phone applications, for example, many previous papers have relied on a limited set of usage data gathered from a relatively small number of volunteers. For example, Falaki et al. (2010) analyzed smartphone applications usage based on a set of real data collected from 255 smartphone users from two different smartphone platforms for periods of 7 to 28 weeks. Minh, Do, Blom, and Gatica-Perez (2011) used usage events, location data, and Bluetooth data for a set of applications collected from 77 smartphone users for a period of 9 months to analyze application usage in the contexts of location and proximity. To improve smartphone performance and user experience, Chang, Qi, Enhong, and Hui (2012) proposed a mechanism called “prediction algorithm with fixed cycle length (PAFCL)” for predicting mobile users’ application uses, which was tested against real data collected from 38 volunteers.
An alternative approach for overcoming the difficulty of collecting real data is to rely on network-level information, at the loss of details on individual users. For example, based on IP-level network data from a cellular network in the U.S. for one week, Xu et al. (2011) analyzed diurnal patterns of different application types, network access patterns, and their relation to the location. Tongaonkar, Dai, Nucci, and Song (2013) introduced a method of understanding mobile application usage patterns in the Android environment using the information of mobile in-app advertisements in network traces. All of these studies were concerned with understanding the usage patterns of a device on a daily basis over a short period, largely limited to aspects of energy or resource consumption.
application features for the 200 most-downloaded applications in various categories. No literature exists, however, for studying the life cycles of smartphone applications based on real data collected from a substantial number of individual users over a considerable length of time. This is so because it is virtually impossible to obtain such data needed for the study. Recently, however, a Japanese software development company, Fuller, Inc., has found a way to establish a win-win relationship with Android smartphone users so as to achieve this seemingly impossible task.
Smartphones are known to contain idle applications that consume a substantial amount of energy, resulting in shortened battery life. In November 2012, Fuller, Inc., introduced a software package called “Mr. Mobile, the battery saver,” which enables the company to acquire information about which smartphone applications are downloaded to and removed from the devices that are registered with the agreement of the customers. In exchange, the customers receive a free assessment of the level of energy consumption for each smartphone application in their device and recommendations concerning which idle applications should be removed. Because of this benefit, “Mr. Mobile, the battery saver” and other similar smartphone applications have been gaining popularity in the market, with almost 1 million downloads to date.
Through a joint research project between Fuller, Inc., and a research group at the University of Tsukuba, the authors of the current study could obtain a valuable set of real data involving a set of smartphone devices (with alpha-numeric ID only) having Android OS, along with monthly usage information about which applications were present and/or removed over the 40-month period between January 2013 and April 2016. Using this data set, we propose a segmentation algorithm for identifying the life cycles of smartphone applications, which will have useful business implications for application developers.
3.
DATA
DESCRIPTION
International Journal of Business and Information
Month_k; whereas, “0” in Month_k means that the application was not present in the device throughout Month_k.
Table 1
Monthly Application Usage Over a 40-Month Period, January 2013 – April 2016
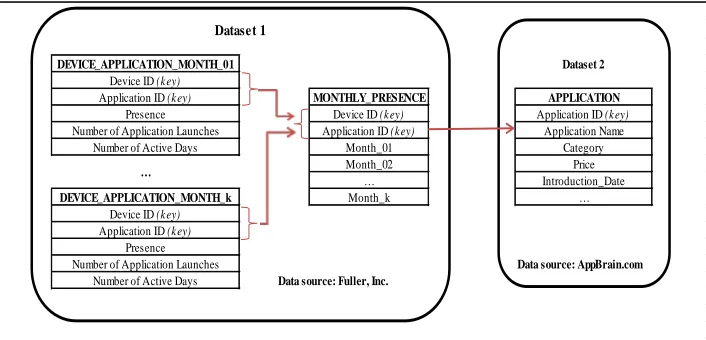
Other data of importance were obtained from AppBrain.com with its website (“App Brain,” 2016), which hosts an ample amount of information about Android smartphone applications and the Android market, including application ID, application name, category, price, and application release history. In this study, we use these two data sets together, linking them through the key application ID. The resulting data structure is depicted in Figure 2.
Figure 2. Data Structure for Current Study
Because of the massive amount of data, we focused on a category of smartphone applications called “Free Games.” Furthermore, for the sake of consistency in this study, we chose only those applications satisfying the following two conditions:
Device ID Application ID Month_01 Month_02 … Month_k
52dc3c9db775bc12dd53b01b com.linecorp.LGTMTM 0 0 1 50e433eead4c767ee0e55043 jp.naver.SJLINEPANG 1 1 0 …
DEVICE_APPLICATION_MONTH_01 Dataset 2
Device ID (key)
Application ID (key) MONTHLY_PRESENCE APPLICATION
Presence Device ID (key) Application ID (key)
Number of Application Launches Application ID (key) Application Name
Number of Active Days Month_01 Category
Month_02 Price
… Introduction_Date
DEVICE_APPLICATION_MONTH_k Month_k …
Device ID (key)
Application ID (key)
Presence
Number of Application Launches Data source: AppBrain.com
Number of Active Days Data source: Fuller, Inc. …
(C1) Applications within the top 30% in terms of the monthly number of devices having the underlying application in each month over the data period
(C2) Applications with the maximum of such monthly number of devices in (C1) over the data period, being 5,000 or more
The set of applications in Free Games that satisfy (C1) and (C2) consists of 20 applications across seven sub-categories, as shown in Table 2.
Table 2
Applications in Free Games Satisfying (C1) and (C2)
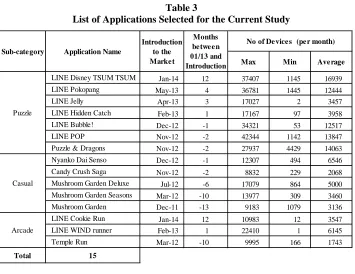
As indicated in Table 2, the top three sub-categories – Puzzle, Casual, and Arcade – account for 75% of the applications in Free Games that satisfy (C1) and (C2). For computational efficiency, we focused exclusively on the 15 applications in the top three sub-categories, as listed in Table 3. This set of applications is denoted by 𝐴𝐴15.
Let 𝐴𝐴(𝑆𝑆) be the set of applications selected in Table 3 for sub-category 𝑆𝑆 ∈
{ 𝑃𝑃𝑃𝑃𝑃𝑃𝑃𝑃𝑃𝑃𝑃𝑃, 𝐶𝐶𝑎𝑎𝐶𝐶𝑃𝑃𝑎𝑎𝑃𝑃, 𝐴𝐴𝐴𝐴𝑐𝑐𝑎𝑎𝑑𝑑𝑃𝑃 }, and denote the set of devices having application
𝑎𝑎 ∈ 𝐴𝐴(𝑆𝑆) in month 𝑘𝑘 ∈ 𝑇𝑇 by 𝐷𝐷(𝑎𝑎,𝑘𝑘), where 𝑇𝑇 is the set of months constituting the data period. We also define 𝐷𝐷(𝑆𝑆,𝑘𝑘) =⋃𝑎𝑎∈𝑆𝑆𝐷𝐷(𝑎𝑎,𝑘𝑘) and 𝐷𝐷(𝑆𝑆) =
⋃𝑘𝑘∈𝑇𝑇𝐷𝐷(𝑆𝑆,𝑘𝑘). In what follows, we classify the applications in 𝐴𝐴(𝑆𝑆) into three
groups based on the concept of the product life cycle.
Sub-category Number of Applications Cumulative Percentage
Puzzle 7 35%
Casual 5 60%
Arcade 3 75%
Action 2 85%
Card 1 90%
Casino 1 95%
Roleplaying 1 100%
International Journal of Business and Information Table 3
List of Applications Selected for the Current Study
4.
USAGE
PATTERNS
FOR
SMARTPHONE
APPLICATIONS
In this section, we present a succinct summary of usage patterns of mobile devices for smartphone applications from Perera, Shigeno, Sumita, and Yamamoto (2016). This information provides a useful means for classifying smartphone applications based on their life cycle.Let 𝐼𝐼(𝑡𝑡) be the six-month period ending in month 𝑡𝑡 ∈ 𝑇𝑇; that is, 𝐼𝐼(𝑡𝑡) =
{ 𝑡𝑡 −5,𝑡𝑡 −4, … ,𝑡𝑡 }. For each 𝑎𝑎 ∈ 𝐴𝐴(𝑆𝑆) and 𝐼𝐼(𝑡𝑡), we decompose 𝐷𝐷(𝑆𝑆) into subgroups based on the following ten usage patterns for 𝑎𝑎 ∈ 𝐴𝐴(𝑆𝑆).
(1) 𝑁𝑁𝑃𝑃𝑃𝑃𝑃𝑃 (𝑎𝑎,𝑡𝑡) :
Those 𝑑𝑑 ∈ 𝐷𝐷(𝑆𝑆) for which 𝑎𝑎 ∈ 𝐴𝐴(𝑆𝑆) was not present over 𝐼𝐼(𝑡𝑡)
(2) 𝐸𝐸𝐸𝐸𝐸𝐸𝑃𝑃𝐸𝐸𝐴𝐴𝐸𝐸𝐸𝐸𝐸𝐸 (𝑎𝑎,𝑡𝑡) :
Those 𝑑𝑑 ∈ 𝐷𝐷(𝑆𝑆) for which [𝑎𝑎 ∈ 𝐴𝐴(𝑆𝑆) was not present during the first 5 months of 𝐼𝐼(𝑡𝑡) and was then present in 𝑡𝑡 ∈ 𝐼𝐼(𝑡𝑡)] or [𝑎𝑎 ∈ 𝐴𝐴(𝑆𝑆) was not present during the first 2 to 4 months of 𝐼𝐼(𝑡𝑡), was present subsequently for 1 or 2 months, and was then not present in 𝑡𝑡 ∈ 𝐼𝐼(𝑡𝑡)]
Max Min Average
LINE Disney TSUM TSUM Jan-14 12 37407 1145 16939
LINE Pokopang May-13 4 36781 1445 12444
LINE Jelly Apr-13 3 17027 2 3457
LINE Hidden Catch Feb-13 1 17167 97 3958
LINE Bubble! Dec-12 -1 34321 53 12517
LINE POP Nov-12 -2 42344 1142 13847
Puzzle & Dragons Nov-12 -2 27937 4429 14063
Nyanko Dai Senso Dec-12 -1 12307 494 6546
Candy Crush Saga Nov-12 -2 8832 229 2068
Mushroom Garden Deluxe Jul-12 -6 17079 864 5000
Mushroom Garden Seasons Mar-12 -10 13977 309 3460
Mushroom Garden Dec-11 -13 9183 1079 3136
LINE Cookie Run Jan-14 12 10983 12 3547
LINE WIND runner Feb-13 1 22410 1 6145
Temple Run Mar-12 -10 9995 166 1743
Total 15 Months between 01/13 and Introduction Puzzle
No of Devices (per month) Sub-category Application Name
Introduction to the Market
(3) 𝑅𝑅𝐸𝐸𝐶𝐶𝐸𝐸𝐸𝐸𝐸𝐸 (𝑎𝑎,𝑡𝑡) :
Those 𝑑𝑑 ∈ 𝐷𝐷(𝑆𝑆) for which 𝑎𝑎 ∈ 𝐴𝐴(𝑆𝑆) was not present during the first 2 to 4 months of 𝐼𝐼(𝑡𝑡) and then was present thereafter
(4) 𝑆𝑆𝑡𝑡𝑎𝑎𝑏𝑏𝑃𝑃𝑃𝑃 (𝑎𝑎,𝑡𝑡) :
Those 𝑑𝑑 ∈ 𝐷𝐷(𝑆𝑆) for which 𝑎𝑎 ∈ 𝐴𝐴(𝑆𝑆) was present for 2 months during the first 3 months of 𝐼𝐼(𝑡𝑡), and then was present in each of the last 3 months
(5) 𝑀𝑀𝑎𝑎𝑡𝑡𝑃𝑃𝐴𝐴𝑃𝑃𝑑𝑑 (𝑎𝑎,𝑡𝑡) :
Those 𝑑𝑑 ∈ 𝐷𝐷(𝑆𝑆) for which 𝑎𝑎 ∈ 𝐴𝐴(𝑆𝑆) was present throughout 𝐼𝐼(𝑡𝑡)
(6) 𝑊𝑊𝑎𝑎𝐴𝐴𝐸𝐸𝐸𝐸𝐸𝐸𝐸𝐸 (𝑎𝑎,𝑡𝑡) :
Those 𝑑𝑑 ∈ 𝐷𝐷(𝑆𝑆) for which [ 𝑎𝑎 ∈ 𝐴𝐴(𝑆𝑆) was present for exactly 3 months consecutively during the first 5 months of 𝐼𝐼(𝑡𝑡) or present for 4 to 5 months in the first 5 months] and then was not present in 𝑡𝑡 ∈ 𝐼𝐼(𝑡𝑡)
(7) 𝐶𝐶𝑃𝑃𝑎𝑎𝐶𝐶𝐸𝐸𝐸𝐸𝐸𝐸 (𝑎𝑎,𝑡𝑡) :
Those 𝑑𝑑 ∈ 𝐷𝐷(𝑆𝑆) for which 𝑎𝑎 ∈ 𝐴𝐴(𝑆𝑆) was present for at least 1 month during the first 3 months of 𝐼𝐼(𝑡𝑡), and was not present throughout the last 3 months of 𝐼𝐼(𝑡𝑡)
(8) 𝑅𝑅𝑃𝑃𝑐𝑐𝐸𝐸𝑅𝑅𝑃𝑃𝐴𝐴𝐸𝐸𝐸𝐸𝐸𝐸 (𝑎𝑎,𝑡𝑡) :
Those d ∈ D(S) for which 𝑎𝑎 ∈ 𝐴𝐴(𝑆𝑆) was present for 1 to 4 months before getting removed and was then present again subsequently
(9) 𝑅𝑅𝑃𝑃𝑎𝑎𝑐𝑐𝑡𝑡𝐸𝐸𝑅𝑅𝑎𝑎𝑡𝑡𝐸𝐸𝐸𝐸𝐸𝐸 (𝑎𝑎,𝑡𝑡) :
Those 𝑑𝑑 ∈ 𝐷𝐷(𝑆𝑆) for which 𝑎𝑎 ∈ 𝐴𝐴(𝑆𝑆) was present for 1 to 3 months during the first 4 months of 𝐼𝐼(𝑡𝑡), removed in the 5th month, and present again in the 6th month
(10) 𝐹𝐹𝐸𝐸𝑐𝑐𝑘𝑘𝑃𝑃𝑃𝑃 (𝑎𝑎,𝑡𝑡) :
Those 𝑑𝑑 ∈ 𝐷𝐷(𝑆𝑆) for which 𝑎𝑎 ∈ 𝐴𝐴(𝑆𝑆) was present and removed several times and the use pattern does not belong to any of the use patterns Warning, Ceasing, Recovering, or Reactivating
Let 𝑈𝑈𝑃𝑃𝑗𝑗(𝑎𝑎,𝑡𝑡) be the usage pattern corresponding to (𝑗𝑗) above; that is,
𝑈𝑈𝑃𝑃1(𝑎𝑎,𝑡𝑡) =𝑁𝑁𝑃𝑃𝑃𝑃𝑃𝑃(𝑎𝑎,𝑡𝑡),𝑈𝑈𝑃𝑃2(𝑎𝑎,𝑡𝑡) =𝐸𝐸𝐸𝐸𝐸𝐸𝑃𝑃𝐸𝐸𝐴𝐴𝐸𝐸𝐸𝐸𝐸𝐸(𝑎𝑎,𝑡𝑡), and so on, and define
International Journal of Business and Information
We also define
(4.1) 𝑏𝑏(𝑎𝑎,𝑑𝑑,𝑘𝑘) = �1 𝑎𝑎𝐸𝐸𝐸𝐸𝑃𝑃𝐸𝐸𝑐𝑐𝑎𝑎𝑡𝑡𝐸𝐸𝐸𝐸𝐸𝐸𝑎𝑎𝐸𝐸𝐶𝐶𝐸𝐸𝐴𝐴𝑃𝑃𝐶𝐶𝑃𝑃𝐸𝐸𝑡𝑡𝐸𝐸𝐸𝐸𝑑𝑑𝑃𝑃𝑅𝑅𝐸𝐸𝑐𝑐𝑃𝑃𝑑𝑑𝐸𝐸𝐸𝐸𝑚𝑚𝐸𝐸𝐸𝐸𝑡𝑡ℎ𝑘𝑘 0 𝐸𝐸𝑡𝑡ℎ𝑃𝑃𝐴𝐴𝑒𝑒𝐸𝐸𝐶𝐶𝑃𝑃 .
For 𝑘𝑘 ≠1, let 𝐶𝐶𝐸𝐸𝐸𝐸𝐸𝐸(𝑎𝑎,𝑑𝑑,𝑘𝑘) be the flag for indicating the switch of the status of application 𝑎𝑎in device 𝑑𝑑 in month 𝑘𝑘; that is,
(4.2) 𝐶𝐶𝐸𝐸𝐸𝐸𝐸𝐸(𝑎𝑎,𝑑𝑑,𝑘𝑘) = �1 𝐸𝐸𝑖𝑖𝑏𝑏(𝑎𝑎,𝑑𝑑,𝑘𝑘 −1) ≠ 𝑏𝑏(𝑎𝑎,𝑑𝑑,𝑘𝑘) 0 𝐸𝐸𝑡𝑡ℎ𝑃𝑃𝐴𝐴𝑒𝑒𝐸𝐸𝐶𝐶𝑃𝑃 .
We are now in a position to define 𝑈𝑈𝑃𝑃𝑗𝑗(𝑎𝑎,𝑡𝑡) formally.
(4.3) 𝑑𝑑 ∈ 𝑈𝑈𝑃𝑃1(𝑎𝑎,𝑡𝑡) ↔ ∑𝑘𝑘𝑘𝑘𝑘𝑘(𝑡𝑡)𝑏𝑏(𝑎𝑎,𝑑𝑑,𝑘𝑘) = 0 .
(4.4) 𝑑𝑑 ∈ 𝑈𝑈𝑃𝑃2(𝑎𝑎,𝑡𝑡) ↔ �∑ 𝑏𝑏(𝑎𝑎,𝑑𝑑,𝑡𝑡 − 𝑘𝑘) 5
𝑘𝑘=3 = 0 𝑎𝑎𝐸𝐸𝑑𝑑
∑2 𝑏𝑏(𝑎𝑎,𝑑𝑑,𝑡𝑡 − 𝑘𝑘)
𝑘𝑘=0 = 1 � 𝐸𝐸𝐴𝐴
� ∑5𝑘𝑘=4𝑏𝑏(𝑎𝑎,𝑑𝑑,𝑡𝑡 − 𝑘𝑘)= 0 𝑎𝑎𝐸𝐸𝑑𝑑𝑏𝑏(𝑎𝑎,𝑑𝑑,𝑡𝑡) = 0 𝑎𝑎𝐸𝐸𝑑𝑑 ∑3 𝑏𝑏(𝑎𝑎,𝑑𝑑,𝑡𝑡 − 𝑘𝑘)
𝑘𝑘=1 = 2 𝑎𝑎𝐸𝐸𝑑𝑑 ∑3𝑘𝑘=0𝐶𝐶𝐸𝐸𝐸𝐸𝐸𝐸(𝑎𝑎,𝑑𝑑,𝑡𝑡 − 𝑘𝑘)= 2� .
(4.5) 𝑑𝑑 ∈ 𝑈𝑈𝑃𝑃3(𝑎𝑎,𝑡𝑡)↔ ∑5𝑘𝑘=𝑚𝑚𝑏𝑏(𝑎𝑎,𝑑𝑑,𝑡𝑡 − 𝑘𝑘)= 0 𝑎𝑎𝐸𝐸𝑑𝑑 ∑𝑚𝑚−1𝑘𝑘=0 𝑏𝑏(𝑎𝑎,𝑑𝑑,𝑡𝑡 − 𝑘𝑘)=𝑚𝑚,
𝑚𝑚= 2,3,4 .
(4.6) 𝑑𝑑 ∈ 𝑈𝑈𝑃𝑃4(𝑎𝑎,𝑡𝑡) ↔ ∑5𝑘𝑘=3𝑏𝑏(𝑎𝑎,𝑑𝑑,𝑡𝑡 − 𝑘𝑘) = 2 𝑎𝑎𝐸𝐸𝑑𝑑 ∑2𝑘𝑘=0𝑏𝑏(𝑎𝑎,𝑑𝑑,𝑡𝑡 − 𝑘𝑘) = 3 . (4.7) 𝑑𝑑 ∈ 𝑈𝑈𝑃𝑃5(𝑎𝑎,𝑡𝑡) ↔ ∑𝑘𝑘∈𝑘𝑘(𝑡𝑡)𝑏𝑏(𝑎𝑎,𝑑𝑑,𝑘𝑘)= 6 .
(4.8) 𝑑𝑑 ∈ 𝑈𝑈𝑃𝑃6(𝑎𝑎,𝑡𝑡) ↔ (𝑏𝑏(𝑎𝑎,𝑑𝑑,𝑡𝑡) = 0 𝑎𝑎𝐸𝐸𝑑𝑑 ∑5𝑘𝑘=1𝑏𝑏(𝑎𝑎,𝑑𝑑,𝑡𝑡 − 𝑘𝑘) ≥ 4) 𝐸𝐸𝐴𝐴
�
𝑏𝑏(𝑎𝑎,𝑑𝑑,𝑡𝑡 −5) = 𝑏𝑏(𝑎𝑎,𝑑𝑑,𝑡𝑡) = 0 𝑎𝑎𝐸𝐸𝑑𝑑 ∑4 𝑏𝑏(𝑎𝑎,𝑑𝑑,𝑡𝑡 − 𝑘𝑘)
𝑘𝑘=1 = 3 𝑎𝑎𝐸𝐸𝑑𝑑 ∑4 𝐶𝐶𝐸𝐸𝐸𝐸𝐸𝐸(𝑎𝑎,𝑑𝑑,𝑡𝑡 − 𝑘𝑘)
𝑘𝑘=0 = 2
� .
(4.9) 𝑑𝑑 ∈ 𝑈𝑈𝑃𝑃7(𝑎𝑎,𝑡𝑡) ↔ ∑2𝑘𝑘=0𝑏𝑏(𝑎𝑎,𝑑𝑑,𝑡𝑡 − 𝑘𝑘) = 0 𝑎𝑎𝐸𝐸𝑑𝑑 ∑5𝑘𝑘=3𝑏𝑏(𝑎𝑎,𝑑𝑑,𝑡𝑡 − 𝑘𝑘) ≥ 1 .
(4.10) 𝑑𝑑 ∈ 𝑈𝑈𝑃𝑃8(𝑎𝑎,𝑡𝑡) ↔ �
𝑏𝑏(𝑎𝑎,𝑑𝑑,𝑡𝑡) = 𝑏𝑏(𝑎𝑎,𝑑𝑑,𝑡𝑡 −1) = 1 𝑎𝑎𝐸𝐸𝑑𝑑 𝑏𝑏(𝑎𝑎,𝑑𝑑,𝑡𝑡 −2) = 0 𝑎𝑎𝐸𝐸𝑑𝑑 ∑5 𝑏𝑏(𝑎𝑎,𝑑𝑑,𝑡𝑡 − 𝑘𝑘)≥1
𝑘𝑘=3
�
𝑏𝑏(𝑎𝑎,𝑑𝑑,𝑡𝑡) = 1 𝑎𝑎𝐸𝐸𝑑𝑑𝑏𝑏(𝑎𝑎,𝑑𝑑,𝑡𝑡 −1) = 0 𝑎𝑎𝐸𝐸𝑑𝑑 ∑5 𝑏𝑏(𝑎𝑎,𝑑𝑑,𝑡𝑡 − 𝑘𝑘)≥ 3
𝑘𝑘=2 𝑎𝑎𝐸𝐸𝑑𝑑
∑4 𝐶𝐶𝐸𝐸𝐸𝐸𝐸𝐸(𝑎𝑎,𝑑𝑑,𝑡𝑡 − 𝑘𝑘)≤ 1 𝑘𝑘=2
� 𝐸𝐸𝐴𝐴
�𝑏𝑏(𝑎𝑎,𝑑𝑑,𝑡𝑡) = 𝑏𝑏(𝑏𝑏𝑎𝑎(,𝑎𝑎𝑑𝑑,,𝑑𝑑𝑡𝑡 −,𝑡𝑡 −1) =3) = 0 𝑏𝑏(𝑎𝑎𝑎𝑎𝐸𝐸𝑑𝑑,𝑑𝑑,𝑡𝑡 − 2) = 1 𝑎𝑎𝐸𝐸𝑑𝑑 ∑5 𝑏𝑏(𝑎𝑎,𝑑𝑑,𝑡𝑡 − 𝑘𝑘) = 1
𝑘𝑘=4
�.
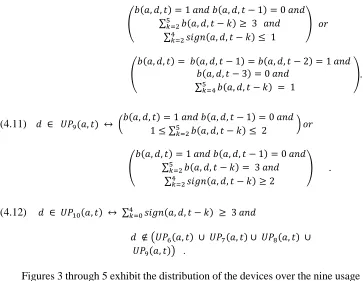
(4.11) 𝑑𝑑 ∈ 𝑈𝑈𝑃𝑃9(𝑎𝑎,𝑡𝑡) ↔ �𝑏𝑏(𝑎𝑎,𝑑𝑑,𝑡𝑡) = 1 𝑎𝑎𝐸𝐸𝑑𝑑𝑏𝑏(𝑎𝑎,𝑑𝑑,𝑡𝑡 −1) = 0 𝑎𝑎𝐸𝐸𝑑𝑑 1≤ ∑5 𝑏𝑏(𝑎𝑎,𝑑𝑑,𝑡𝑡 − 𝑘𝑘)
𝑘𝑘=2 ≤ 2 � 𝐸𝐸𝐴𝐴
�
𝑏𝑏(𝑎𝑎,𝑑𝑑,𝑡𝑡) = 1 𝑎𝑎𝐸𝐸𝑑𝑑𝑏𝑏(𝑎𝑎,𝑑𝑑,𝑡𝑡 −1) = 0 𝑎𝑎𝐸𝐸𝑑𝑑 ∑5 𝑏𝑏(𝑎𝑎,𝑑𝑑,𝑡𝑡 − 𝑘𝑘)
𝑘𝑘=2 = 3 𝑎𝑎𝐸𝐸𝑑𝑑 ∑4 𝐶𝐶𝐸𝐸𝐸𝐸𝐸𝐸(𝑎𝑎,𝑑𝑑,𝑡𝑡 − 𝑘𝑘)
𝑘𝑘=2 ≥2
� .
(4.12) 𝑑𝑑 ∈ 𝑈𝑈𝑃𝑃10(𝑎𝑎,𝑡𝑡) ↔ ∑4𝑘𝑘=0𝐶𝐶𝐸𝐸𝐸𝐸𝐸𝐸(𝑎𝑎,𝑑𝑑,𝑡𝑡 − 𝑘𝑘) ≥ 3 𝑎𝑎𝐸𝐸𝑑𝑑
𝑑𝑑 ∉ �𝑈𝑈𝑃𝑃6(𝑎𝑎,𝑡𝑡) ∪ 𝑈𝑈𝑃𝑃7(𝑎𝑎,𝑡𝑡)∪ 𝑈𝑈𝑃𝑃8(𝑎𝑎,𝑡𝑡) ∪ 𝑈𝑈𝑃𝑃9(𝑎𝑎,𝑡𝑡)� .
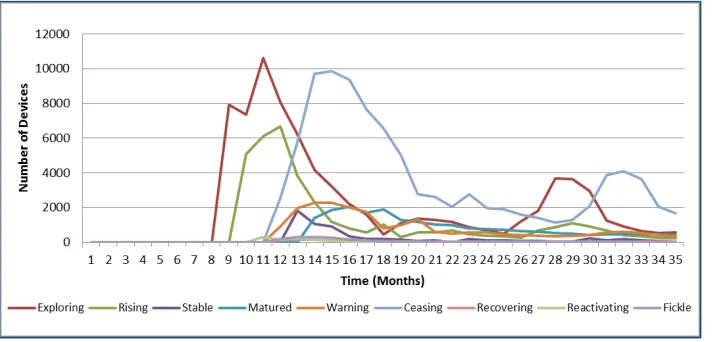
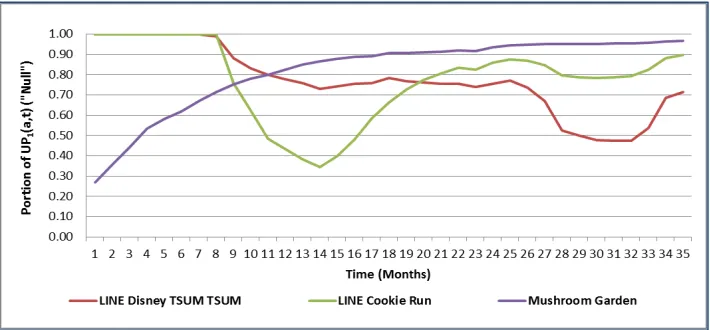
Figures 3 through 5 exhibit the distribution of the devices over the nine usage patterns excluding𝑈𝑈𝑃𝑃1(𝑎𝑎,𝑡𝑡) (Null) for three applications, LINE Disney TSUM TSUM, LINE Cookie Run, and Mushroom Garden, during the period June 2013 through April 2016.
International Journal of Business and Information Figure 4. Distribution of Devices Over the Usage Patterns for LINE Cookie Run
Figure 5. Distribution of Devices Over the Usage Patterns for Mushroom Garden
Figure 6. Portion of Devices with UP1(a,t) (Null) – June 2013 Through April 2016
5.
THREE
GROUPS
OF
SMARTPHONE
APPLICATIONS
BASED
ON
THE
CONCEPT
OF
PRODUCT
LIFE
CYCLE
In this section, using the usage patterns developed in Section 4, we classify the 15 smartphone applications in 𝐴𝐴15 listed in Table 3 into three groups based on the concept of product life cycle. For this purpose, we focus on the number of months after the installment of a smartphone application into the market, rather than the calendar months.
Since the product life cycle consists of four stages, we first combine the ten usage patterns into the following four groups.
Group (a): Exploring and Fickle
Group (b): Rising, Stable, Matured, Recovering, and Reactivating Group (c): Warning and Ceasing
Group (d): Null
It is expected that the changes over time in the distribution of devices across the four groups would enable one to define in which stage of the product life cycle the underlying smartphone application may be.
International Journal of Business and Information
except for LINE Disney TSUM TSUM and LINE Cookie Run, each having only 28 months.
Figure 7(a). Number of Devices (LINE Disney TSUM TSSUM)
Figure 7(b). Usage Pattern Groups (LINE Disney TSUM TSSUM)
Figure 8(a).
Number of Devices (LINE Pokopang)
Figure 8(b).
Usage Pattern Groups (LINE Pokopang)
Figure 9(a).
Number of Devices (LINE Cookie Run)
Figure 9(b).
Figure 10(a).
Number of Devices (Candy Crush Saga)
Figure 10(b).
Usage Pattern Groups (Candy Crush Saga)
Figure 11(a).
Number of Devices (Puzzle & Dragons)
Figure 11(b).
Usage Pattern Groups (Puzzle & Dragons)
Figure 12(a).
Number of Devices (LINE WIND Runner)
Figure 12(b).
International Journal of Business and Information Figure 13(a).
Number of Devices (LINE POP)
Figure 13(b). Usage Pattern Groups
(LINE POP)
Figure 14(a). Number of Devices (Mushroom Garden Deluxe)
Figure 14(b). Usage Pattern Groups (Mushroom Garden Deluxe)
Figure 15(a).
Number of Devices (LINE Hidden Catch)
Figure 15(b).
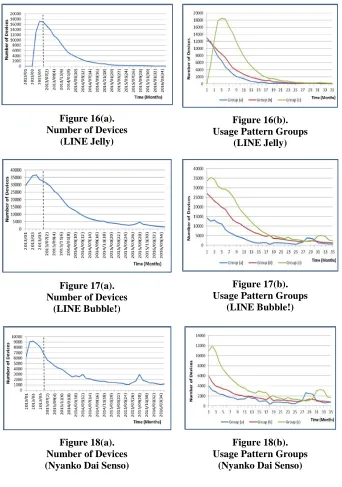
Figure 16(a). Number of Devices
(LINE Jelly)
Figure 16(b). Usage Pattern Groups
(LINE Jelly)
Figure 17(a). Number of Devices
(LINE Bubble!)
Figure 17(b). Usage Pattern Groups
(LINE Bubble!)
Figure 18(a). Number of Devices (Nyanko Dai Senso)
Figure 18(b). Usage Pattern Groups
International Journal of Business and Information Figure 19(a).
Number of Devices (Mushroom Garden Seasons)
Figure 19(b). Usage Pattern Groups (Mushroom Garden Seasons)
Figure 20(a). Number of Devices
(Temple Run)
Figure 20(b). Usage Pattern Groups
(Temple Run)
Figure 21(a). Number of Devices (Mushroom Garden)
Figure 21(b). Usage Pattern Groups
It should be noted that the sudden surge about two years after the introduction into the market in Figure 7(a) can be explained by the same surge of the portion for Group (a), followed by the delayed surge of a few months for Group (c) in Figure 7(b). Those devices contributed to the later surge in Figure 7(a), un-installed the application only a few months later, without making any contribution to increase the portion for Group (b). Similar observations can be made for other applications with a later surge (e.g., LINE Cookie Run in Figure 9(a) and Figure 9(b), demonstrating the usefulness of introducing groups (a) through (c).
By observing the graphs in figures 7(a) and 7(b) through figures 21(a) and 21(b), we can classify the 15 smartphone applications into three groups, as shown in Table 4, where we define:
Class (A): Applications active in life cycle at the end of the data period Class (B): Applications at the tail of the life cycle at the end of the data period Class (C): Applications already diminished at the end of the data period
Table 4
Smartphone Application Groups
In the next section, we establish an algorithmic procedure for classifying any smartphone application into one of the three classes, (A) through (C).
Application
LINE Disney TSUM TSUM LINE Pokopang
LINE Cookie Run Candy Crush Saga Puzzle & Dragons LINE Wind Runner LINE POP
Mushroom Garden Deluxe LINE Hidden Catch LINE Jelly
LINE Bubble! Nyanko Dai Senso Mushroom Garden Seasons Temple Run
Mushroom Garden Class (A)
Class (B)
International Journal of Business and Information
6.
DEVELOPMENT
OF
SEGMENTATION
ALGORITHM
Since smartphone applications are dynamically installed and uninstalled by individual devices, the characteristics of the three classes – Class (A) through Class (C) – introduced in the previous section may be captured by assessing the power of each application to stay beyond a certain level of the portion of devices with usage patterns in Group (b), defined in Section 5, consisting of Rising, Stable, Matured, Recovering, and Reactivating. For this purpose, given a typical device having a smartphone application in 𝐴𝐴15, we construct a temporally inhomogeneous Markov chain 𝑁𝑁(𝑘𝑘) on 𝒩𝒩= { (𝑎𝑎), (𝑏𝑏), (𝑐𝑐), (𝑑𝑑)}, where 𝑁𝑁(𝑘𝑘) =𝑒𝑒 ∈ 𝒩𝒩 means that the device is in Group𝑒𝑒 for this application at time 𝑘𝑘, with the state 𝑒𝑒= (𝑑𝑑) representing the usage pattern Null.
In order to analyze the stochastic behavior of 𝑁𝑁(𝑘𝑘), one has to estimate the stochastic matrix A(𝑘𝑘) = [𝑎𝑎𝑖𝑖𝑗𝑗(𝑘𝑘)]𝑖𝑖,𝑗𝑗∈𝒩𝒩 governing 𝑁𝑁(𝑘𝑘), where 𝑎𝑎𝑖𝑖𝑗𝑗(𝑘𝑘) =
𝑃𝑃[𝑁𝑁(𝑘𝑘) =𝑗𝑗 | 𝑁𝑁(𝑘𝑘 −1) =𝐸𝐸 ] for 𝑘𝑘 ∈T= {1, 2,⋯,𝐾𝐾} ∖{1,𝐾𝐾} with 𝐾𝐾= 35 or
𝐾𝐾= 28, describing the number of months in the data period. To determine 𝑎𝑎𝑖𝑖𝑗𝑗(𝑘𝑘), we extract the following statistics from the sequential data for the underlying application. Let 𝐷𝐷15 be the set of devices having at least one application in 𝐴𝐴15 in at least one month in {1, 2,⋯,𝐾𝐾}. For 𝑑𝑑 ∈ 𝐷𝐷15 and 𝑘𝑘 ∈T , let
𝛿𝛿{𝑑𝑑,𝑖𝑖,𝑗𝑗,𝑘𝑘}=
�1 0 𝑃𝑃𝑃𝑃𝐶𝐶𝑃𝑃𝐸𝐸𝑖𝑖𝑑𝑑 𝐸𝐸𝐶𝐶𝐸𝐸𝐸𝐸𝐺𝐺𝐴𝐴𝐸𝐸𝑃𝑃𝐸𝐸(𝐸𝐸) 𝐸𝐸𝐸𝐸𝑚𝑚𝐸𝐸𝐸𝐸𝑡𝑡ℎ𝑘𝑘 −1 𝑎𝑎𝐸𝐸𝑑𝑑𝐸𝐸𝐶𝐶𝐸𝐸𝐸𝐸𝐺𝐺𝐴𝐴𝐸𝐸𝑃𝑃𝐸𝐸(𝑗𝑗) 𝐸𝐸𝐸𝐸𝑚𝑚𝐸𝐸𝐸𝐸𝑡𝑡ℎ𝑘𝑘 ,
and define
𝐸𝐸𝑖𝑖𝑗𝑗(𝑘𝑘) =∑𝑑𝑑∈𝐷𝐷15 𝛿𝛿{𝑑𝑑,𝑖𝑖,𝑗𝑗,𝑘𝑘} ; 𝑁𝑁𝑖𝑖(𝑘𝑘) =∑𝑗𝑗∈𝒩𝒩 𝐸𝐸𝑖𝑖𝑗𝑗(𝑘𝑘) .
One can then construct
𝑎𝑎𝑖𝑖𝑗𝑗(𝑘𝑘) =𝐸𝐸𝑖𝑖𝑗𝑗(𝑘𝑘)⁄𝑁𝑁𝑖𝑖(𝑘𝑘) , 𝐸𝐸,𝑗𝑗 ∈ 𝒩𝒩 .
For classifying smartphone applications into three classes – Class (A) through Class (C) – discussed in Section 5, we examine the first passage time structure of the Markov chain. More specifically, let 𝐺𝐺 and 𝐵𝐵 be two subsets of 𝒩𝒩 satisfying
(6.1) 𝑇𝑇𝐺𝐺→𝐵𝐵= min{ 𝑘𝑘:𝑁𝑁(𝑘𝑘)∈ 𝐵𝐵 |𝑁𝑁(0)∈ 𝐺𝐺 } .
Then, the survival function of 𝑇𝑇𝐺𝐺→𝐵𝐵, denoted by 𝑆𝑆𝐺𝐺→𝐵𝐵(𝑘𝑘) =𝑃𝑃[𝑇𝑇𝐺𝐺→𝐵𝐵>𝑘𝑘] plays an important role in many applications, as is the case here. In what follows, we describe how to evaluate 𝑆𝑆𝐺𝐺→𝐵𝐵(𝑘𝑘) numerically. The reader is referred to Keilson (1979) for further details.
Let 𝑁𝑁∗(𝑘𝑘) be the modified Markov chain on 𝒩𝒩=𝐺𝐺 ∪ 𝐵𝐵 obtained from the original Markov chain 𝑁𝑁(𝑘𝑘) by making all the states in 𝐵𝐵 absorbing. More specifically, let A*(𝑘𝑘) = [𝑎𝑎𝑖𝑖𝑗𝑗∗(𝑘𝑘)]𝑖𝑖,𝑗𝑗∈𝒩𝒩 be defined by
(6.2) A*(𝑘𝑘) = �𝑨𝑨𝟎𝟎𝐺𝐺𝐺𝐺 𝑨𝑨𝐺𝐺𝐵𝐵
𝐵𝐵𝐺𝐺 𝑰𝑰𝐵𝐵𝐵𝐵� ,
where 𝑨𝑨𝐺𝐺𝐺𝐺(𝑘𝑘) = [𝑎𝑎𝑖𝑖𝑗𝑗(𝑘𝑘)]𝑖𝑖,𝑗𝑗∈𝐺𝐺 , 𝑨𝑨𝐺𝐺𝐵𝐵(𝑘𝑘) = [𝑎𝑎𝑖𝑖𝑗𝑗(𝑘𝑘)]𝑖𝑖∈𝐺𝐺,𝑗𝑗∈𝐵𝐵 , 𝟎𝟎𝐵𝐵𝐺𝐺(𝑘𝑘) is the matrix of the size |𝐵𝐵| × |𝐺𝐺| having all elements equal to 0, and 𝑰𝑰𝐵𝐵𝐵𝐵 is the identity matrix of the size |𝐵𝐵|. Here, |𝑋𝑋| denotes the cardinality of the set 𝑋𝑋. Then, 𝑁𝑁∗(𝑘𝑘) is the temporary inhomogeneous Markov chain in discrete time on 𝒩𝒩=𝐺𝐺 ∪ 𝐵𝐵 governed by A*(𝑘𝑘).
Given an initial probability vector 𝒑𝒑𝑇𝑇(0) = [𝒑𝒑𝐺𝐺𝑇𝑇(0),𝟎𝟎𝐵𝐵𝑇𝑇] of 𝑁𝑁(𝑘𝑘), let the initial probability vector of 𝑁𝑁∗(𝑘𝑘) be given by
(6.3) 𝒑𝒑∗𝑇𝑇(0) = [𝒑𝒑𝐺𝐺𝑇𝑇(0),𝟎𝟎𝐵𝐵𝑇𝑇] = 𝒑𝒑𝑇𝑇(0) .
The state probability vector of 𝑁𝑁∗(𝑘𝑘) at time 𝑘𝑘 is then given by
(6.4) 𝒑𝒑∗𝑇𝑇(𝑘𝑘) =𝒑𝒑∗𝑇𝑇(0) 𝑨𝑨∗(1) ×⋯×𝑨𝑨∗(𝑘𝑘) , 𝑘𝑘= 1, 2,⋯ .
From (6.2) through (6.4), it can be readily seen that
(6.5) 𝒑𝒑∗𝑇𝑇(𝑘𝑘) = [𝒑𝒑𝐺𝐺∗𝑇𝑇(𝑘𝑘),𝒑𝒑𝐵𝐵∗𝑇𝑇(𝑘𝑘)] ; 𝒑𝒑𝐺𝐺∗𝑇𝑇(𝑘𝑘) =𝒑𝒑𝐺𝐺𝑇𝑇(0)𝑨𝑨𝐺𝐺𝐺𝐺𝑘𝑘 .
From the definition of 𝑇𝑇𝐺𝐺→𝐵𝐵 in (6.1), one observes that 𝑇𝑇𝐺𝐺→𝐵𝐵>𝑘𝑘 if and only if
𝑁𝑁∗(𝑘𝑘)∈ 𝐺𝐺. Accordingly, it follows that
(6.6) 𝑆𝑆𝐺𝐺→𝐵𝐵(𝑘𝑘) =𝑃𝑃[𝑇𝑇𝐺𝐺→𝐵𝐵>𝑘𝑘] =𝑃𝑃[𝑁𝑁∗(𝑘𝑘)∈ 𝐺𝐺] =𝒑𝒑𝐺𝐺∗𝑇𝑇(𝑘𝑘)𝟏𝟏𝐺𝐺 .
For each application in 𝐴𝐴15, the values of 𝑃𝑃[𝑇𝑇𝑎𝑎→𝑑𝑑>𝑘𝑘], 𝑃𝑃[𝑇𝑇𝑏𝑏→𝑑𝑑 >𝑘𝑘] and
International Journal of Business and Information Table 5
Survival Functions of Applications in 𝑨𝑨𝟏𝟏𝟏𝟏
As for the segmentation criteria for the three classes – Class (A) through Class (C) – by examining Table 5 closely, we define the following.
Class (A): Applications are said to be active in life cycle at the end of the data period, if 𝑃𝑃[𝑇𝑇𝑎𝑎→𝑑𝑑> 10] > 0.5 and 𝑃𝑃[𝑇𝑇𝑏𝑏→𝑑𝑑> 10] > 0.5.
Class (B): Applications are said to be at the tail of the life cycle at the end of the data period if 0.3≤ 𝑃𝑃[𝑇𝑇𝑎𝑎→𝑑𝑑> 10]≤0.5 and 0.3≤
𝑃𝑃[𝑇𝑇𝑏𝑏→𝑑𝑑 > 10]≤0.5.
Class (C): Applications are said to be already diminished at the end of the data period if they do not belong to Class (A) ∪ Class (B).
7.
TESTING
VALIDITY
OF
THE
CRITERIA
FOR
CLASS
(A)
THROUGH
CLASS
(C)
In this section, we demonstrate the validity of the segmentation criteria by applying them to a new set of applications outside 𝐴𝐴15. Specifically, we apply the proposed segmentation criteria to five smartphone applications from other sub-categories; namely, Action, Card, Casino, and Role-Playing. The values of
𝑃𝑃[𝑇𝑇𝑎𝑎→𝑑𝑑 > 10] and 𝑃𝑃[𝑇𝑇𝑏𝑏→𝑑𝑑 > 10] for each of the five applications are then
computed, as shown in Table 6.
k = 10 k = 15 k = 20 k = 25 k = 10 k = 15 k = 20 k = 25 k = 10 k = 15 k = 20 k = 25
Disney TSUM TSUM 0.6 0.4 0.2 0.1 0.6 0.4 0.2 0.1 0.4 0.2 0.1 0.0
LINE Pokopang 0.6 0.2 0.1 0.0 0.6 0.2 0.1 0.0 0.4 0.1 0.0 0.0
LINE cookie Run 0.5 0.1 0.0 0.0 0.5 0.1 0.0 0.0 0.3 0.1 0.0 0.0 Candy Crush Saga 0.4 0.2 0.1 0.0 0.4 0.2 0.1 0.0 0.1 0.0 0.0 0.0 Puzzle & Dragons 0.3 0.1 0.1 0.0 0.4 0.2 0.1 0.0 0.1 0.0 0.0 0.0 LINE Wind Runner 0.3 0.1 0.0 0.0 0.3 0.1 0.0 0.0 0.1 0.0 0.0 0.0
LINE POP 0.3 0.1 0.0 0.0 0.3 0.1 0.1 0.0 0.1 0.0 0.0 0.0
Mushroom Garden Deluxe 0.3 0.1 0.1 0.0 0.4 0.2 0.1 0.0 0.1 0.0 0.0 0.0 LINE Hidden Catch 0.2 0.0 0.0 0.0 0.2 0.1 0.0 0.0 0.0 0.0 0.0 0.0
LINE Jelly 0.2 0.1 0.0 0.0 0.3 0.1 0.0 0.0 0.1 0.0 0.0 0.0
LINE Bubble! 0.2 0.1 0.0 0.0 0.3 0.1 0.1 0.0 0.1 0.0 0.0 0.0
Nyanko Dai Senso 0.2 0.1 0.0 0.0 0.3 0.1 0.0 0.0 0.0 0.0 0.0 0.0 Mushroom Garden Seasons 0.2 0.1 0.0 0.0 0.4 0.2 0.1 0.0 0.1 0.0 0.0 0.0
Temple Run 0.2 0.1 0.0 0.0 0.2 0.1 0.0 0.0 0.0 0.0 0.0 0.0
Mushroom Garden 0.2 0.1 0.0 0.0 0.3 0.1 0.1 0.0 0.0 0.0 0.0 0.0
P[Tc→d > k]
Class (A)
Class (B)
Class (C)
Table 6
Testing Smartphone Applications
By applying the proposed segmentation criteria, we categorize the five smartphone applications into the three classes shown in Table 7.
Table 7
Classes of Testing Smartphone Applications
For each of the applications, the number of devices in Group (a) through Group (c) are plotted in figures 22 through 26 along the horizontal axis, representing the number of months since the introduction of the application into the market. We note that the data period is more than 35 months, except for the applications Monster Strike and LINE Dozer, with 29 and 30 months, respectively.
Figure 22. Monster Strike: Class (A)
Max Min Average
Action Temple Run 2 14135 680 3502 0.2 0.2
Action Monster Strike 13457 1285 5504 0.6 0.6
Card Scratch de Coupon 7923 348 3805 0.4 0.4
Casino LINE Dozer 8105 526 1991 0.3 0.3
Roleplaying Quiz RPG Witch and the Black Cat Wiz 7686 832 3196 0.4 0.5
Application Name
Sub-category No of Devices (per month) P[Ta→d > 10] P[Tb→d > 10]
Application
Class (A) Monster Strike Scratch de Coupon
Quiz RPG Witch and the Black Cat Wiz Temple Run 2
LINE Dozer Class (B)
International Journal of Business and Information Figure 23. Scratch de Coupon: Class (B)
Figure 24. Quiz RPG Witch and the Black Cat Wiz: Class (B)
Figure 26. LINE Dozer: Class (C)
In Figure 22, the number of devices in Group (a) for Monster Strike peaks at month 22, which is shifted to the peak of Group (b) at month 26, with still more than 12,000 devices in Group (a) ∪ Group (b) at the end of the data period, justifying the judgment that Monster Strike belongs in Class (A). For Search de Coupon and Quiz RPG Witch and the Black Cat Wiz in figures 23 and 24, respectively, similar phenomena can be observed but on a much smaller scale, with fewer than 1,000 devices for Search de Coupon and fewer than 3,000 for Quiz RPG Witch and the Black Cat Wiz in Group (a) ∪ Group (b) at the end of the data period. It is then natural to judge that the two applications belong in Class (B). The number of devices in Group (a) ∪ Group (b) at the end of the data period is diminishing in comparison with the corresponding peak value in figures 25 and 26, indicating that both Temple Run 2 and LINE Dozer belong in Class (C). These observations demonstrate the validity of the segmentation criteria proposed in Section 6.
8.
CONCLUDING
REMARKS
International Journal of Business and Information
in life cycle; Class (B), smartphone applications that are at the tail of the life cycle; and Class (C), smartphone applications that are already diminishing. Using the Markov chain approach, we show that the survival function of the first passage time from a set of “good states” to the diminished state can be used to determine the life cycle stage of smartphone applications. Validity of the proposed criteria is tested and verified across different application sub-categories.
REFERENCES
App Brain. (2016). . http://www.appbrain.com/.
Bass, F. (1969). A new product growth for model consumer durables, Management Science15(5), 215–227. https://doi.org/doi:10.1287/mnsc.15.5.215
Buzzell, R. (1966). Competitive behavior and product life cycles, National Conference of the American Marketing Association, Chicago, IL49, 46–67.
Chang, T.; Qi, L.; Enhong, C.; & Hui, X. (2012). Prediction for mobile application usage patterns, Nokia MDC Workshop (Nokia MDC Workshop), 4.
Cox Jr., W.E. (1967). Product life cycles as marketing models, The Journal of Business40(4), 375–384. https://doi.org/10.1086/295003
Day, G.S. (1981). The product life cycle: Analysis and applications issues, Journal of Marketing45(4), 60. https://doi.org/10.2307/1251472
Dean, J. (1950). Pricing policies for new products. Harvard Business Review 1, 28(November-December), 45–54.
Falaki, H.; Mahajan, R.; Kandula, S.; Lymberopoulos, D.; Govindan, R.; et al. (2010). Diversity in smartphone usage, Proceedings of the 8th International Conference on Mobile Systems, Applications, and Services - MobiSys ’10 (2010), 179–195. https://doi.org/10.1145/1814433.1814453
Forrester, J.W. (1959). Advertising: A problem in industrial dynamics, Harvard Business Review37(March-April), 100–111.
Keilson, J. (1979). Markov Chain Models — Rarity and Exponentiality, New York: Springer. https://doi.org/10.1007/978-1-4612-6200-8.
Kleppner, O. (1933). Advertising Procedure (Rev. ed.), New York: Prentice-Hall. Kotler, P., & Keller, K.L. (2012). Marketing Management (14th ed.), Pearson.
Levitt, T. (1965). Exploit the product life cycle, Harvard Business Review43(6), 81–94. https://doi.org/10.2139/ssrn.383242
Liu, X.;Jia, H.; & Guo, C. (2011). Smartphone and tablet application (app) life cycle characterization via Apple app store rank. Scholarwiki.Indiana.Edu. Retrieved from http://scholarwiki.indiana.edu/Z604/Reading/W3/Apple PLoS ONE.pdf
Minh, T.; Do, T.; Blom, J.; & Gatica-Perez, D. (2011). Smartphone usage in the wild : A large-scale analysis of applications and context, ICMI ’11 Proceedings of the 13th
International Conference on Multimodal Interfaces, 353–360. https://doi.org/10.1145/2070481.2070550
Norton, J.A., & Bass, F.M. (1987). A diffusion theory model of adoption and substitution for successive generations of high-technology products, Management Science33(9), 1069–1086. https://doi.org/10.1287/mnsc.33.9.1069
Osland, G.E. (1991). Origins and development of the product life cycle concept,
Scholarship and Professional Work - Business, 68–84.
Perera, U.; Shigeno, M.; Sumita, U.; & Yamamoto, Y. (2017). Development of statistical approach for estimating key competitive performance measures of smartphone applications. In 16th International Conference on Advances in ICT for Emerging
Regions, ICTer 2016 - Conference Proceedings(pp. 266–273). Institute of Electrical and Electronics Engineers Inc. https://doi.org/10.1109/ICTER.2016.7829930 Peres, R.; Mahajan, V.; & Muller, E. (2010). Innovation diffusion and new product growth
models, International Journal of Research in Marketing (pp. 91-106). https://doi.org/10.1016/j.ijresmar.2009.12.012
Polli, R., & Cook, V. (1969). Validity of the product life cycle, Journal of Business42, 385–400. DOI: 10.1086/295215
Rink, D., & Swan, J. (1979). Product life cycle research: A literature review, Journal of Business Research7(3), 219–242. https://doi.org/10.1016/0148-2963(79)90030-4 Tongaonkar, A.; Dai, S.; Nucci, A.; & Song, D. (2013). Understanding mobile app usage
patterns using in-app advertisements, Passive and Active Measurement SE - 7, 7799, 63–72. https://doi.org/10.1007/978-3-642-36516-4_7
International Journal of Business and Information ABOUT THE AUTHORS
Umesha Perera received her Ph.D. in policy and planning sciences from the University of Tsukuba in 2017. She is a post-doctoral researcher in machine learning and deep learning. She has more than seven years of industrial experience as a software engineer. Her research interests are artificial intelligence, operational research, and big data analytics.
Maiko Shigeno is a professor at the University of Tsukuba. In 1996, she received her Ph.D. in science from the Tokyo Institute of Technology. She worked as an assistant professor in the Tokyo Institute of Technology from 1995 to 1997. Her specialized research area is mathematical optimization.