GSJ: Volume 7, Issue 9, September 2019, Online: ISSN 2320-9186
www.globalscientificjournal.com
C
OMPARISON OF
S
HRIMP
C
RACKERS
M
ARKETING
T
ROUGH
O
NLINE
AND
O
FFLINE IN
I
NDRAMAYU
R
EGENCY
Brian Tri Nur Syafaat*, Asep Agus Handaka Suryana**, Achmad Rizal**, and Atikah Nurhayati**
*) Student of Faculty of Fisheries and Marine Science, Padjadjaran University, Bandung – Sumedang KM 21 Jatinangor 45363, Indonesia E-mail: briantrinursyafaat@gmail.com
**) Lecturer at Faculty of Fisheries and Marine Science, Padjadjaran University, Bandung – Sumedang KM 21 Jatinangor 45363, Indonesia
KeyWords
Comparison, Marketing, Online Market, Offline Market, Shrimp Crackers
ABSTRACT
This research aims to analyze the comparison of marketing mix, financial, and efficiency level of marketing channel comparison of shrimp cracker traders through online and offline marketing in Indramayu Regency. The research was conducted from February to August 2019. This research was only conducted at the marketing level. The method used is descriptive qualitative and quantitative, using primary and second-ary data with the snowball sampling method. The analysis used in the form of financial analysis, marketing mix analysis and marketing channel analysis. The result of comparative marketing mix research from online and offline shrimp cracker traders, shows that online is su-perior in terms of place, promotion and personnel, while offline is susu-perior in terms of product and price. The average sales are 130 units online and 2100 units offline per month, while the price is online traders Rp 13.000/250gr or Rp 52.000/kg and offline traders Rp 12.000/250gr or Rp 48.000/kg. Financial comparisons can be seen that, offline is superior to all aspects of online. The comparative efficiency level of marketing channels can be seen that, this shrimp cracker marketing agency has 3 marketing channels, offline channels I, offline II, and online with each channel has been efficient because the farmer's share is still greater than the marketing margin. The best level of effi-ciency of marketing channels is in the offline channel II with 100% farmer's share.
ISSN 2320-9186
INTRODUCTION
Crackers are crispy food in the form of thin sheets made from a mixture of several herbs and starch / tapioca ingredients as the main ingredients. Crackers have varied flavors, shapes, and colors so that they are liked by the public, thus crackers have a fairly broad market share and have the potential to be developed (Suryani et al 2005). The types of crackers on the market are very diverse, both in taste and raw materials. Shrimp or fish crackers are dried food products derived from raw materials of shrimp and fish mixed with tapioca flour or flour (Pane 2008). Making shrimp crackers in addition to increasing the shelf life of shrimp is also one way to add variety to cracker products. Shrimp are also animals that contain very high protein so that they are very much needed by humans. Shrimp crackers can be an alternative choice for people who do not like the consumption of direct shrimp.
Shrimp crackers have several qualities depending on the composition of the number of shrimps contained in the crackers. The more shrimp contained in crackers the better the quality. Crackers are made with basic ingredients of tapioca flour or wheat flour, even cassava can be used to make shrimp crackers. The basic ingredients are added a number of fresh shrimp or dried shrimp and season-ings such as garlic, onion, salt, sugar, water and canister. The making of shrimp crackers uses the main ingredient of tapioca flour, while other additional ingredients are shrimp, eggs / milk, salt, sugar, water, and seasonings (garlic, onion, coriander, etc.) which are varied. The making of shrimp crackers is commonly found in Indramayu Regency.
Indramayu Regency is a district in the province of West Java, Indonesia. Indramayu is bordered by the Java Sea in the north, Cirebon Regency, Majalengka Regency, Sumedang Regency, and Subang Regency. Indramayu is located on the north coast of West Java, which is famous for producing sea fish. Indramayu is also well-known as a place for fish and shrimp crackers producers in the Center for the Snack Food Industry in Kenanga Village, Sindang District. In the area there are around 35 cracker factories and there are also more than 20 fish and shrimp cracker home industries. There are also many retailers there, they sell crackers from the production of facto-ries and home industfacto-ries.
Shrimp cracker marketing from retail traders in Indramayu is still mostly done through offline marketing. This is very unfortunate because of the increasingly rapid progress in the field of information and communication technology, has more or less changed the pattern of marketing strategies adopted by some retail traders via the internet. Before the advent of the internet, retailers imple-mented marketing strategies manually or met directly with consumers and were also very limited. Marketing style with conventional models like that, when applied at this time is usually referred to as offline marketing, but with the emergence of internet networks, the pattern of marketing strategies adopted by the company becomes massive and very large. The marketing model is called online marketing. Some retailers use only one marketing strategy that is offline marketing or online marketing in order to market their products. Some other retailers use both marketing strategies simultaneously.
Based on the description above it can be concluded that some retail traders at this time have done a lot of marketing of shrimp cracker products through online. Although there are still some retailers who market shrimp cracker products offline. Therefore re-search is needed regarding the comparison of marketing efficiency levels of online and offline stores in the marketing of shrimp cracker products. This research will use measurement tools in the form of marketing mix analysis (place, price, people, promotion, and product), financial analysis, and analysis of marketing channels as a comparison tool to determine the level of marketing effi-ciency of shrimp cracker retailers doing marketing through online media and offline.
MATERIALANDMETHODS
Place and Time
This research was conducted in Indramayu Regency, West Java Province from February to August 2019. This research consisted of several stages, namely the preparation of proposals, data collection, data processing, and report preparation. This research is only conducted at the marketing level of shrimp crackers.
Research Method
The method used in this research is the survey method. The survey will be conducted to shrimp cracker retailers in the city of In-dramayu, West Java Province by collecting primary and secondary data. Survey method is a form of research technique that collects information from a number of samples in the form of people, through questions. This research might use a comparative approach. Comparative research is a comparative study. The subject of this research is comparing the marketing efficiency of shrimp cracker traders who do marketing through online media channels and offline channels. The specific phases of this research range from mar-keting mix analysis, financial analysis to marmar-keting channel analysis.
International Journal of Advancements in Research & Technology, Volume 1, Issue 5, October-2012 ISSN 2278-7763
The type of data used in this research is sourced from primary data and secondary data. Primary data is data obtained directly from the first source, namely individuals or individuals who need further management such as the results of interviews or the results of questionnaires (Wandansari 2013). Primary data in this research were obtained directly from observations and direct records in the field (observation). The data is obtained from interviews with respondents and uses the media, namely a list of questions (question-naire). Respondents consisted of a group of shrimp cracker retailers doing offline marketing and a group of shrimp cracker retailers doing marketing through online media. Whereas secondary data is primary data that has been further processed and presented properly by primary data collectors or other parties (Wandansari 2013). Secondary data were obtained from government or private institutions, the results of previous studies, libraries, and related literature.
Data Analysis Method
a. Marketing Strategy Analysis
Kotler and Armstrong (2001) define the marketing mix as a set of tactical and controlled marketing tools that are integrated by companies to produce the responses desired by the target market. Used to measure products, prices, promotions, locations, employees / hrsp about shrimp cracker traders who market them offline and online. The marketing mix elements are product, price, people, place, and promotion.
b. Finansial Analysis
- Revenue
The amount of revenue obtained from each marketing channel can be determined through analysis using business rev-enue analysis. According to Soekartawi (2006), operating income is the difference between revrev-enue and all costs. This can be stated in the following formula:
π = TR-TC
Information:
π = Revenue (Rp)
TR =Total Revenue(Rp)
TC = Total Cost (Rp)
With the following business criteria:
If TR> TC, then the business is said to be profitable
If TR = TC, the operating costs are said to be profit and no loss If TR <TC, then the business is said to be a loss
- Revenue Cost Ratio (R/C Ratio)
R / C Ratio analysis is a comparison between total income and total cost or total production costs, if formulated as fol-lows (Khairuman 2007):
R/C Ratio = TR/TC Information:
R / C Ratio = Feasibility Ratio TR = Total Revenue (Rp) TC = Total Cost (Rp)
If the R / C Ratio value is greater than one it means that the business has experienced profits and if it is smaller than one it means that it has not yet gained profit so it still needs improvement (Sudrajat 2008). R / C Ratio = 1 means (cash in-flow) cash inflows equal to (cash outin-flow) cash outflows.
- Payback Priode
The payback period method is a method that calculates how quickly an investment can be made back. The faster the re-turn on investment costs of a business, the better the business is because the smoother the capital re-turnover. PP is calculat-ed from the ratio between total investment and the profits obtaincalculat-ed. PP is formulatcalculat-ed as follows:
𝑷𝒂𝒚 𝒃𝒂𝒄𝒌 𝑷𝒆𝒓𝒊𝒐𝒅 =𝑻𝒐𝒕𝒂𝒍 𝑰𝒏𝒗𝒆𝒔𝒕𝒎𝒆𝒏𝒕
𝒑𝒓𝒐𝒇𝒊𝒕 𝒙 𝟏 𝒚𝒆𝒂𝒓
Information:
Faster return period = feasible
ISSN 2320-9186
Longer return period = inappropriate
If the investment project proposal is more than one, then a faster return period is chosen.
- Break Event Point (BEP)
Break even point is a break even point where total revenue = total cost. The longer a company becomes an im-fitting point, the greater the loss balance because the profits received still cover the costs incurred. The Break Even Point (BEP) value can be interpreted as the amount that must be produced so that the business reaches a point of not profit and no loss (Khairuman 2007). Calculation of Break Even Point (BEP) can be stated with the following formula:
𝑩𝑬𝑷 𝒑𝒓𝒐𝒅𝒖𝒄𝒕𝒊𝒐𝒏 𝒗𝒐𝒍𝒖𝒎𝒆 = 𝑻𝒐𝒕𝒂𝒍 𝑶𝒑𝒆𝒓𝒂𝒕𝒊𝒐𝒏𝒂𝒍 𝑪𝒐𝒔𝒕 𝑷𝒓𝒊𝒄𝒆 𝒐𝒇 𝑷𝒓𝒐𝒇𝒊𝒕 𝑷𝒆𝒓 𝑼𝒏𝒊𝒕
c. Marketing Channel Analysis
- Marketing Channel
Marketing chain or marketing channel is a distributor or distributor who has activities to distribute or deliver shrimp crackers from producers to end consumers. Marketing channels have the task of channeling goods from producers to con-sumers that address three important levels of time, space and thought (Kotler 2005).
- Marketing Margin
Marketing margin is the difference in the price of shrimp crackers at the consumer level with prices at the producer lev-el. The difference in price or marketing margin is due to the profits taken by marketing institutions and the costs incurred in marketing shrimp crackers. Margin can be expressed as a payment given to them for their services. The marketing margin is systematically formulated as follows:
Mp = Pr – Pf
Information:
Mp = Margin of shrimp cracker marketing (Rp / unit)
Pr = Price of shrimp crackers at the consumer level (Rp / unit) Pf = Price of shrimp crackers at producer level (Rp / unit)
- Farmer’s Share
The higher the percentage of farmer's share received by producers, the more efficient marketing activities are carried out and conversely the lower the percentage of farmer’s share received by farmers, the lower the efficiency level of a mar-keting (Rosmawati 2011). Farmer's share can be calculated using the following formula:
FS = Hp/Hk x 100%
Information: FS = Farmer's share
HP = Price at producer level (Rp / unit) HK = Price at the consumer level (Rp / unit)
- Market Share
Market share (Market Share) can be interpreted as part of the market controlled by a company, or the percentage of a company's sales to the total sales of its biggest competitors at a certain time and place. Market share can be calculated us-ing the followus-ing formula:
Marketing Selling Price
Total Marketing Selling Pricex 100%
RESULTANDDISUSSION
Marketing Strategy
a. Product
International Journal of Advancements in Research & Technology, Volume 1, Issue 5, October-2012 ISSN 2278-7763
- Products sold vary
- Average sales of 130 units per month - Not too many enthusiasts yet. - Buy at least 1 bal
- Average Experience is fairly new - Most consumers come from out of town
Offline
- Products sold vary
- Average sales of 2,100 units per month - There have been many enthusiasts - There is no minimum purchase - The average experience is fairly long
- most consumer come from Indramayu district
b. Price
Online
- Affordable prices
- More expensive than offline - Price of IDR 13,000 per unit
- Average income of Rp 520,000 a month - Payment methods via transfer
- Average income cannot meet daily expenses or side income
Offline
- Affordable prices - Cheaper than online
- the price of Rp 12,000 per unit - The average income of Rp 5,280,000 - Payment methods via cash
- Average income can meet daily expenses or main income
c. Place
Online
- Does not require a large place to store goods - No need to rent or buy a place of sale
- Consumers can only see products from the pictures - Shop search is fairly easy
Offline
- Requires a large place to store goods - Need to rent or buy a place of sale
- Consumers can immediately see and feel the product - Shop search is fairly easy
d. Promotion
Online
- Promotion of using advertising services on the internet - Discount on holidays
- Price promotion
- Faster, easier and cheaper
Offline
- Word of mouth promotion - Discount on holidays - Price promotion
- Longer, more difficult, and more expensive
e. People
Online
ISSN 2320-9186
- Average does not use employees
- Has a good level of hospitality and fast response
Offline
- Some people use employees and some don't
- Has a good level of friendliness but is not always responsive because it serves many other consumers
Financial Analysis
a. Income
Table 1. Average Earnings of Shrimp Cracker Traders per Month
No. Description Offline (Rp) Online (Rp)
1. Total Revenue 5.280.000 520.000
2. Total Operational Cost 1.651.650 91.300
3. Total Income 3.638.350 428.700
The average income value of shrimp cracker traders can be concluded that the average income obtained from marketing of shrimp crackers offline and online for one month is 3,638,350 and Rp 428,700. This income was obtained from the difference in the total cost of receiving shrimp cracker traders offline and online for one month amounting to Rp 5,280,000 and Rp 520,000, less total operational costs for one month amounting to Rp 1,651,650 and Rp 91,300.
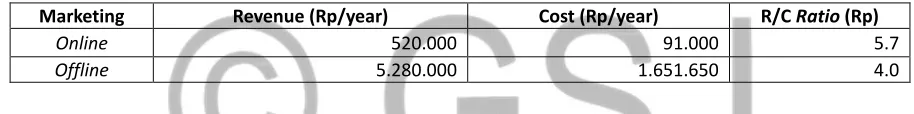
b. R/C Ratio
Table 2. R / C Ratio Value of Shrimp Crackers Retailers Offline and Online in Indramayu Regency
Marketing Revenue (Rp/year) Cost (Rp/year) R/C Ratio (Rp)
Online 520.000 91.000 5.7
Offline 5.280.000 1.651.650 4.0
Based on the above calculation, it can be stated that shrimp cracker traders who do online marketing in Indramayu Re-gency in one year have an R / C Ratio of 5.7. This value implies that each cost incurred Rp. 1, - will receive revenue of Rp. 5.7. If the value of R / C Ratio is more than one, it means that shrimp cracker traders who do online marketing experience profits and are feasible to run. While offline marketing has an R / C Ratio of 4.0. This value implies that each cost incurred Rp. 1, - will re-ceive Rp. 4.0. If the value of R / C Ratio is more than one, it means that shrimp cracker traders who do online marketing experi-ence profits and are feasible to run.
c. Payback Periode (PP)
Table 3. Payback Period Period of Shrimp Crackers Retailers Offline and Online in Indramayu Regency.
Marketing Investasi (Rp) Profit (Rp/year) PP/Year PP/Month
Online 3,563,600 5,144,400 0,74 8,9
Offline 11,785,000 43,540,200 0,27 3,3
The period payback value of shrimp cracker traders who do online marketing is 0.74, which means that capital from this business can return within 0.74 years or 8.9 months. The PP value of the shrimp cracker trader doing offline marketing is 0.27, which means that the capital from this business can be returned within 0.27 years or 3.3 months.
d. Break Event Point (BEP)
Table 4. Average BEP Value of Shrimp Crackers Trader Volume
Marketing BEP Volume
Online 23 pcs/month
International Journal of Advancements in Research & Technology, Volume 1, Issue 5, October-2012 ISSN 2278-7763
Value of BEP Marketing volume of online shrimp cracker traders in Table 4. shows the average value of BEP production volume for one month is 23 units. This states that the online marketing of shrimp cracker traders does not experience profits or losses and is at the break even point if it is successful in selling as many as 23 pieces of shrimp crackers for one month. Where-as the offline marketing shows the average value of BEP production volume for one month is 531 units. This states that the marketing of offline shrimp cracker traders does not experience profit or loss and is at the break even point if it succeeds in selling as many as 531 shrimp crackers for one month.
Marketing Channel Analysis
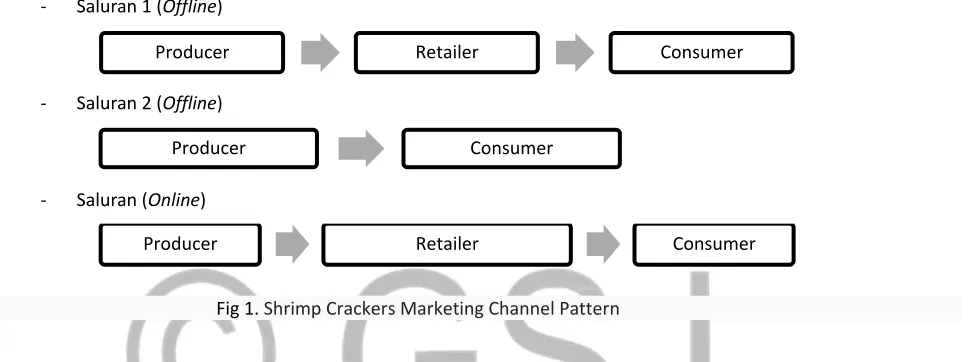
a. Marketing Channel Shrimp Cracker
The shrimp cracker marketing channel involves several marketing agencies. There are 2 channels for offline shrimp cracker retailers and 1 channel for online shrimp cracker retailers, namely:
- Saluran 1 (Offline)
- Saluran 2 (Offline)
- Saluran (Online)
Fig 1. Shrimp Crackers Marketing Channel Pattern
Following are the roles of marketing channels and the functions of shrimp cracker marketing channels involved in the sales percentage:
- Producer
Producers carry out the exchange function, that is, sales only and physical functions in the form of transportation when sending goods to retail traders. The role of producers in marketing in addition to selling their goods directly to end consum-ers without intermediaries, producconsum-ers are also tasked with channeling to marketing institutions such as retail tradconsum-ers to get to end consumers.
- Retail Merchants (Offline)
Retailers perform marketing functions in the form of exchanges, namely buying and selling. Physical functions such as transportation are borne by producers because retail traders are still in Indramayu district and producers will come every month to retail traders.
- Retailers (Online)
Retailers perform marketing functions in the form of exchanges, namely buying and selling. Physical functions such as transportation (transportation) in the form of shipping costs are borne by consumers because retailers are only tasked to buy from producers and resell them through online marketing. Consumers residing outside of Indramayu regency, there-fore the need for shipping services to get to their respective cities.
b. Margin Marketing
Table 5. Marketing Margin and Farmer share Shrimp Cracker
Marketing Agency Offline Channel I
(Rp/250 gram)
Offline Channel II (Rp/250 gram)
Online Channel (Rp/250 gram)
Producer - - -
Selling Price 9,000 12,000 9,000
Producer Retailer Consumer
Producer Consumer
Producer Retailer Consumer
ISSN 2320-9186
Margin - - -
Retailer - - -
Purchase Price 9,000 - 9,000
Selling Price 12,000 - 13,000
Margin 3,000 - 4,000
Consumer - - -
Purchase Price 12000 12,000 13,000
Total Margin 3,000 0 4,000
Farmer Share 75% 100% 69%
Margin Share 25% 0% 31%
Marketing margins as the value of the services of carrying out marketing activities from the producer level to the end con-sumer level (Limbong and Canggabean 1985). Based on Table 15. the biggest marketing margin is in online channel , with a to-tal margin of Rp 4,000 per pcs with a 25% share margin. The second position is in the offline channel I with a toto-tal margin of Rp 3,000 per pcs with a 25% share margin. The third position is in the offline channel II with a total margin of IDR 0 per pcs with a margin share of 0%.
Farmer's share or Fisherman share is another indicator used to compare prices received by producers compared with prices paid by end consumers expressed in percentages. Based on Table 15. it is known that overall marketing of shrimp crackers is marketed through 3 marketing channels which are said to be efficient. This can be seen from the third percentage of marketing channels in the offline channel I by 75%, offline channel II 100% and in the online channel by 69%. The offline channel II 100% looks the most efficient because this channel is a direct channel from producers to consumers without going through interme-diaries so that producers get a profit of 100%.
c. Market Share
Table 6. Market Share Shrimp Cracker
Market Players Component Offline channel I Offline channel II Online channel
Producer Selling Price (Rp/Kg) 9000 12000 9000
MS (%) 43% 100% 41%
Retailer Selling Price (Rp/Kg) 12000 13000
MS (%) 57% 0% 59%
Consumer Selling Price (Rp/Kg) - - -
MS (%) - - -
Market share of shrimp cracker marketing channel obtained based on the calculation in Table 16. of each marketing chan-nel has a different market share value. The largest market share value of 100% is in the offline chanchan-nel II with marketing ac-tors, namely producers. The smallest market share value is on the online channel I, namely producers with a 41% market share value.
d. Efficiency of Marketing Channel
Table 7. Comparison of Farmer's Share and Shrimp Cracker Marketing Margin
No. Marketing Channel Farmer’s Share (%) Marketing Margin (%) Information
1. (Offline) I 75% 25% FS>MP
2. (Offline) II 100% 0 FS
3. (Online) 69% 31% FS>MP
International Journal of Advancements in Research & Technology, Volume 1, Issue 5, October-2012 ISSN 2278-7763
their products. The disadvantage of direct sales without intermediaries is that the costs are greater and the promotion area is narrower so that the reachability of meeting new customers is less.
The efficiency of marketing channels can also be influenced by the marketing chain. Long marketing chains can be ineffi-cient. This causes too much marketing profit taken by marketing actors (Prasetyo 2003). Because more and more marketing in-stitutions are involved, marketing costs will be greater and prices will increase, of course marketing margins will also be greater than Farmer's share.
CONCLUSION
Based on the results of a comparative study of marketing of shrimp crackers through online and offline in Indramayu take some con-clusions as follows:
1. Comparison of the marketing mix of online and offline shrimp cracker traders using marketing mix analysis shows that online is superior in terms of place, promotion, and personnel. Whereas offline is superior in terms of product and price aspects. The average sales are 130 units online and 2100 units offline per month, while the price is online traders Rp 13.000/250gr or Rp 52.000/kg and offline traders Rp 12.000/250gr or Rp 48.000/kg. Furthermore, financial comparisons using financial analysis note that offline is superior to all aspects than online.
2. The efficiency level of marketing channel comparison by using marketing channel analysis is that the shrimp cracker marketing agency has 3 marketing channels, offline channels I, offline II, and online with each channel being efficient because the farmer's share is still greater than marketing margin. The best level of efficiency of marketing channels is in the offline channel II with 100% farmer's share.
REFERENCES
[1]Khairuman. 2007. Budidaya Patin Super. Agromedia Pustaka. Jakarta.
[2]Kotler, P. dan Amstrong G. 2001. Prinsip-prinsip Pemasaran. Jilid 2 . Edisi 8. Jakarta (ID): Erlangga, 510 hlm.
[3]Kotler, P. 2005. Manajemen Pemasaran. Jilid I dan II. PT. Indeks. Jakarta.
[4] Pane, A. 2008. Forrtifikasi Tepung Cangkang Rajungan Terhadap Beberapa Karakteristik Kerupuk. Skripsi. Fakultas Perikanan dan Ilmu
Kelautan Universitas Padjajaran. Jatinangor
[5]Prasetyo,Edy dan Mukson. (2003). Kajian Pemasaran Produk Pangan Olahan di Beberapa Kabupaten di Jawa Tengah. Program Studi
Sosial Ekonomi Peternakan. Fakultas Peternakan. Universitas Diponogoro.
[6] Suryani, A., E. Hambali, dan E. Hidayat. 2005. Aneka Produk Olahan Limbah Ikan dan Udang. Penebar swadaya. Jakarta.
[7] Sudrajat, A. 2008. Budidaya 23 komoditas laut menguntungkan. Penebar Swadaya. Jakarta. 171 hlm.
[8] Wandansari, N. D. 2013. Perlakuan Akuntansi Atas PPH Pasal 21 Pada PT. Artha Prima Finance Kotamobagu. Jurnal EMBA. 1 (3) : 558-566.
ISSN 2320-9186