EAI Endorsed Transactions
on
Cognitive
Communications
Research Article
Detecting Multi-Channel Wireless Microphone User
Emulation Attacks in White Space with Noise
Dan Shan, Kai Zeng
∗, Weidong Xiang, Paul Richardson
4901 Evergreen Rd, Dearborn, MI, USA, 48092
Abstract
Cognitive radio networks (CRNs) are susceptible to primary user emulation (PUE) attacks. Conventional PUE attack detection approaches consider television broadcasting as the primary user. In this work, however, we study a special kind of PUE attack named wireless microphone user emulation (WMUE) attack. Existing work on WMUE attack detection deals with single channel senario. Although multi-channel WM (MCWM) systems are common, detecting WMUE attacks under a multi-channel setting in noisy environments has not been well studied. In this work, we propose a novel multi-channel WMUE attack detection scheme which operates in low signal-to-noise ratio (SNR) environments with low computational complexity, thanks to the first 1.5-bit FM demodulator whose outputs are represented by only 0, 1 and -1. Experimental results show that, the proposed
scheme can effectively detect multi-channel WMUE attacks within 0.25 second when SNR is lower than 6 dB.
Received on 20 May 2013; accepted on 12 June 2013; published on 14 July 2014
Keywords: CRN, WMUE, MCWM, FM demodulator
Copyright © 2014 D. Shan et al., licensed to ICST. This is an open access article distributed under the terms of the Creative Commons Attribution license (http://creativecommons.org/licenses/by/3.0/), which permits unlimited use, distribution and reproduction in any medium so long as the original work is properly cited.
doi:10.4108/cogcom.1.1.e4
1. Introduction
Cognitive radio (CR) enables secondary users (SUs) to share the spectrum temporarily unused by primary users (PUs). To open the door for this new technique and enhance the spectrum efficiency, regulators in many countries have issued permission for radio frequency (RF) transmissions for license-exempt users on part of television (TV) bands, known as white space. The wireless devices that are carried by SUs and operate on white space are called white space devices (WSDs).
WSDs perform spectrum sensing on white space to avoid collisions to the signals from PUs (incumbent signals), mainly including TV signals and wireless microphone (WM) signals. Many spectrum sensing techniques are proposed to detect these two types of incumbent signals [3,8,12,16,20]. When PUs emerge, SUs are required to evacuate from the spectrum in order to avoid interference to PUs. Exploiting this policy adversely, an attacker may block all SUs within an area by emulating the signal of a certain PU. This kind of attack is named primary user emulation (PUE) attack [4].
∗
Corresponding author. Email:[email protected]
Over the years, tremendous efforts have been expended in the area of PUE attack detection. By evaluating the received signal’s coverage area, one can differentiate between the signal from a PUE attacker and the real TV signal [4,22]. However, these detection techniques do not apply to the attack that emulates WM signals (named WM user emulation attack, or WMUE attack), because WM signals may be transmitted from anywhere. Moreover, WMUE attacks may be launched on a frequency band where no WM system has ever worked on; as a result, one cannot detect these attacks by comparing their channel-specific features with the features contained in real WM signals [14]. In short, detecting a WMUE attack is not easy, while launching a WMUE attack is as simple as building a cheap FM modulator.
Existing work detects WMUE attacks in a single-channel system by comparing the FM signal with the audio signal acquired simultaneously [5]. Since a WMUE attacker wants to abuse the white space and meanwhile hide himself, he is not willing to generate any audio signals correlated with the FM signal(s) he transmits, and this fact leads to low similarity between the FM signal and audio signal around the WM system.
EAI
European Alliancefor Innovation 1
Although multi-channel WM (MCWM) systems are are common, PUE attacks in these systems are rarely studied, leaving several open challenges. Firstly, multiple WM users in the same MCWM system may speak simultaneously. This situation frequently happens; for examples, multiple performers sing a song at the same time on a stage, or several invited speakers on a conference are having a heated discussion with many overlapped talks. Then the audio signals on different channels interfere each other, and the relationship between the mixed audio signal and the FM signals on multiple audio channels become more complicate. Secondly, the audio signal and FM signals are further contaminated by both acoustic noises and RF noises (we use the term “noise” to represent both thermal noise and interferences coming from other systems, but not including interferences coming from other audio channels in the same MCWM system). Thirdly, some WSDs have only one receiver branch and may monitor the FM signal only on one audio channel. As a result, RF signals on different audio channels may not be observed simultaneously.
An intuitive idea to solve these challenges is to check the cross-correlation between a demodulated FM signal and the audio signal acquired simultaneously. Since a WM user’s speech is uncorrelated with noises and other users’ speeches, interferences from other channels and noises can be resisted by a cross-correlator effectively. However, two issues remain: (1) this solution requires a FM demodulator which only works in high signal-to-noise ratio (SNR) conditions; (2) a cross-correlator conducts massive multiplications and has very high computation complexity. These issues are tackled by a major contribution in this work: a 1.5-bit FM receiver, which maps the FM signal to a piece of acoustic signal whose amplitude is represented by 0, 1 or -1. This is not only the first 1.5-bit FM receiver, but also the first FM receiver that works effectively when SNR is as low as -3 dB. This novelty not only lowers the complexity and SNR requirement of a FM demodulation, but also significantly reduces the complexity of a cross-correlator, since massive multiplications are eliminated by the simple coefficients 0 and ±1. The 1.5-bit
FM receiver results in a cross-correlator with three-level quantization, which is the optimal quantization that processes the least information with the given quantization error [7].
We evaluate the performance of the proposed 1.5-bit FM demodulator by simulations, and evaluate the performance of the whole detection scheme in a real-world testing environment, which includes an off-the-shelf MCWM system and a WSD prototype. Based on the waveforms acquired in this real-world testing environment, we derive the detection rateβand false alarm rate α of the proposed detection scheme. Experiment results show that, the proposed scheme
requires only -3 to 0 dB SNR when two audio channels are used, and requires about 5-6 dB SNR when four audio channels are used, with the performance that
β >0.9 and α <0.1. The detection time is as low as a
quarter second.
Our contributions are summarized as follows:
• We propose a cross-correlation based WMUE attack detection scheme with the ability to resist noises and interferences in MCWM systems;
• We propose the first 1.5-bit FM demodulator which enjoys low complexity and simplifies the cross-correlator, and evaluate its performance by both theoretical analysis and computer based simulations;
• We design a hardware based prototype and val-idate the performance of the proposed detection scheme in a real-world environment.
Throughout the paper, “acoustical signal” and “audio signal” are synonymous. We use the terms “wireless channel” and “acoustic channel” to represent the channels experienced by RF signal and sound, respectively. All SNR’s in this work are measured over the effective bandwidth of a FM signal which is at the level of 50 KHz, while those in some other works are measured over the entire 6MHz TV band [3,8,20]. The -3 dB SNR in this work is equivalent to -23.4 dB in those works, and is close to the limitation of those FM signal detection schemes.
2. Related Works
Various methods are proposed to detect PUE attacks. Among them, localization based methods draw much attention, with the basic principle that the location of some incumbent signal transmitters, for example, the TV towers, are preknown and hard to be emulated. By localizing the transmitter using received signal strength (RSS), one can differentiate between legitimate users and PUE attackers [4, 22]. Alternatively, PUE attacks may be detected through the fact that, the channel characteristics at different users are different and hard to be altered [6, 14]. Although this method is able to differentiate between different users, it cannot tell which user is the attacker. In other words, additional information about the legitimate user, like location or channel state information (CSI), are also required. All these methods cannot detect WMUE attacks, since both the locations and CSIs of MCWM users are hard to acquire.
The algorithm proposed in [5] detects the WMUE attacks by correlating the acoustic signal with the RF signal acquired simultaneously, and this principle is also adopted in this work. However, the work in [5] only considers the single-channel WM system, while
EAI
European Alliancefor Innovation 2
this work covers both single-channel and multi-channel cases.
Authors in [2] propose a cooperative spectrum sensing scheme that maximizes the detection rate when PUE attacks exist. Moreover, a frequency hopping strategy is proposed in [13] to combat with PUE attacks under a game-theoretic model. These works are devoted to alleviating PUE attacks, rather than detecting PUE attacks.
Several all-digital FM receivers are proposed in [11,
15, 19], and all of them ignore noises. A FM receiver that works when SNR is as low as -3 dB is not found in the literature. Moreover, no 1.5-bit FM demodulator is found in the existing literature to detect WMUE attacks. In this work, a low-precision FM demodulator can significantly reduce the computation complexity, and is studied for the first time.
The design of multiplierless cross-correlators is dis-cussed in [21], while design considerations and per-formance evaluation for the complex cross-correlator with three-level quantization are presented in [7]. These works guide us to the idea of 1.5-bit data precision; however, the main focus of this work is to detect PUE attacks, while the multiplierless cross-correlators is only part of the whole scheme.
Some preliminary results of this work are presented in [18]. In this paper, we add more technical details and evaluate the performance of the proposed FM demodulator in noisy environments through both theoretical analysis and simulations. Moreover, detecting threshold of the proposed WMUE attack detector is also discussed.
3. System Model
3.1. System Setup
A MCWM system is surrounded by a set of WSDs, as shown in figure 1. This MCWM system is composed of M audio transmitters (WMs) where M ≥1, one
MCWM receiver and one loudspeaker. The audio signals acquired by different WMs are modulated on different wireless channels, and are all received by the MCWM receiver and mixed together. We denote the audio signal and FM signal at the mth WM as
am(t) and sm(t), respectively. Then the audio signal
outputaT(t) at the MCWM receiver equals to PM
m=1 am(t),
which is further amplified by the loudspeaker and overcast all acoustic signals generated by WM users. The WSD is able to acquire (some of) the FM signals
sm(t), as well as acoustic signal a(t) which contains
aT(t), its reverberations and acoustic noises. The central
frequency ofsm(t) is denoted asfm.
MCWM System
Scenario 1
Scenario 2
Scenario 3 WSD
WSD
WSD
FM signal strength Audio signal strength
Acoustic Sensor
Attacker
Figure 1. The system model and three scenarios considered in
this paper. Scenarios differ from each other in the qualities of FM signals and acoustic signals.
According to [3], the FM signal can be modelled by
sm(t) =ACcos
"
2πfmt+ 2π∆f
Zt
0
am(t)dt+θ
# (1)
whereACand∆f control the amplitude and bandwidth
of this FM signal, respectively, and θ represents a random phase with uniform distribution over [0,2π].
We consider that the quality of acoustic signal a(t) drops much faster than the qualities of sm(t), when
the propagation distance d increases. The reasons are twofold. Firstly, acoustic signals are more easily being blocked by obstacles like buildings, compared with FM signals operating on very high frequency (VHF) and ultra high frequency (UHF) bands. According to the measurement results in [9], FM signals may have more than 30 dB SNR when d= 500m, while effective ranges of the acoustic signals from most MCWM systems are less than 100m. Secondly, the sources of RF interference are much less than the sources of acoustic interferences, since different wireless systems operate on different frequency bands, while many types of acoustic interferences collide with human speeches in both time-domain and frequency-domain.
According to the propagation models above, we define three operating scenarios:
• Scenario 1: d <20m, so both sm(t) and a(t) are
noise-free;
• Scenario 2: 20m < d <200m, sosm(t) is noise-free,
buta(t) is noisy;
• Scenario 3:d >200m, so sm(t) is noisy, but
high-qualitya(t) is acquired by the sensor close to the
EAI
European Alliancefor Innovation 3 EAI Endorsed Transactions on
MCWM system and sent to the WSD through infrastructure.
These three scenarios are also illustrated in figure1. Our proposed WMUE attack detection algorithm covers all these three scenarios. For each scenario, we will focus on one WSD in the following analysis.
We assume that the power ofsm(t) is above the noise
floor at each WSD in all scenarios, so that fm can be
estimated by the WSD [8]. Since fm can only be a
multiple of 25 kHz [10], the WSD is able to adjust its estimates onfm according to this rule. As a result, the
WSD knows exact values offmform= 1, ..., M.
3.2. Attacker Model
An attacker emulates the MCWM system by trans-mitting FM signals on one or multiple channels used by the legitimate MCWM system. These emulated FM signals and the FM signals transmitted by WMs are indistinguishable in terms of the modulation scheme and transmission power.
The attacker is not willing to convert the demod-ulated FM signal to audio signal and send it to the loudspeaker, since such audio signal would be very strange and expose the attacker directly, unless the orig-inal data transmitted by the attacker is just a piece of analogue audio signal (the exceptional case). Therefore, we consider that the attacker does not generate any audio signal, or generates audio signal that is not corre-lated to the FM signal. We consider that the “attacker” in the exceptional case is actually a legitimate WM system which may use the spectrum legally. We assume that the attacker has the ability to sense the spectrum and avoids collisions with existing MCWM systems. Therefore, there is one and only one source ofsm(t).
3.3. The Detection Problem
The detection problem we study here is defined as the task to identify the source (either the MCWM system or the attacker) ofsm(t), given a set ofa(t) andsm(t). It can
be modelled as a hypothesis test:
• H0:sm(t) is generated by the MCWM system;
• H1:sm(t) is generated by the WMUE attacker.
H0andH1are called null hypothesis and alternative
hypothesis, respectively.
4. The WMUE Attack Detection Scheme
The proposed WMUE attack detection scheme is based on the principle that, the acoustic signal and FM signals coming from the MCWM system correlate to each other, while those coming from the WMUE attacker do not. Then by evaluating the cross-correlation between the demodulated FM signal on a specific wireless channel
and the acoustic signal, one can distinguish between a MCWM user and a WMUE attacker.
Basic procedures of the proposed scheme are shown in figure2. The WSD first searches any FM-like signal on the frequency band interested. Once detecting a signal, it records the RF signalsm(t) and acoustic signal
a(t) simultaneously. Then it down-converts sm(t) to an
intermediate frequency (IF) signalsm(IF)(t), and feeds the
latter one into a low-complexity FM demodulator. In other words, a superheterodyne receiver is considered here. Finally, the scheme computes the peak valueXof the cross-correlation between the demodulated signal
Ynand the down-sampled acoustic signalAn.Xis close
to 1 ifsm(t) is transmitted from the MCWM system, and
close to 0 if not. The same operations are repeated for other channels interested.
The cross-correlator suffers from very high computa-tion complexity. To solve this problem, we first notice that reducing the data precision reduces the complex-ity of cross-correlator dramatically, but only degrades the performance slightly [7]. Consider the operation P
n YnAnrequired in the cross-correlator shown in figure 2; ifYn equals to either 1 or -1, all the multiplications
are unnecessary. Moreover, if Yn = 0 at some points,
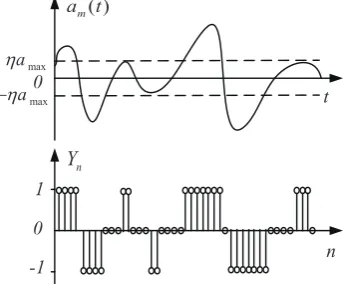
the number of additions is also reduced. Motivated by these facts, we represent Yn by only 0, 1 and -1. In
other words, we propose a 1.5-bit FM demodulator with inputs(mIF)(t) and outputYn, and show the relationship
between the original audio signalam(t) and the desired
outputYnin figure3. This simplified FM demodulator
in turn simplifies the cross-correlator significantly. We introduce the 1.5-bit FM demodulator in subsec-tion4.2, and discuss its performance in noisy environ-ments in subsection 4.3. Audio signal processing and the cross-correlator are introduced in subsections 4.4
and4.5, respectively. Finally, the WMUE attack detector is given in subsection4.6.
4.1. Preliminaries
We first analyse the properties of IF signals(mIF)(t) with
central frequencyfI:
sm(IF)(t) =ACcos
"
2πfIt+ 2π∆f
Zt
0
am(t)dt+θ
#
. (2)
For most superheterodyne receivers,
fI >2fmax (3)
and
fI >2∆f amax (4)
where fmax and amax denote the maximum frequency
and maximum amplitude of am(t), respectively. Then
EAI
European Alliancefor Innovation 4 EAI Endorsed Transactions on
a(t)
1.5-bit FM
demodulator Downsampler
Corss-correlator
Detector Wireless transceiver
Acoustic sensor
X
n
Y
( )
( )
IF m
s t
Frequency down-conversion
( )
m
s t
n
A
Figure 2. Basic procedures of the proposed WMUE attack
detection scheme.
t
n
n Y
1
0
-1
( )
m a t
max a
max a
! 0
Figure 3. The relationship betweenam(t)and the desired output
Ynof a 1.5-bit FM demodulator, where−ηandηare two decision
thresholds.
we defineT as a number that satisfies
2fmax≤1/T < fI (5)
and get the following observations.
Observation1:
|
Z (n+1)T
nT
sm(IF)(t)ej2πgktdt|≈ACTsinc((gk−ft0)T) (6)
where
ft0 :=fI +∆f am(t0) (7)
|gk−ft
0| ≤1/(2T) (8)
and sinc(x) := sin(πx)/(πx).
Proof. Define θ1:= 2π∆f
Rt0
0 am(t)dt and θ2:=
2π∆f am(t0)t0. From (2) we have
s(mIF)(t) =ACcos
2πfIt+ 2π∆f
Rt
t0am(t)dt+θ1+θ
≈ACcosh2πft
0t+θ
0i
(9)
whereθ0 :=θ1−θ2+θ.
The approximation in (9) is due to the reason that, 1/T ≥2fmax according to (5),am(t) shows limited
change during [t0, t], and
Rt
t0am(t)dt
≈am(t0)(t−t0).
Then we get
Rt0+T
t0 s
(IF)
m (t)ej2πgtdt
≈Rt0+T
t0 ACcos h
2πft0t+θ
0i
ej2πgtdt
= AC
2 [
Zt0+T
t0
ej2π(g+ft0)t+jθ
0 dt
| {z }
d1
+ Zt0+T
t0
ej2π(g−ft0)t−jθ
0 dt
| {z }
d2
]
(10) The integrands in d1 and d2 are two periodical
functions with frequenciesg+ft0andg−ft0. According to (5) (7) and (8), g+ft0 ≈2fI >2/T ≥4|g−ft0|. As a result,d1 is much smaller thand2. By ignoringd1, (10)
becomes
Rt0+T
t0 s
(IF)
m (t)ej2πgtdt
≈ AC
2
Rt0+T
t0 e
j2π(g−ft
0)t−jθ
0 dt
= AC
2 e −jθ00
(ej2π(g−ft0)T −1)/(j2π(g−ft
0))
(11)
whereθ00 :=θ0−2π(g−ft
0)t0. Then from (11) we have
|R(n+1)T
nT s
(IF)
m (t)ej2πgktdt|
≈ |AC
2 e −jθ00
(ej2π(g−ft0)T −1)/j2π(g−ft
0)| =AC(1−cos(2πT(g−ft0)))/(4π
2(g−f
t0)
2)
=ACTsinc((gk−ft0)T)
(12)
Observation 2: If |g1−fnT| ≤ |g2−fnT| ≤1/(2T),
Sm,n(1) ≥S
(2)
m,n where S
(k)
m,n :=|
R(n+1)T
nT s
(IF)
m (t)ej2πgktdt| and
fnT :=fI +∆f am(nT).
Proof. It is easily shown thatSm,nk equals to the left part
of (6) when t0=nT. According toObservation1, S (k)
m,n
is a monotonically decreasing function with respective to|g−fnT|during [0,1/(2T)]. Therefore,Observation2
holds.
Since we focus on the mth audio channel here, we drop the indexminSm,n(k) if doing this would not cause
misunderstanding.
4.2. The 1.5-bit FM Demodulator
Def inition: A demodulator with outputYm,nis the
1.5-bit FM demodulator of the IF signal s(mIF)(t) defined in
(2) if and only if
Ym,n=
−1, am(nT)<−ηamax
0, −ηamax≤am(nT)< ηamax
1, others
(13)
EAI
European Alliancefor Innovation 5 EAI Endorsed Transactions on
( )
( ) IF m
s t
2 I j f t
e
2 ( I R)
j f f t
e
!2 ( I R)
j f f t
e
!( 1)
t n! T
( 1)
t n! T
( 1)
t n! T
(1)
n S
(2)
n S
(3)
n S
( 1)
| n T( ) | nT !dt
"
( 1)
| n T( ) | nT !dt
"
( 1)
| n T( ) | nT !dt
"
( )
(1) ( 2) (3)
arg max 2
: { , , }
i n
n S i
n n n
Y
S S S
!
S
S
Figure 4. The proposed 1.5-bit FM demodulator.
where n= 0,1, ..., while −η and η are two decision
thresholds with 0< η <1.
Figure 3 shows the relationship between am(t) and
the desired output of this 1.5-bit FM demodulator. The thresholds−η andη should guarantee thatYm,n equals
to 0, 1 or -1 with equal probabilities, so that the amount of information contained in Ym,n is maximized. For
example, if the amplitude ofam(t) is evenly distributed
over [0, amax],η= 0.5.
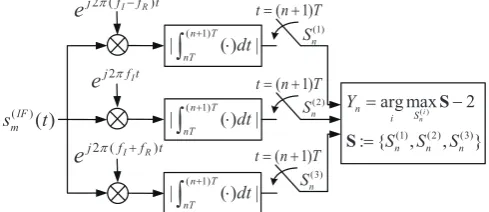
P roposision 1: The demodulator shown in figure
4 with output Yn= arg i
max
Sn(i)
Sn−2 is the 1.5-bit FM
demodulator defined in Def inition, where Sn:=
{Sn(1), Sn(2), Sn(3)}, g1=fI−fR, g2=fI, g3=fI +fR, fR=
2ηamax∆f, and
|gk−fnT| ≤1/(2T) (14)
wherek= 1,2,3.
Proof. Whenam(nT)<−ηamax,
|g1−fnT|
=|fR+∆f am(nT)|
=|2ηamax∆f +∆f am(nT)| <|∆f am(nT)|
=|g2−fnT| ≤1/(2T)
(15)
and it is easily shown that |g1−fnT|<|g3−fnT| ≤
1/(2T). Then according toObservation2,Sn(1)> Sn(2)and
Sn(1)> Sn(3). As a result, arg i
max
Sn(i)
Sn= 1 andYn=−1.
By the same way, one can verify that Yn = 0 when
−ηamax ≤am(nT)< ηamax, and Yn= 1 when am(nT)≥
ηamax.
The 1.5-bit FM demodulator proposed in figure 4
borrows the design of matched-filter [23]; however, their basic principles are different. In our system, the local signals fed into the multipliers, ej2πfIt and
ej2π(fI±fR)t, do not necessarily match any pieces of the FM signal transmitted. Instead, our system is designed such that the integrators generate larger outputs when
Sampler Fs=1/T
( )
m
a t ( )
m
a nT Three-level
Quantizer n Y
Normalization am( )t ( )m 1 a P
Figure 5. The proposed 1.5-bit FM demodulator can be
interpreted as a sampler for the audio signalam(t)with sampling
frequencyFs= 1/T followed by a three-level quantizer.
these local signals match the present signal better. Then by searching the largest outputs from three integrators, the demodulator determines the best value (0, 1 or -1) forYn.
This 1.5-bit FM demodulator can also be interpreted as a sampler for the normalized audio signaleam(t) with sampling frequencyFs = 1/T followed by a three-level
quantizer, as shown in figure 5. After normalization, we assume that the average power of ˜amax(t) equals to
1. This FM demodulator may also operate in digital domain, if the input sIFm(t) is sampled with sampling
rateGs. It is easily shown that, basic principle of this
demodulator still holds in digital domain, while the only change is to replace the integrators in figure4by adders.
By adopting integrators, the proposed 1.5-bit FM demodulator is able to work in low-SNR environments with low computation complexity. On the other hand, conventional digital FM demodulators [11, 15, 19] either suffer from high complexity or require high SNR.
4.3. Performance of the FM demodulator in Noisy
Environments
We define the noisy IF signal fed into the FM demodulator as_s(mIF)(t), which is modelled as
_
s(mIF)(t) =s
(IF)
m (t) +wm(t) (16)
where wm(t) is the additive white Gaussian noise
(AWGN) with power σ2
m at the mth wireless channel.
Then according to figure4, output of theith integrator
is given by
Sn(i)=|
R(n+1)T
nT (s
(IF)
m (t) +wm(t))ej2πgitdt|
=|ρ(ni)ejφi +R(n+1)T
nT wm(t)e
j2πgitdt| (17)
where
ρ(ni):=ACTsinc((gk−ftnT)T) (18) according toObservation1, andφi denotes the angle of
the complex value in (11) wheng=gi.
Let Nm:=
Rt0+T
t0 wm(t)e
j2πgitdt represent the random part in (17). One can easily verify thatNm is a random
variable which follows complex normal distribution with mean value 0 and variance σ2
mT. As a result,S
(i)
n
in (17) follows Rician distribution whose probability
EAI
European Alliancefor Innovation 6 EAI Endorsed Transactions on Cognitive Communications
0 0.1 0.2 x 0.3 0.4 0.5 (a) fnT=0
Sn(1)
Sn(2)
Sn(3)
0 0.1 0.2 x 0.3 0.4 0.5
(b) fnT=fI-fR
Sn(1)
Sn(2)
Sn(3) Errors
4 10
4 10 0
nT
f
nT I R
f f f
Figure 6. The PDF curves for Sn(1), Sn(2) and Sn(3) with (a)
fnT =fI and (b)fnT =fI−fR, respectively, andγ= 0dB.
density function (PDF) is given by [1]
pi(x) =
x σ2
mTe
−x2+(ρ
(i) n)
2
2σmT2 I0(xρ (i) n
σ2 mT), x
≥0
0, x <0
(19)
where ρ(ni) follows the same definition as in (18), and
I0(x) is the modified Bessel function of the first kind
with order zero.
Similar to the bit-error-rate (BER) performance in digital communication systems [1], performance of the proposed 1.5-bit FM demodulator is closely related to the ratio γ defined by γ:=ρn2/(σm2T), which is
proportional to AC2T /σm2 according to (18). Note that
AC2/σm2 just equals to (twice of) the SNR ofsm(t). As a
result, larger SNR leads to largerγand better anti-noise ability.
Larger T also leads to larger γ. However, T is also restricted by (5) and (14), while larger T makes both
Observation 1 and Observation 2 less accurate and
may increase demodulation error (we call it modelling error). In practice, the optimal value of T may not strictly satisfy both (5) and (14) due to the trade-off between γ and modelling error. We will derive the optimal value ofT by simulations in subsection5.1.
PDF’s ofSn(1),Sn(2)andSn(3)are plotted in figure6, with
AC= 1, fI = 50 kHz, fR= 5 kHz, T = 50µs and γ = 0
dB. WhenfnT =fI as shown in figure6.a,S
(2)
n has the
best chance to be the largest one among{Sn(1), Sn(2), Sn(3)};
as a result, Yn tends to be 0, which is correct. When
fnT =fI −fRas shown in figure 6.b,Sn(2) is most likely
the largest one, and Yn tends to be -1. The shaded
area denotes the chance of decoding error. Whenγ is changed to 8 dB and other conditions keep unchanged,
0 0.1 0.2 x 0.3 0.4 0.5
(a) fnT=0
Sn(1)
Sn(2)
Sn(3)
0 0.1 0.2 x 0.3 0.4 0.5
(b) fnT=fI-fR
Sn(1)
Sn(2)
Sn(3) Errors
4 10
4 10
0
nT
f
nT I R
f f f
Figure 7. The PDF curves for Sn(1), Sn(2) and Sn(3) with (a)
fnT =fI and (b) fnT =fI−fR, respectively, andγ= 8dB.
as shown in figure7, the shaded areas become smaller compared with those in figure6, and the demodulation performance is better.
Although a closed-form expression on the “BER” of this demodulator can be derived from PDF’s, we note that this expression is valid only when this demodulator operates in analog domain. Performance of this FM demodulator operating in digital domain is affected by the sampling rateFs, and we will show the
normalized mean square error (NMSE) performance of this demodulator under the sampling rate adopted by the real-world experiments in subsection5.1.
4.4. Audio Signal Processing
We model the acoustic signala(t) arriving at the WSD underH0as
a(t)|H0=a(T)(t)⊗h(t) =
J
X
j=1
hja(T)(t−tj) +z(t) (20)
where h(t) :=
J
P
j=1
hjδ(t−tj) represents the impulse
response of the acoustic channel between loudspeaker and WSD, andz(t) denotes audio noises.
In practice, acoustic signal travels slower than RF signal. To address this issue, we define the time t= 0 as the time when FM signal is detected by the WSD. Accordingly, alltj’s in the acoustic channel modelh(t)
incorporate propagation delay of the acoustic signal. As an example, if there is line-of-sight with distance
Dbetween audio amplifier and WSD,t0=D/vwherev
denotes the speed of sound in the air, while propagation delay of FM signal is much smaller thant0and has been
ignored.
EAI
European Alliancefor Innovation 7
At the WSD side, a(t) is sampled by the acoustic sensor at a high sampling rate (for example, 44.1 kHz). In order to match this acoustic signal with the FM demodulator output, we resample this acoustic signal at the rate 1/T, which equals to the sampling rate ofYn.
Since 1/T =10 kHz is good enough to capture human voices, we consider this operation as a downsampler as shown in figure2. Moreover, this downsampler features a lowpass filter with stop-band 1/T to resist out-of-band noises.
Denote the downsampled acoustic signal as An,
which is obtained by
An|H0=a(T)(t)⊗h(t)⊗hs(t) +zL(t) (21)
where hs(t) :=Pδ(t−nT) serves as the sampling
function, andzL(t) denotes the lowpass-filtered noises.
We combine the sampling operation with the acoustic channel response, and define
d(nT) :=h(t)⊗hs(t) :=
L
X
l=1
dlδ(nT −tlT) +Zn (22)
wheretl is a non-negative integer, andZn denotes the
samples of noises. Combining (21) and (22), we get
An|H0=
M
P
m=1 am(t)⊗
L
P
l=1
dlδ(nT−tlT)
= PM
m=1
L
P
l=1
dlam(nT −tlT) +Zn.
(23)
On the flip side,AnunderH1is modelled by
An|H1=Z 0
n (24)
which incorporates both audio noise and possible audio signal generated by the attacker. We denote the average powers ofZn andZ
0
n asPZ andP
0
Z, respectively. When
the attacker emulates both audio signal and FM signals,
PZ0 > PZ, whereasP
0
Z =PZ if the attacker only emulates
FM signals.
4.5. The Cross-correlator
In this subsection, we will set up the connection between the audio samplesAnand the FM demodulator
outputsYn under three scenarios defined in subsection 3.1.
Scenario 1. We first look at the simplest scenario (scenario 1) in which both audio noises and RF noises are ignored.
According to (13) and (23), both An and Yn are
functions ofam(t) underH0. Moreover, the relationship
between Yn and am(t) can be simplified by the
interpretation given in figure5:
Ym,n= aqm(nT)
Pa(m)
+Qm,n (25)
wherePa(m)denotes the average power ofam(t), andQm,n
denotes the quantization error att=nT. Then from (23) and (25), we get
Corr(An|H0, Ym,n, p)
:= P1 m,p
W−1
P
n=0
(An|H0)Ym,n−p
= 1
Pm,p(C
(0)
m,p+Cm,p(1) +Cm,p(2)), p=tl
1
Pm,p(C
(2)
m,p+Cm,p(3)), others
(26)
where
Pm,p:=
v u t (
W−1
X
n=0
(An)2)( W−1
X
n=0
(Ym,n−p)2) (27)
Cm,p(0) :=qdl
Pa(m) W−1
X
n=0
|am(n−tl)|2 (28)
Cm,p(1) :=
1 q
Pa(m) W−1
X
n=0
X
m0,l0,
|m−m0 |+|l−l0 |,0
am0(n−tl0)am(n−tl) (29)
Cm,p(2) := W−1
P n=0 M P m=1 L P l=1
dlam(n−tl)Qm,n+ W−1
P
n=0ZnYn −p
(30)
Cm,p(3) := q1
Pa(m) W−1
X
n=0
M
X
m0=1
L
X
l0 =1
dlam0(n−t
l0)a
m(n−p). (31)
and W determines the window size of this cross-correlator.
Similarly, Corr(An|H1, Ym,n, p) is obtained by setting
am(t) = 0 form= 1, ..., Min (26):
Corr(An|H1, Ym,n, p) = 1
Pm,p W−1
X
n=0
Zn0Ym,n−p. (32)
The audio noisesZn andZ
0
nand quantification error
Qn are considered as uncorrelated to Yn and am(t),
respectively. As a result,Corr(An|H1, Ym,n, p) is close to
0. On the flip side, due to the existence ofCm,p(0) given in
(28),Corr(An|H0, Ym,n, p) always contains some values
that are much larger than 0 (but smaller than 1). If audio signalsam(t) on different channels are correlated with
each other, Corr(An|H0, Ym,n, p) is even larger because
ofCm,p(1) given in (29). In any case,Corr(An|H0, Ym,n, p) is
expected to exceedCorr(An|H1, Ym,n, p) whenp=tl.
Finally, we design the outputXof the cross-correlator as
X= max
p=0,...,τmax
{Corr(An, Ym,n, p)} (33)
where τmax represents the maximum delay spread
of the audio channel divided by T (and rounded
EAI
European Alliancefor Innovation 8
to the nearest integer if necessary). Equation (33) searches the peak value X of the cross-correlation between demodulated FM signal and down-sampled audio signal within the time window [0, τmax], and X|H0is expected to exceedX|H1. This searching process
synchronizes the demodulated FM signalYm,nwith the
strongest (sampled) path inAn.
Scenario 2 and Scenario 3. Scenario 2 differs from Scenario 1 only in that, the audio signal a(t) has poor quality, or in other words,Zn has larger amplitude. As
a result, all the analysis inScenario 1directly applies to Scenario 2.
Scenario 3 differs from Scenario 1only in that, sm(t)
has poor quality. As a result, Ym,n is contaminated by
both quantification error and noises. For simplicity, we merge the the quantification error into noises, and let Qm,n represent both. As a result, all the analysis
in Scenario 1 still applies to Scenario 3. The value of
Corr(An|H1, Ym,n, p) increases when the amplitude of
Zn or Qm,n increases. As a result, the window size
W of the cross-correlator in Scenario 2 and Scenario 3 should be larger than the window size adopted in Scenario 1. However, larger window size also leads to longer detection time which equals toT W, and there is a trade-off between the detection performance and computation complexity. We will discuss this issue in section5.
4.6. The Detector
According to the analysis in subsection 4.5, X|H0 is
expected to be greater than X|H1 under all three
scenarios. Then the proposed WMUE attack detector is given as follows:
The Detector: a WMUE attack is detected if and only
ifX < X0, whereX0is the detection threshold.
To determine the detection threshold X0, we first
ignore the quantification error Qm,n, and assume that
audio signals at different audio channels are uncorre-lated and have same average power PR measured at
the WSD. Then the first term in (23) (the power of the mixed audio signal at the WSD) has the average
power MPR,Cm,p(1) = 0 andCm,p(2) = W−1
P
n=0ZnYn
−p. It is
eas-ily shown thatPm,p∝W
√
MPR+PZ,C
(0)
m,p∝W
√ PR, and
Cm,p(2) ∝
√
W PZ, wherePZ denotes the average power of
Zn. Then we get
X|H0∝ W
√
PR+
√
W PZ
W√MPR+PZ
(34)
and
X|H1∝1/ √
W . (35)
When W is large, X|H1 approaches 0 and X|H0
approaches √PR/
√
MPR+PZ. The detection threshold
X0equals to 12 √
PR/
√
MPR+PZ accordingly, which only
needs the second-order statistics of audio signal and background noise. X0 may be further simplified as
1/2
√
MwhenPZ is small compared withPR.
When audio signals on different channels are cor-related, X|H0 increases while X|H1 keeps unchanged.
With the same detection threshold derived above, detection rate will be enhanced, while the false alarm rate is not affected.
4.7. Discussions
With the models (23) and (24), it seems that WMUE attacks can be detected simply by energy detection. However, such detection method is vulnerable if the attacker emulates audio signal in order to increase the audio noise floor. On the flip side, the proposed scheme always works as long as the emulated audio signal is uncorrelated to the FM signal.
In order to get X, Corr(An, Ym,n, p) needs to be
calculated for τmax+ 1 times with different values
of p. In the definition of Corr(An, Ym,n, p) given in
(26), the calculation of W
−1
P
n=0
(An|H0)Ym,n−p requires
only additions, because Ym,n only takes the values
of 0 and ±1. Moreover, the normalization factor 1
Pm,p can be derived iteratively [17], and takes only one multiplication and one square root operation per update, only except for the first update (when p= 0). The 1.5-bit FM demodulator requires only three analogue multipliers and three integrators if operating at analogue domain, and takes three multiplications and three additions per sample if operating at digital domain. As a result, the whole detection scheme enjoys low computation complexity.
5. Experiments
Performance of the proposed WMUE attack detection scheme is determined by the performances of the 1.5-bit FM demodulator and the cross-correlator. We first conduct computer-based simulations to evaluate the NMSE performance of the FM demodulator, then prototype the whole scheme and conduct real-world experiments to evaluate detection rate and detection time.
5.1. Performance of the FM demodulator
Performance of the FM demodulator is quantified by NMSE, which is defined as
N MSE:=
NAll−1 P
n=0
(Ym,n(1) −Ym,n(2))
2
NAll−1 P
n=0
(Ym,n(1))
2 (36)
EAI
European Alliancefor Innovation 9
where Ym,n(1) denotes the outputs of the ideal
FM-demodulator defined in (13),Ym,n(2) denotes the outputs
from the proposed FM-demodulator shown in figure
4, and NAll represents the length of both outputs. In
this definition, we have excluded the quantization error, since the task of this demodulator is not to recover the original audio signal am(t), but to provide valid
coefficients for the cross-correlator.
The NMSE performances are derived from computer based simulations, with∆f = 5kHz,fI=10 kHz,η= 0.5
and NAll = 500. The audio signal am(t) is read from
an audio file which records a piece of human voice, with amax≈1 (a little smaller than 1). Moreover, the
IF signalsIFm(t) is sampled atGs= 50 kHz, which is the
same sampling rate that will be used in our real-world testing, and the FM demodulator operates at digital domain.
The sampling interval T is considered as an important design parameter, since larger T leads to largerγas discussed in subsection4.3, but also reduces the sampling rate of Ym,n and may cause aliasing.
Moreover, SNR of the FM signal, which equals to
A2/(2σm2), is also an important factor of NMSE.
We plot NMSEs of the FM-demodulator as a function of SNR in figure8, whenT equals to 0.1, 0.25, 0.5 and 1 ms, respectively. It is shown that the settingT = 0.5ms leads to the best performance in most cases, and is adopted in the following testing. The corresponding optimal sampling rateFs∗ is 2 kHz, which just satisfies
(5) with the fact that the most energy in human voice concentrates in the frequency band below 1 kHz. On the flip side,Fs∗ is smaller than the value required by
(14) which equals to 10 kHz, since smaller sampling rate leads to longer integration window and better anti-noise ability, which compensates for the increased modelling error.
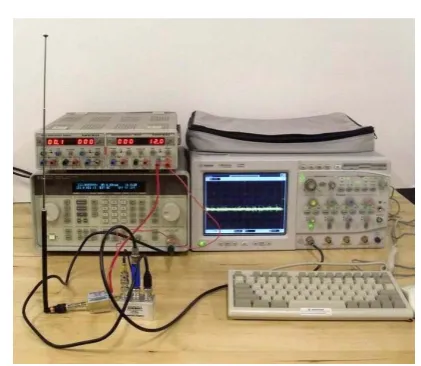
5.2. The Prototype
We prototype the proposed WMUE attack detection scheme by a commercial MCWM system and a self-designed WSD in a 12m×7m room, as shown in figure
9. A commercial MCWM system and a WSD prototype are set up in a 12m×7m room. The MCWM system
contains an 8-channel WM receiver manufactured by Pyle Audio Inc. with model number PDWM8400, a 40W loudspeaker, and eight WMs. The carrier frequencies of these 8 channels are within the range of 170-240 MHz, which falls into VHF band. The WSD prototype is composed of two function blocks: (1) audio signal acquisition and (2) RF signal acquisition. An acoustic sensor connected to a laptop with sampling rate Fs =
44.1 kHz takes response of audio signal acquisition, while RF signal acquisition is realized by a multi-channel oscilloscope and two RF branches, which is
0 5 10 15 20 25 30 35 40
−35 −30 −25 −20 −15 −10 −5 0
SNR (dB)
NMSE (dB)
T=0.1ms T=0.25ms T=0.5ms T=1ms
Figure 8. NMSE of the proposed 1.5-bit FM demodulator when
T equals to 0.1, 0.25, 0.5 and 1 ms, respectively.
MCWM Receiver Loudspeaker
WMs
Laptop Acoustic
Sensor
RF Branch 1
Oscillo-scope
RF Branch 2
Audio signal RF signals
Audio signal acquisition
RF signal acquisition The MCWM system
The WSD prototype
1
(IF)( )
m
s t
2
( )
( ) IF m
s t
Figure 9. Block diagram of the real-world testing environment.
Mixer
RF LO IF
Signal Generator
LPF Antenna
Amplifier
Carrier
( )
( ) IF m
s t
Figure 10. Block diagram of one RF branch.
capable to capture RF signals on two wireless channels simultaneously.
The two RF branches in figure 9 share the same design as shown in figure 10, which is mainly a frequency down-conversion circuit realized by a level-7 mixer. A signal generator serves as the local oscillator. Moreover, the wireless signal is amplified by an amplifier at RF and filtered by a LPF at IF. Both the
EAI
European Alliancefor Innovation 10
Figure 11. Photo of the WSD prototype.
image in the mixer’s IF output and the out-of-band interferences are also rejected by the LPF; therefore, we do not apply any RF filter here. The IF signalss(mIF1)(t) andsm(IF2)(t) coming from two RF branches are recorded by the multi-channel oscilloscope with sampling rate
Fa= 50 kHz and fI = 10 kHz. Figure 11 shows the
picture of the WSD prototype.
5.3. Testing Method
We consider such a WMUE attacker who replaces the speaker of a commercial WM system with an earphone and uses the modified system as his personal wireless phone. This attacker is very similar to a legitimate WM user and hard to be detected. As a result, the WM user is emulated by the MCWM system with loudspeaker turned on, while the WMUE attacker is emulated by the same MCWM system with loudspeaker turned off. Meanwhile, we define detection rateβ as the rate that the WMUE attack is detected when the loudspeaker is turned off, and define false alarm rateαas the rate that the WMUE attack is detected when the loudspeaker is turned on.
For each scenario described in section 3.1, we test two cases that (1) two wireless channels or (2) four wireless channels are used simultaneously; we will use the terms “two channels” and “four channels” to represent these two test cases, respectively. The FM demodulator operates in digital domain with
t=n0T0 where T0 = 20 µs and n0= 0,1, .... We set
τmax= 200, since the maximum delay spread of the
acoustic channel experienced in our experiments does not exceed 0.1 s. Two RF branches are designed to emulate some WSDs with multiple antennae; the waveforms acquired by two RF branches are considered as two independent samples, upon which our detection scheme are executed twice and the results are averaged. We setη= 0.5 in both cases and all scenarios.
1
-1
t
n
0
( )
1 ( )
IF
s t
1,n
Y
Figure 12. Waveform pieces of the IF signal and demodulator
output acquired in the testing.
Performance of the proposed WMUE attack detection scheme in Scenario 1 is evaluated by the original waveforms acquired in the experiments, with about 30 samples for each test case. For the other two scenarios, we add random noises to either the acoustic signal (in Scenario 2) or IF signals (inScenario 3) with certain SNR.
5.4. Testing Results
A snapshot of the waveform pieces of s1(IF)(t) and Y1,n
derived in the experiments is plot in figure 12. The IF signals(1IF)(t) is close to a sine wave but with varying frequency; its amplitude is not constant due to the limited over-sampling rate (which equals to 5 according to the settings in subsection 5.2). The demodulator output Y1,n equals to 1 when the instant frequency of
s(1IF)(t) is high, while equals to −1 when the instant
frequency ofs(1IF)(t) is low.
Next, we evaluate the relationship between detection rateβ and detection timeT W in three scenarios with the simpler case of two channels, as shown in figure13. Both the SNR of the audio signal inScenario 2and the SNR of the IF signals inScenario 3are set to 3 dB, and the false alarm rateα in all curves are kept below 0.1. The proposed scheme achieves good performance in all scenarios when the detection time is no less than 0.25 s, orW >= 500. We focus on the case ofW = 500 in the following experiments.
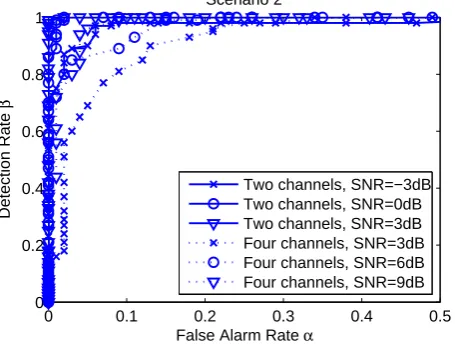
Finally, the performances in Scenario 2andScenario 3under different SNR conditions are further evaluated by receiver operating characteristic (ROC), which represents detection rate β versus false alarm rate α. In Scenario 2, the proposed detection scheme achieves the performance α <0.1 and β >0.9 (named good performance) when SNR is higher than -3 dB and 6 dB in the cases of two channels and four channels, respectively, as shown in figure 14. In Scenario 3, the SNRs required to achieve good performance in the two
EAI
European Alliancefor Innovation 11
0 0.05 0.1 0.15 0.2 0.25 0.3 0.35 0
0.1 0.2 0.3 0.4 0.5 0.6 0.7 0.8 0.9 1
Detection Time (s)
Detection Rate
β
Scenario 1, two channels Scenario 2, two channels Scenario 3, two channels
Figure 13. Detection rate versus detection time in three
scenarios in the cases of two channels and four channels, respectively.
0 0.1 0.2 0.3 0.4 0.5
0 0.2 0.4 0.6 0.8 1
Scenario 2
False Alarm Rate α
Detection Rate
β
Two channels, SNR=−3dB Two channels, SNR=0dB Two channels, SNR=3dB Four channels, SNR=3dB Four channels, SNR=6dB Four channels, SNR=9dB
Figure 14. ROC curves in Scenario 2 under different SNR
conditions in the cases of two channels and four channels, respectively.
cases are 0 dB and 5 dB, respectively, as shown in figure
15.
These testing results validate that, the proposed scheme perform well in both noiseless environments and noisy environments.
6. Conclusions
In this paper, we propose a novel and simple algorithm to detect WMUE attacks imposed on MCWM systems in noisy environments. To the best of our knowledge, this is the first work that considers the MCWM systems. The cross-correlation between demodulated FM signal and the acoustic signal acquired simultaneously provides an effective way to detect WMUE attacks, and show good ability to resist noises/interferences. Moreover,
0 0.1 0.2 0.3 0.4 0.5
0 0.2 0.4 0.6 0.8 1
Scenario 3
False Alarm Rate α
Detection Rate
β
Two channels, SNR=0dB Two channels, SNR=3dB Four channels, SNR=3dB Four channels, SNR=5dB Four channels, SNR=7dB
Figure 15. ROC curves in Scenario 3 under different SNR
conditions in the cases of two channels and four channels, respectively.
computation complexity of the cross-correlator can be significantly reduced by the proposed 1.5-bit FM demodulator. The optimal sampling rate of the FM demodulator is 2 kHz according to the simulation results.
We set up a MCWM system and design a WSD prototype for performance evaluation. Hardware based experiments show that, the proposed algorithm is able to detect WMUE attacks within 0.25 s in all scenarios when two or four wireless channels are used simultaneously, with detection rate β >0.9 and false alarm rateα <0.1. The minimum and maximum SNRs required to achieve such performance in various conditions equal to -3 dB and 6 dB, respectively.
We conclude that, both the 1.5-bit FM demodulator and the WMUE attack detection algorithm achieve good performances in noisy environments. Performance of the proposed scheme may be further enhanced by multiple antenna or collaborative sensing techniques, which are considered as our future works.
Acknowledgement. This material is based upon work par-tially supported by the US National Science Foundation CAREER award under Grant Number (CNS-1149500).
References
[1] Communication Systems and Techniques. New York: McGraw-Hill, 1966.
[2] C. Chen, H. Cheng, and Y.-D. Yao. Cooperative spectrum sensing in cognitive radio networks in the presence of the primary user emulation attack.IEEE Transactions on Wireless Communications, 10(7):2135–2141, 2007 July. [3] H.-S. Chen and W. Gao. Spectrum sensing for tv white
space in north america.IEEE Journal on Selected Areas in Communications, 29(2):316–326, Feb. 2011.
EAI
European Alliancefor Innovation 12 EAI Endorsed Transactions on Cognitive Communications
[4] R. Chen, J.-M. Park, and J. Reed. Defense against primary user emulation attacks in cognitive radio networks.IEEE Journal on Selected Areas in Communications, 26(1):25–37, Jan. 2008.
[5] S. Chen, K. Zeng, and P. Mohapatra. Hearing is believing: Detecting wireless microphone emulation attack in white space. IEEE Transactions on Mobile Computing, 12(3):401–411, 2013.
[6] Z. Chen, T. Cooklev, C. Chen, and C. P. Raez. Modeling primary user emulation attacks and defenses in cognitive radio networks. InProc. Performance Comput. Commun. Conf. (IPCCC), 2009.
[7] L. R. D’Addario, A. R. Thompson, F. R. Schwab, and J. Granlund. Complex cross correlators with three-level quantization design tolerances. Radio Science, 19:931– 945, May-June 1984.
[8] H. S. Dhillon, J.-O. Jeong, D. Datla, M. Benonis, R. M. Buehrer, and J. H. Reed. A sub-space method to detect multiple wireless microphone signals in tv band white space. Analog Integr Circ Sig Process, (69):297âĂŞ306, Sep. 2011.
[9] T. Erpek, M. McHenry, and A. Stirling. Dynamic spectrum access operational parameters with wireless microphones.IEEE Communications Magazine, 49(3):38– 45, Mar. 2011.
[10] FCC. Fm broadcast translator stations and fm broadcast booster stations, 47 cfr part 74.
[11] J. Garodnick, J. Greco, and D. Schilling. Theory of operation and design of an all-digital fm discriminator.
IEEE Transactions on Communications, 20(6):1159– 1165, 1972 Dec.
[12] S. Kim, J. Lee, H. Wang, and D. Hong. Sensing performance of energy detector with correlated multiple antennas.Signal Processing Letters, IEEE, 18(8):671–674, Aug. 2009.
[13] H. Li and Z. Han. Dogfight in spectrum: Combating primary user emulation attacks in cognitive radio systems, part i: Known channel statistics. IEEE Transactions on Wireless Communications, 9(11):3566– 3577, 2010 Nov.
[14] N. Nguyen, R. Zheng, and Z. Han. On identifying primary user emulation attacks in cognitive radio systems using nonparametric bayesian classification.
IEEE Transactions on Signal Processing, 60(3):1432–1445, March 2012.
[15] A. Saha and B. Mazumder. A digital phase-locked loop for generating frequency discriminating codes and frequency multiplication. Proceedings of the IEEE, 69(4):472– 473, 1981 April.
[16] A. Sahai, N. Hoven, and R. Tandra. Some fundamental limits in cognitive radio. InProc Allerton Conf Commun Control Comput, 2004.
[17] D. Schmidl, T.M.; Cox. Robust frequency and timing synchronization for ofdm. IEEE Transactions on Communications, 45(12):1613–1621, Dec. 1997.
[18] D. Shan, K. Zeng, P. Richardson, and W. Xiang. Detecting multi-channel wireless microphone user emulation attacks in white space with noise. InThe 8th International Conference on Cognitive Radio Oriented Wireless Networks (CROWNCOM 2013), 2013.
[19] B.-S. Song and I. S. Lee. A digital fm demodulator for fm, tv, and wireless. Circuits and Systems II: Analog and Digital Signal Processing, IEEE Transactions on, 42(12):821–825, 1995 Dec.
[20] S. Xu, S. Xu, and H. Wang. Svd based sensing of a wireless microphone signal in cognitive radio networks. InInt. Conf. on Computational Science (ICCS), 2008. [21] K.-W. Yip, Y.-C. Wu, and T.-S. Ng. Design of
multiplierless correlators for timing synchronization in ieee 802.11a wireless lans. IEEE Transactions on Consumer Electronics, 49(1):107– 114, 2003 Feb.
[22] Z. Yuan, D. Niyato, H. Li, J. B. Song, and Z. Han. Defeating primary user emulation attacks using belief propagation in cognitive radio networks. IEEE Journal on Selected Areas in Communications, 30(10):1850–1860, Nov. 2012.
[23] L. Zadeh and J. Ragazzini. Optimum filters for the detection of signals in noise. Proceedings of the IRE, 40(10):1223–1231, Oct. 1952.
EAI
European Alliancefor Innovation 13