Personality and Learning Effectiveness of Teams in
Information Systems Education Courses
Masashi Shuto
1, Hironori Washizaki
1,2,3,4,*, Yoshiaki Fukazawa
1, Shoso Yamato
5, Masashi Okubo
6and
Bastian Tenbergen
71Waseda University, Tokyo, Japan
2National Institute of Informatics, Tokyo, Japan 3SYSTEM INFORMATION CO., LTD., Tokyo, Japan 4eXmotion Co., Ltd., Tokyo, Japan
5Hosei University, Tokyo, Japan
6NEC Management Partner, Tokyo, Japan
7State University of New York at Oswego, NY, USA
Abstract
The goal of this paper is to clarify the optimal combination of team members to maximize the learning effectiveness in information systems education courses. We surveyed the correlation of students’ five factor model personalities and the learning effectiveness, which is the amount of increase in team management or technical knowledge, and skill, which is the IPA common carrier skill framework based on SFIA. Specifically, we targeted were three actual courses (a System Development Project course, an IT Management Project course, and an Application Development Project course) to elucidate the relationships between personality characteristics and learning effectiveness. Although individual students’ personality characteristics are not strongly related to learning effectiveness, team personality characteristics are related to learning effectiveness. In particular, Neuroticism and Conscientiousness characteristics are negatively correlated to learning effectiveness.
Keywords: Information system education, Software engineering education, Team communication, Team coordination, Five factor model, Personality characteristics, Problem-based learning
Received on 01 June 2018, accepted on 20 July 2018, published on 03 October 2018
Copyright © 2018 Masashi Shuto et al., licensed to EAI. This is an open access article distributed under the terms of the Creative Commons Attribution licence (http://creativecommons.org/licenses/by/3.0/), which permits unlimited use, distribution and reproduction in any medium so long as the original work is properly cited.
doi: 10.4108/eai.25-9-2018.155572
1. Introduction
Although students learn specific fundamental skills more effectively as a team, the optimal composition of a team in academic education is unclear. This paper strives to clarify the optimal combination of team members to maximize the learning effectiveness in information systems education courses.
This paper is an extended version of a conference paper [1] presented at SNPD 2017. In this paper, we have added data,
analysis results, and explanations.
*Corresponding author. Email:washizaki@waseda.jp
Working in a team is an important learning method in an education course. For example, project-based-learning (PBL), where students work on a project, is an effective way to learn skills [2][3] as it is almost impossible for one student alone to solve all tasks in PBL. Teamwork is the driver of success in software projects [4]. The variables directly affecting teamwork in software development include communication, coordination, balance of member contributions, mutual support, effort, and team cohesion [5]. As a team, students learn specific information system
EAI Endorsed Transactions
skills, communication, coordination, and other fundamental skills more effectively.
A moderately diverse team where members have different personalities reduces risks when developing software intensive business systems [6]. In software engineering, personal characteristics impact performance and attitude [7][8]. Therefore, the composition of the team should also be important for information system development education. However, the optimal composition in a team of students in academic education is unclear. In our previous study [11], we researched the relationship between student personality characteristics and learning effectiveness using the Five Factor and Stress theory (FFS) [9][10] in a system development project course and an IT Management project course. Because FFS is not a major theory, this paper uses the Five Factor Model (FFM), which is a major personality characteristic model [12].
Previously Salleh et al. researched the relationship between student performance and personality in FFM during pairing activities [13]. Their results showed a positive correlation between conscientiousness and assignments’ scores. Additionally, students’ test performance was positively correlated with openness to experience. In the following, we research the relationship between a team’s (4-6 people) FFM combination and the learning effectiveness (not performance).
This study focuses on the following research questions:
RQ1: Are individual student’s personality characteristics related to learning effectiveness?
RQ2: Are the team personality characteristics related to learning effectiveness?
RQ3: Do different information system lecture courses have similar relationships between team personality characteristics and learning effectiveness?
RQ4: Does the relationship between team personality characteristics and learning effectiveness depend on the format or country of the information system lecture course?
To investigate these RQs, we analyzed three actual lecture courses. Two courses entitled, “System development project course (SDC)” and “IT Management project course (ITC)” are open courses by Waseda University in Japan. The other is an “Open application development course (ODC)” by the State University of New York at Oswego. In these courses, students work in teams on a real project in a classroom setting. To measure the student’s personality characteristics and learning effectiveness, we employ an FFM questionnaire as well as a knowledge and skill questionnaire. This paper contributes to academic education in several countries and several courses. Specifically, we study the relationship between personality characteristics and learning effectiveness. The remainder of this paper organized as follows. Section 2 explains the relevant information about FFS, FFM, learning effectiveness, and related works. Section 3 describes our research methods. Sections 4 reports and evaluates the results. Finally, Section 5 concludes this paper.
2. Background and Related Work
Because various factors influence software projects, many researchers have examined the relationship between a project and personality [14][15].
2.1. Five Factor and Stress theory (FFS)
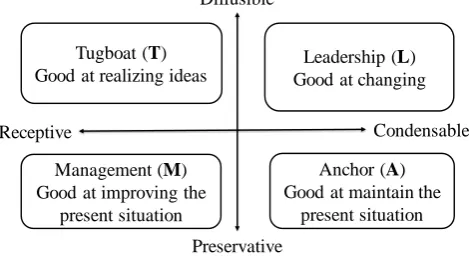
FFS theory emphasizes the personality characteristics in a team by mapping a person’s personality onto a two-dimensional graph where the X-axis ranges from receptive to condensable and the Y-axis ranges from preservative to diffusible (Fig. 1).
A receptive person is accepting of new knowledge and skills, while a condensable person imposes his or her own knowledge and skills on others. A diffusible person is assertive, whereas a preservative person is reserved. In our previous study, we researched the relationship between student personality characteristics and learning effectiveness using the Five Factor and Stress theory (FFS) [9] in the system development course and the IT management course. Teams with a larger dispersion on the X-axis had a higher learning effectiveness [11]. One drawback of the previous study is that the FFS is not a major theory.
Therefore, we use FFM in this paper. The experiment, which includes a comparison of students’ responses in the questionnaire about FFS to those about FFM, reveals that the X- and Y-axes of FFS are correlated to several dimensions of FFM, lending credence to the significance of FFS.
Figure 1. Overview of FFS
2.2. Five Factor Model (FFM)
The five-factor model of personality is a hierarchical organization of personality traits in terms of five basic dimensions (the Big 5): Neuroticism (N), Extraversion (E), Openness to experience (O), Agreeableness (A), and Conscientiousness (C). Studies using both natural language adjectives and theoretically based personality questionnaires support the comprehensiveness of the model and its applicability across observers and cultures [12]. Many types of questionnaires have been developed to measure these five factor dimensions. In this paper, we use
1
Management (M) Good at improving the
present situation
Anchor (A) Good at maintain the
present situation Tugboat (T)
Good at realizing ideas
Leadership (L) Good at changing Diffusible
Preservative
questionnaires entitled, “Revised NEO Personality Inventory (NEO-PI-R)”, “Revised NEO Five Factor Inventory (NEO-FFI)”, and “International Personality Item Pool (IPIP)”.
NEO-PI-R is one of the most famous methods to measure the Big 5. It is a measure of the five factor dimensions of personality characteristics in healthy adults [16]. It has 240 question items and five scales to measure the following dimensions (Domains):
Neuroticism (N): Neuroticism is the degree of stress reaction. A high score indicates that a person tends to have unrealistic thinking, cannot control anger, and has difficulty dealing with stress.
Extraversion (E): An extroverted personality is friendly and outgoing. On the other hand, a non-extroverted personality does not mean unfriendly and shy but means modest and humble. These differences are attributed to the degree of curiosity [17].
Openness (O): A highly open personality means non-traditional and positivity toward new ideas. This relates to intelligence of creative and diffusion thinking, but it is not the same as intelligence.
Agreeableness (A): A highly agreeable personality means altruistic and kind. A high value is often good in a team (with some exceptions). For example, highly agreeable people tend to avoid heated discussions.
Conscientiousness (C): A conscientious personality has a purpose and is strong-willed. They are firm and trustworthy. On the other hand, an unconscientious person tends to be unreliable.
NEO-FFI is the short version questionnaire of NEO-PI-R. It has 60 questions items. We can measure domains as well as NEO-PI-R. However, NEO-FFI does not gather the low dimensional items (Facet).
IPIP is the same as NEO-PI-R in terms of measuring the Big 5, but it slightly less reliable. However, IPIP is easy and free to use. IPIP has 50 question items ranked on a five-point scale. The IPIP scales that represent the NEO-PI-R were created by identifying items that are correlated highly with Costa and McCrae's NEO PI-R [18]. Although each of the five dimensions are similarly measured, instead of Openness, IPIP uses Intelligence. The average of the correlation value between NEO-PI-R and IPIP is about 0.65–0.75 [19]. To use these questionnaires in Japan, they must be translated into Japanese. In the case of NEO-PI-R, we used the Japanese version of NEO-PI-R published by Tokyo Shinri, which assures validity [16]. In the case of IPIP, we used a Japanese Translation questionnaire [20]. As a related work, Salleh et al. researched the relationship between student performance and personality of FFM during pairing activities [13]. The results showed a positive correlation between conscientiousness and assignments’ scores. Additionally, students’ test performance was positively correlated with openness to experience.
On the other hand, herein we investigate the relationship between the team (4–6 people) FFM combination and learning effectiveness (not performance).
2.3. Learning effectiveness
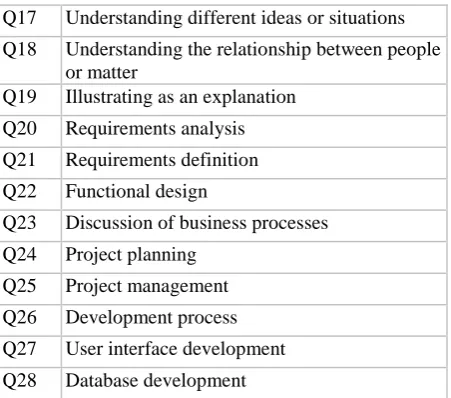
Learning effectiveness is the improvement in knowledge and skills as defined by the Information-technology Promotion Agency (IPA) common career skill framework based on the Skills Framework for the Information Age (SFIA). SFIA is the standard IT framework in Japan [21][22]. To measure this quantitatively, we asked students to complete the same questionnaire before and after the courses on a six-point scale in the system development course and the IT management course. However, in the open development course, students were asked to answer after the course only. This questionnaire contained 28 questions for the system development course and the open development course, and 40 questions for the IT management course. Table 1 shows the actual questions common to all courses. The first 19 questions measure the knowledge and skills of team management. The remaining questions measure the specific technical information system knowledge and skills (technical skill) of each course.
We defined learning effectiveness as the improvement in the questionnaire results according to the difference in the before and after questionnaires in the system development course and the IT management course. We defined learning effectiveness in the open development course as the post knowledge and skills in the questionnaire results according to the value of after questionnaires. The average of all team member’s learning effectiveness was used as the learning effectiveness of the team.
Table 1. Questionnaire items: Q1–Q19 are common to all courses while Q20-Q28 are specific to the system development course to measure team knowledge and
skills. NO. KNOWLEDGE AND SKILL
Q1 Planning
Q2 Preparing a presentation
Q3 Presenting
Q4 Communicating
Q5 Practical speaking
Q6 Asking relevant questions
Q7 Sharing information with the team
Q8 Applying problem-solving methods
Q9 Being independent
Q10 Involving others
Q11 Setting goal and actions
Q12 Analyzing the present situation and revealing goals or problems
Q13 Revealing processes for problem-solving
Q14 Being innovative
Q15 Clearly sharing ideas
Q16 Listening to others’ ideas
Q17 Understanding different ideas or situations
Q18 Understanding the relationship between people or matter
Q19 Illustrating as an explanation
Q20 Requirements analysis
Q21 Requirements definition
Q22 Functional design
Q23 Discussion of business processes
Q24 Project planning
Q25 Project management
Q26 Development process
Q27 User interface development
Q28 Database development
3. Methodology
This experiment targeted three actual academic lecture courses: system development course (SDC), IT management course (ITC), and open development course (ODC). Figure 2 overviews the experiment.
The system development course teaches management of software-intensive business systems development projects from the viewpoint of the provider. Students primarily learn about upper processes, (e.g., requirements analysis and architectural design) by working on a real project in a classroom setting.
The IT management course teaches knowledge and skills of IT management from the viewpoint of IT section personnel. Students primarily learn knowledge and techniques to develop management strategies, IT strategies, etc. from an experienced guest lecturer.
In the open development course, students work on the same project but are divided into six different teams: “Requirements”, “Engine”, “User Interface”, “Database”, “Quality”, “Assurance”, and “Usability”. All teams work together to produce a major software product using Scrum. Students determine the features, release plans, and progress themselves under the mentorship of the instructor. Each year, the system development course and the IT management course meet for five consecutive days and involve three 90-minute sessions at Waseda University. We gathered data annually between 2014–2016. On the other hand, the open development course occurred over 15 weeks in Spring 2016 at the State University of New York at Oswego. The experiment for the open development course was approved by the institution’s research ethics review board.
When we extracted the valid data (removing non-responders of the questionnaires or the teams with three or less students), the system development course divided 113 undergraduate computer science and engineering majors into 23 teams. The IT management course divided 61 undergraduate computer science and engineering students into 13 teams. The open development course divided 21
undergraduate Computer Science or Software Engineering majors and graduate Human-computer Interaction majors into 4 teams. Each team had 4–6 students. Students in all courses answered the questionnaires about FFM and learning effectiveness.
The students in the open development course used PBL, whereas students in the system development course and the IT management course worked on a controlled project in a classroom setting (controlled PBL). The system development course and the IT management course are offered at two Japanese governmental bodies (MEXT and IPA) as well as two IT companies (NEC and NEC Learning) in cooperation with Waseda University. Table 2 shows the features of each course. In the system development course, although students received the details about the function article, skills, and roles, students only created the deliverables of the upper process (no programming). In the IT management course, students received rough skills and instructions in classroom learning. Then they proposed an IT management strategy as a team. In the open development course, although students were divided into several teams, they worked as on large unit to develop an actual application.
Figure 2. Overview of the experiment
Table 2. Features of each course
ITEM SDC ITC ODC
Lengt h
5 consecutive days
5 consecutive days
15 weeks
Stude nts
113 undergrads
61 undergrads 21 undergrads and grads Teams 23 teams 13 teams 4 teams
Form Almost all practice
Classroom learning, practice, and presentation
Almost all exercises
Conte nt
Upper process of system development
IT business strategy consultant
Entire development process from requirements to
implementatio n and unit testing to acceptance testing Team
formation
Project (days or weeks)
Project ends
Learning effectiveness (SDC, ITC) FFM personality measurement
(SDC, ITC, ODC)
Questionnaire before project
4. Result and discussion
4.1. NEO-FFI and IPIP
Several students in the system development course and the IT management course answered both questionnaires NEO-FFI and IPIP. Table 3 shows the correlation value between NEO-FFI’s dimension value and IPIP’s dimension value. The results indicate the NEO-FFI data and the IPIP data can be compared.
Table 3. Correlation value between the NEO-FFI and IPIP dimensions (N=45) (***: P value < 0.001) Neurotic
ism
Extravers ion
Openness Agreeabl eness
Conscienti ousness
0.713 ***
0.791 ***
0.577 ***
0.570 ***
0.697 ***
4.2. Histogram of personality characteristic
and learning effectiveness
In the following, we use descriptive statistics to report the relative frequencies, and we compare the student characteristics and the perceived learning effectiveness. Figures 3–7 show histograms of the individual personality characteristics by course, where the X-axes reports the relative score of a personality characteristic or learning effectiveness and the Y-axis is the number of students. For example, in Fig. 3, the histogram of “Neuroticism” in the system development course indicates 35 students (Y-axis) have a neuroticism score between 25–30 (X-axis). The open development course has large values of personality characteristics because we used the IPIP questionnaire not NEO-FFI. Figures 8–9 show the histogram of individual student’s or team’s learning effectiveness in each course. Regardless of the course, the histograms of Neuroticism, Extraversion, and Openness have similar forms. On the other hand, the histograms of Agreeableness and Conscientiousness have slightly flat forms in the open development course. The personality characteristic distribution of Agreeableness and Conscientiousness may differ between Japan and United States in information system education courses. We also noted that some students in Waseda University attended both the system development course and the IT management course. Figures 8–9 reveal the following. In the systems development course, more students or teams have a low learning effectiveness than a high learning effectiveness. In the open development course, more students or teams have a middle learning effectiveness. The students and teams in the IT management course have the highest learning effectiveness of the three courses.
Figure 3. Histogram of Neuroticism in each course (left: SDC, center: ITC, right: ODC)
Figure 4. Histogram of Extraversion in each course (left: SDC, center: ITC, right: ODC)
Figure 5. Histogram of Openness in each course (left: SDC, center: ITC, right: ODC)
Figure 6. Histogram of Agreeableness in each course (left: SDC, center: ITC, right: ODC)
Figure 7. Histogram of Conscientiousness in each course (left: SDC, center: ITC, right: ODC)
Figure 8. Histogram of individual student’s learning effectiveness in each course (left: SDC, center: ITC, right:
ODC)
Figure 9. Histogram of team’s learning effectiveness in each course (left: SDC, center: ITC, right: ODC)
4.3. Individual learning effectiveness (RQ1)
Not all courses show a strong correlation between the five dimensions and learning effectiveness for individual students. In a previous work [10], individual values were not correlated to learning effectiveness. Thus, we focus the combination of personal characteristics within a team.
4.4. Team learning effectiveness (RQ2, 3,
4)
(1) Average value of characteristics
We classified the student teams into two groups: teams with a high learning effectiveness and teams with a low learning effectiveness. Then we used the overall average value of learning effectiveness. Table 4 shows the p value of the t-test for average of each personality characteristics in these two groups. In the table, “X_Manage” denotes the result in terms of the knowledge and skills of team management of the course “X”, while “X_Tech” denotes the result in terms of the specific technical knowledge and skills of the course “X”. There is a difference between the high and low technical learning effectiveness of the team’s average value of Openness in the IT management course. Figure 10 shows the team’s average technical learning effectiveness value of Openness in the IT management course by group. A low total value of Openness has a positive impact on learning effectiveness. The system development course and the open development course are indicative of the relevance for the Openness personality characteristic for early-stage development processes such as requirements analysis and architecture design. However, there is no such effect in the IT management course, which has more classroom learning time. In fact, the learning effectiveness of the team management skill of the IT management course (i.e., ITC_Manage) has the lowest correlated value, while the learning effectiveness of the information system technical skill of the IT management course (i.e., ITC_Tech) is the highest correlated value. The average value is not strongly correlated to learning effectiveness in the system development course and the open development course. Moreover, whether every team member has a high or low value does not affect learning effectiveness. There is also a low correlation between
learning effectiveness and simply having a high or low average characteristic. For an individual, it may be important that one characteristic is higher (or lower) than the average for a high learning effectiveness.
Table 4. P value of the t-test for team average personality and learning effectiveness between high or low learning
effectiveness teams group (*: P value < 0.1)
SKILL N_AV
G
E_AV G
O_AVG A_AV G
C_AV G SDC_Ma
nage 0.874 0.775 0.596 0.967 0.263 SDC_Tec
h 0.796 0.237 0.848 0.296 0.743 SDC_Tot
al 0.846 0.430 0.562 0.548 0.547 ITC_Man
age 0.490 0.291 0.676 0.531 0.784 ITC_Tec
h 0.894 0.204
0.0887
* 0.695 0.853
ITC_Tota
l 0.984 0.732 0.294 0.753 0.774 ODC_Tot
al
0.647 0.691 0.864 0.768 0.343
Figure 10. High or low learning effectiveness team’s average value of Openness in the IT management course
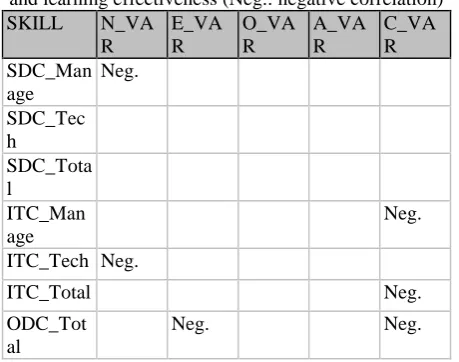
(2) Variance value of characteristic
Table 5 shows the p value of the t-test for each value of the personality characteristics between the high learning effectiveness group and the low learning effectiveness group. There are several differences between the high and low technical learning effectiveness variance: Neuroticism for the IT management course’s technical learning effectiveness, Extraversion for the open development course, and Conscientiousness for the open development course.
correlations: Neuroticism for the system development course’s management learning effectiveness and the IT management course’s technical learning effectiveness, Extraversion for the open development course, and Conscientiousness for the IT management course’s management learning effectiveness, the system development course and the open development course.
Table 5. P value of t-test for team variance personality and learning effectiveness (**: P value < 0.05, *: P value
< 0.1)
SKILL N_VA
R
E_VA R
O_VA R
A_VA R
C_VA R SDC_Mana
ge
0.118 0.250 0.668 0.629 0.935
SDC_Tech 0.799 0.504 0.273 0.405 0.440
SDC_Total 0.154 0.427 0.958 0.828 0.854
ITC_Manag e
0.65 0.585 0.373 0.468 0.347
ITC_Tech 0.0400 **
0.599 0.597 0.966 0.275
ITC_Total 0.172 0.821 0.227 0.396 0.428
ODC_Total 0.441 0.0106 **
0.222 0.627 0.0818 *
Table 6. Relationship between team variance personality and learning effectiveness (Neg.: negative correlation)
SKILL N_VA
R
E_VA R
O_VA R
A_VA R
C_VA R SDC_Man
age
Neg.
SDC_Tec h
SDC_Tota l
ITC_Man age
Neg.
ITC_Tech Neg.
ITC_Total Neg.
ODC_Tot al
Neg. Neg.
(3) Effect of Neuroticism
Neuroticism contains the degree of the stress reaction. In the system development course and the IT management course, teams with a low variance represent a good team, suggesting that teams with the same level of Neuroticism are suitable for team cooperation in a discussion lecture. This impact is strong in the management skill of the system development course and in the technical skill of the IT management course because such skills are important to the course formats. Teams comprised of individuals with similar Neuroticism values have lively discussions. In these cases, the knowledge discovery process may be hindered in some individuals.
On the other hand, Neuroticism is not correlated with learning effectiveness. This may be due to two reasons. First, the course focuses on an exercise and not discussions. Teams comprised of individuals with similar N values are good for discussions. In the open development course, a team’s work products relied mainly on code completion and feature addition under time pressure and not so much on group discussion. This may have increased the reported Neuroticism levels while simultaneously hindering learning effectiveness in some individuals. Second, there may be a cultural difference between students in Japan and the United States as previously reported in [23] and confirmed herein.
(4) Effect of Extraversion
An Extroverted personality is out-going and seeks to interact with others. In the open development course, teams with a low variance in the Extraversion value represent a good team. However, in the system development course and the IT management course, learning effectiveness is not correlated with Extraversion. In previous studies [10][11], we confirmed that a team is good in the system development course and the IT management course when the variance is high. This impact of Extraversion may be explained by the purpose of the class. The open development course’s purpose is to develop incremental artifacts of a sellable product. In the instructor’s experience, very extroverted individuals tend to take charge of a team. They become the leaders and initiate team discussions. In such a situation, the knowledge discovery process may be hindered in some individuals. On the other hand, both the system development course and the IT management course encourage discussions and thought exchanges, thereby allowing other students to learn from discussion leaders.
(5) Effect of Openness
A high degree of Openness means being non-traditional and accepting of new ideas. In all courses, there is no correlation with the variance of Openness. The Openness value often affects the problem-solving ability of the information systems projects. However, Openness may not affect learning effectiveness of the teams in the information systems education courses.
(6) Effect of Agreeableness
Agreeableness describes an individual’s degree of altruism and kindness towards others. Being too agreeable is usually indicative of avoiding discussions. There is no correlation in any course regarding the variance value of Agreeableness. This fact is surprising because Agreeableness and Extraversion strongly affect communication. This finding may suggest that Extraversion is more influential on the team communication in information system team education courses than Agreeableness.
(7) Effect of Conscientiousness
Conscientious people have a sense of purpose and are strong-willed. In the IT management course and the open development course, a low variation in the Conscientiousness value is good for learning effectiveness. The amount of effort required in a lecture course may depend on the degree of detailed skills or instruction. Because students’ burden is large in the IT management course, similar values of conscientiousness may distribute the burden fairly among team members, realizing a better team.
4.5. Threats to validity
This research data was acquired using questionnaires, which were subjectively answered by students. Thus, spurious estimations and insincere responses are the threats to the internal validity. To resolve this, more quantitative methods that do not burden educators and students are necessary.
Another threat to the internal validity is sample dataset. For almost all of the data, the box-plot’s notch is bigger than the box. Due to the duration of data collection, whether the results are time specific or universal cannot be currently verified. In the future, additional data should be acquired and analyzed.
A threat to the external validity is that we have insufficient evidence to apply these results to other similar practical lectures. However, the courses used in this research have been developed as part of a nationwide effort in collaboration. Therefore, we deduce that similar courses should yield comparable findings.
5. Conclusion
We surveyed the correlation of students’ five factor model personality and learning effectiveness, which is the amount of increase in team management or technical knowledge, and skill, which is the IPA common carrier skill framework based on SFIA. This paper targeted three actual courses: a System Development Project course, an IT Management Project course, and an Open Application Development Project course. In each course, students learn content via different lecture formats. Overall, 206 students were divided into 42 teams.
We examined the relation between the student’s personality characteristics according to FFM and learning effectiveness in the three team-activity lecture courses. The results show that although individual characteristics are not strongly correlated to learning effectiveness, there are a few strong team correlations. In addition, one’s learning effectiveness has a low correlation to simply having a high or low characteristic value. However, one’s learning effectiveness has a high correlation to having a higher or lower characteristic value than the team’s average characteristic value. The interesting aspects of the team correlations may be related to the course style (discussion, practice, or exercise).
Because software engineering is a creative process, learning with other students is beneficial. The relationship between characteristic and learning effectiveness is important for teams in information system education courses at a university because the act of learning is important for students. This study provides the instructors and teaching assistants with the more effective method to educate computer engineering students at the university level.
In the future, we plan to acquire more data to remove the threats to validity. In this study, we focused on the impact of an individual personality dimensions on learning effectiveness and each personality dimensions. Additionally, we intend to focus on combined personality dimensions (for example, low Extraversion and high Openness) to evaluate learning effectiveness of a team. We also invite other researchers to join our inquiry and broaden the dataset in order to improve comparability and universality of our results.
References
[1] M. Shuto, H. Washizaki, Y. Fukazawa, S. Yamato, M. Okubo and B. Tenbergen, “Relationship Between the Five Factor Model Personality and Learning Effectiveness of Teams in Three Information Systems Education Courses,” 18th IEEE/ACIS International Conference on Software Engineering, Artificial Intelligence, Networking and Parallel/Distributed Computing (SNPD), June 26-28, 2017 [2] M.J. Terrón-López, M.J. García-García, P.J.
Velasco-Quintana, M.C. Gaya-López, and J.J. Escribano-Otero, “Design and Implementation of a Comprehensive Educational Model: Project Based Engineering School (PBES),” International Journal of Engineering Pedagogy, iJEP ‒ Volume 5, Issue 3, 2015.
[3] M. Jazayeri, “The education of a software engineer,” in Proceedings of the 19th International Conference on Automated Software Engineering, Linz, Austria, 2004, pp. 18-27.
[4] C. R. Paris, E. Salas, and J. A. Cannon-Bowes, "A Teamwork in Multiperson Systems: a Review and Analysis," Ergonomics (Taylor & Francis) 43, no. 8, 2000, pp. 1052-1075.
[5] M. Hoeg, and H. G. Gemuenden, “Teamwork Quality and the Success of Innovative Projects: A Theoretical Concept and Empirical Evidence,” Organization Science (JSTOR) 12, 2011, pp. 435-449.
[6] G. Klein, J.J. Jiang, D.B. Tesch, “Wanted: Project teams with a blend of IS professionals orientation,” Communications of the ACM, Vol.45, No.6, 2002. [7] R. Feldt, L. Angelis, R. Torkar, and M. Samuelsson, “Links
between the personalities, views and attitudes of software engineers,” Information and Software Technology, vol52, Issue 6,pp.611-624, June, 2010.
[8] M.V. Kosti, R. Feldt, L. Angelis, “Personality, emotional intelligence and work preferences in software: engineering: An empirical study,” Information and Software Technology, vol56, Issue 8, pp.973-990, August 2014. [9] Y. Sunaga, H. Washizaki, K. Kakehi, Y. Fukazawa, S.
Courses”, IEEE Transactions on Emerging Topics in Computing, Vol.5, No.1, pp.69-76, 2016.
[10] M. Shuto, H. Washizaki, K. Kakehi, Y. Fukazawa, S. Yamato, and M. Okubo, “Learning Effectiveness of Team Discussions in Various Software Engineering Education Courses”, CSEE&T2016, pp.227-231, 2016.
[11] Y. Yamada, S. Inaga, H. Washizaki, K. Kakehi, Y. Fukazawa, et al., “The Impacts of Personal Characteristic on Educational Effectiveness in controlled-Project Based Learning on Software Intensive Systems Development,” 27th IEEE Conference on Software Engineering Education and Training, CSEE&T 2014. pp.119-128, April, 2014. [12] R.R. McCrae, R. R. and O. P. John, “An Introduction to the
Five-Factor model and its application,” Journal of Personality, vol. 60, Issue 2, pp.175-215, 1992.
[13] N. Salleh, E. Mendes, and J. Grundy, “An Empirical Study of Effects of Personality in Pair Programming using the Five-Factor Model.” Empirical Software Engineering and Measurement, Proc.3rd International Symposium on Empirical Software Engineering and Measurement (ESEM 2009), pp. 214-225, 2009
[14] A. R. Peslak, “The Impact of Personality on Information Technology Team Projects,” Proc. the 2006 ACM SIGMIS CPR: Forty four years of computer personnel research: achievements, challenges & the future, pp.273-279, 2006. [15] G. Klein, J.J. Jiang, and D.B. Tesch, “Wanted: Project
Teams with a Blend of IS Professional Orientations,” Communications of the ACM, vol. 45, No. 6, pp. 81-87, 2002.
[16] Y. Shimonaka, K. Nakazato, Y. Gonda, and M. Takayama, “NEO-PIR, NEO-FFI Manual for the Japanese Version Revised and enlarged edition”, Tokyo Shinri, Inc., 2011 [17] P.T.Jr. Costa, and R.R. McCrae, “Still stable after all these
years: personality as a key to some issues in adult-hood and old age.”, Life span development and behaviour, Vol 3, pp.65-102, 1980.
[18] IPIP Collaboratory, “International Personality Item Pool”, 2016, http://ipip.ori.org/
[19] IPIP Collaboratory, “Multi-Construct IPIP Inventories”, 2016, http://ipip.ori.org/newMultipleconstructs.htm [20] M. Nakayama, and IPIP Collaboratory, “Japanese
Translation of the Lexical Big-Five Factor Markers”, http://ipip.ori.org/JapaneseBig-FiveFactorMarkers.htm [21] Ministry of Economy, Trade and Industry &
Information-Technology Promotion Agency, Japan (IPA), “Common career/ skill framework,” 2012, http://www.ipa.go.jp/english/humandev/reference.html.. [22] B.R. von Konsky and A. Jones, C. Miller, “Visualising
Career Progression for ICT Professionals and the implications for ICT Curriculum Design in Higher Education,” ACE ’14, 2014.
[23] R. Lynn, S. L. Hampson, “National Differences in Extraversion and Neuroticism.” British Journal of Clinical Psychology vol. 14, No. 3, pp. 223-240, 1975