Study and Analysis of GNSS Signals using In-house
Developed Interference Tool
Deepak Mishra
Optical and Digital
Communication
Group (ODCG),
Space Applications Centre
(SAC)
Ram Prabu Ganesan
Indian Institute of
Space Science and
Technology,
Trivandrum, India
Alak Banik
Optical and Digital
Communication
Group (ODCG),
Space Applications Centre
(SAC)
ABSTRACT
Interference analysis of navigation signals belonging to the same group and with the signals of the satellites belonging to other groups is an important parameter that must be considered while designing a GNSS receiver and for introducing a new signal for any GNSS satellite. Troposphere and ionosphere are the layers of the atmosphere which affect the GNSS signals by creating delays and scintillations. Multipath is one of the major cause which creates maximum error budget at the receiver side of the GNSS system. The error budget differs with the type of correlator that is used. The number of navigations satellites and the services provided by them are increasing fast increasing the interference with other signals. So for this reason analysis of the interference of the signal using C/N0 degradation measurement [ITU recommendation M.1831] and the effect of troposphere, ionosphere and multipath on various signals is necessary. In this paper, an attempt has been made to develop a tool for interference analysis of the various GNSS signals, using this tool this paper analyses the degradation of the IRNSS signals due to troposphere, ionosphere and multipath effects of the GNSS signals.
Keywords
PSD, GNSS, C/N0, IRNSS, GPS, RMS
1.
INTRODUCTION
Global Navigation Satellite System includes network of earth orbiting satellites that broadcast signals used in positioning, navigation and timing services, anywhere on the surface of earth. Today two core global navigation satellite systems (GNSS) namely, United States’ Global Positioning System (GPS) and the Russian Global Navigation satellite System (GLONASS) are fully operational and the European navigation satellite system GALILEO and Beidou (China) are currently under development. Many regional navigation satellite systems such as IRNSS (India) and QZSS (Japan) are in the process of development. In addition to these, there also exists many satellite based augmentation systems like GAGAN from India, WAAS from United States of America and EGNOS by European Space Agency.
With the increase in number of navigation signals day by day, the performance assessment of existing and planned GNSS signals becomes necessary from compatibility and interoperability [1] point of view.
Interference analysis is being carried out by various GNSS service provider. F. Soualle et al [2] and S. Wallner et al [3]
presented the interference analysis between GPS and Galileo signals. Similarly RAN Yi-hang et al [4] presented the details interference analysis between Galileo and Compass navigation systems. There is various other literatures also, where a detailed interference analysis between various GNSS systems is presented [5].Wei Liu et al. in [5] and Stefan Wallner et al. in [14] present a methodology to determine the C/N0 degradation of a desired signal by the inter and intra system interference. The effective carrier- power-to-noise-density ratio denoted as effective C/N0 is used to indicate the effect of the interference on the signal-to-noise-plus-interference ratio of both coherent and non coherent outputs. ITU recommendation M.1831 el at.[17] gives the formula for total degradation of a signal in dB.
Troposphere causes delay in the signals of GNSS according to Hofmann-Wellenhof and Lichtenegger and Wasle [1] are attenuated and delayed due to refraction and the troposphere (troposphere and stratosphere together) acts as a non dispersive medium for GNSS bands. It is also mentioned that the ionosphere (ionized layer) gives scintillation and delay in the signal of GNSS.
Hofmann-Wellenhof and Lichtenegger and Wasle [1] have given a basic model for the phase and amplitude change for any signal for one reflection and have also given a method for deriving the multipath error envelope for narrow correlator.
2.
INTERFERENCE SOFTWARE
2.1
Parameters under consideration:-
2.1.1 Carrier Power to noise density ratio:-
According to Wei Liu et al. in[5] and Stefan Wallner et al. in[14] the formula used to assess the C/N0 for a signal interfering with other is given by
C N0 =
C Gs f df
βr 2 −β2r
N0 Gs f df +Cl Gs f Gl f df
βr 2 −β2r
βr 2 −β2r
--- (1)
Where Gs f is the normalized power spectral density. C is the received power of the useful signal. N0 is the power spectral density of the thermal noise. Gl f is the normalized spectral density of the interfering signal. Cl is the received power of the interfering signal. 𝔓r is the receiver front end bandwidth.
C N0 =
C
N0+ Ki Ci ,j j=1
Gs f Gl f df
βr 2 −β2r
Gs f df
βr 2 −β2r M
i=1
--- (2)
Ci, j is the received power of the jth interfering signal by the ith satellite .
As per ITU Recommendation M.1831 [17], the total signal to noise degradation experienced by user in the presence of another interfering signal is given by:-
ΔdB = 1 +NO +POIO dB
--- (3)
Where No is the thermal noise floor, Po is intra system Interference, and Io is the external interference. The external interference level is calculated as
Io[dB/Hz]=Gagg[dB]+Pmax[dBW]+SSC[dB/Hz] +Lx[dB] --- (4)
Gagg is the aggregate gain taking into account the interference introduced by all the satellites of one system in view. Pmax is the maximum user receive power, SSC is spectral separation coefficient between interfering and the desired signals. Lx is the processing loss.
2.1.2
Tropospheric refraction:-
The effect of troposphere and stratosphere (collectively called as troposphere by GNSS community or as non ionized part) is denoted by the Tropospheric path delay due to the refraction. The neutral atmosphere is a non dispersive medium up to 30 GHz according to [1]. The tropospheric path delay is given by [1] as
ΔTrop = n − 1 ds --- (5) Where n is the refractive index of troposphere. Taking N = 106(n-1). According to Hopfield HS [7] the Tropospheric refractive index and the delay can be divided into two components Ndrytrop and Nwettrop due to the dry and wet components of the atmosphere respectively. The method for finding zenith delay due to dry and wet components is given by [7] as
Kdry = 155208 × 10−4× Pamb ×
(40136 +148.72×Tamb ) (Tamb+273.14) −(6)
and
Kwet = −0.287 × Pvap (Tamb+273.16) +
8307 .2×Pvap
(Tamb+273.16)2 − −----(7)
Kdry and Kwet are the zenith dry and wet delays. Pamb is the
ambient pressure, Tamb is the ambient temperature and Pvap is
the vapor pressure. The total delay is given by the formula
Δtrop =
Kdry
sin( (El2 2+ 1.904 × 10⁻³)
) + Kwet
sin( (El2 2+ 1.904 × 10⁻³
))− −(8) El is the elevation angle of the satellite in radians.
According to Saastamoinean J [8] taking into consideration all the gas laws and considering many approximations the Tropospheric delay can be derived as
Δtrop =0.002277cos z × p + 1255T + 0.05 e − B (tan z)2 − (9)
2.1.3
Friis Transmission Formula:-
The loss through the atmosphere follows the Friis transmission formula, which is given by
L0= c 2πρf
2
and Latm = kL0 ---(10)
Where ρis the distance from satellite to receiver and k varies from 0 to 1 depending on the condition of atmosphere.
2.1.4
Ionospheric Refraction
The ionosphere is the electrically charged component of the higher atmosphere. It consists of variety of charged, free and neutral particles in it. This layer is subdivided into many layers. The ionosphere refraction is modeled as a function of the total electron content (TEC) of the atmosphere.
The phase refractive index of the GNSS signals as
nph = 1 + c2 f2+
c3
f3+ … …
The quantities c2, c3 ,… do not depend on frequencies but on
the number of electrons per cubic meter. The approximation is done till the quadratic term only.
The group refractive index of the ionosphere is given by
ngr= 1 − c2
f2 where c2= −40.3Ne
By using the Fermat’s Principle we get the for delay is calculated as
Δ𝑝𝐼𝑜𝑛𝑜 = −40.3𝑓2 𝑁𝑒 𝑑𝑠0 and
Δ𝑔𝑟𝐼𝑜𝑛𝑜 = 40.3
𝑓2 𝑁𝑒 𝑑𝑠0 --- (11)
According to Klobuchar [9] the delay through the ionosphere can be calculated without directly calculating the TEC by using a simple algorithm as shown below
𝜓 = 0.0137 𝐸 + .11 − 0.022
E is the elevation angle and 𝜓 is the earth center angle.
𝜑𝐼= 𝜑𝑢+ 𝜓 cos 𝐴
𝜆𝐼= 𝜆𝑢+ψ
sin A cos 𝜑𝐼
𝜑1, 𝜆𝐼are the sub ionospheric latitude and longitude, A is the
azimuth angle, 𝜑𝑢, 𝜆𝑢 are the latitude and longitude of the
receiver.
𝑡 = 4.32 × 10⁴𝜆 𝐼+ 𝑡𝑖𝑚𝑒
If t>86400 then t = t-86400 if t<0 t = t+86400. The slant factor F is given by
𝐹 = 1 + 16(.53 − 𝐸)3
𝜙𝑚= 𝜑𝐼+ 0.064 × cos(( 𝜆𝐼− 1.617) × 𝜋)
𝑃𝐸𝑅 = 𝛽𝑛𝜙𝑚𝑛 3
𝑛=0
If PER < 72000 then PER = 72000
𝐴𝑀𝑃 = 𝛼1+ 𝛼2. 𝜙𝑚+ 𝛼3𝜙𝑚2 + 𝛼4𝜙𝑚3
𝑇𝑖𝑜𝑛𝑜 = 𝐹 × 5 × 10⁻⁹× 𝐴𝑀𝑃
𝑇𝑖𝑜𝑛𝑜 = 𝐹 × 5 × 10⁻⁹× 𝐴𝑀𝑃 × 1 −
𝑋2
2 + 𝑋4
4
According to [16] the Global Ionospheric Scintillation Model (GISM) is a model accepted by the International Telecommunication Union (ITU).
The TEC ionospheric maps are available online and it can be used to get the electron content in any point on the world at any particular time. So this data can be obtained and can be used to get the delay profile of the signals in various bands.
Δ𝑝𝐼𝑜𝑛𝑜 = −40.3
𝑓2 . 𝑇𝐸𝐶 --- (12)
2.1.5
Multipath Analysis
The multipath is a phenomenon where by a radio signal arrives at a receiver via two or more possible paths. Even though these signals have a common time origin at the transmitter they reach the receiver with different phases and different amplitudes.
Some methods suggested for removing the multipath effects are
Model the multipath understand its pattern and correct the error.
Design an antenna which has smaller side lobe.
The multipath performance of a navigation signal is to be considered while proposing a new GNSS signal. This is because multipath cannot be easily modeled and it differs largely from one place to another. A multipath error envelope is used to evaluate the multipath performance of a signal this gives the graph of the correlator versus the path delay. The various factors which affect the multipath error are:
Signal type, modulation scheme of the signal and the chipping rate of the code.
Band width of receiver and the type of filter that is used.
Number of multipath signals and the signal attenuation due to the reflection.
Chip spacing using between the correlator used for tracking.
The delay of multipath signals with respect to line of sight signals and type of correlator used.
According to Hofmann-Wellenhof , Lichhtenegger and Wasle [1] the method to find the multipath error envelope is described below
𝑠𝑟 𝑡 = 𝑠𝑑(𝑡) + 𝛽𝑠𝑚(𝑡 + 𝜏𝑚) --- (13)
𝑠𝑑 𝑡 is the direct line of sight signal and 𝑠𝑚(𝑡) is the delayed
multipath signal.
𝑅𝑟 𝜏 = 𝑠𝑑 𝑡 𝑠𝑙 𝑡 + 𝜏 𝑑𝑡 + 𝛽𝑠𝑚(𝑡 + 𝜏𝑚 𝑇
0 𝑇
0
)𝑠𝑙 𝑡 + 𝜏 𝑑𝑡
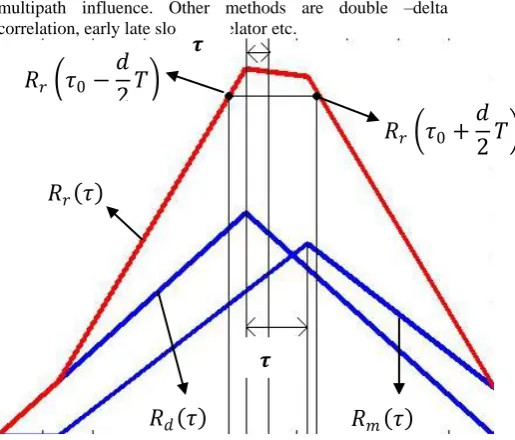
= 𝑅𝑑(𝜏) + 𝑅𝑚(𝜏)
𝑠𝑟 𝑡 is correlated with the locally generated signal 𝑠𝑙(𝑡). The
resultant autocorrelation function is the sum of autocorrelation function of the line of sight signal and the reflected signal. The narrow correlation spacing is one method to decrease the
multipath influence. Other methods are double –delta correlation, early late slope correlator etc.
Figure 1 – Autocorrelation function of direct, reflected and the total signal
The multipath error envelope has some limitations which are it takes into consideration only one reflected signal. It does not take the channel into consideration. The error envelope varies with the type of the correlator used. The weighted multipath error envelope gives a more realistic view on the multipath performance, a statistical channel model is used to scale. Here the consideration that the short delay multipath occurs more frequently than the long delay ones.
𝜌 𝜏 =𝜏01𝑒−𝜏𝜏0 (14)
𝐴 𝜏 = 𝑎0𝑒 −𝜏
2𝜏0 − − − − − − (15)
𝜌 𝜏 models the multipath delays and 𝐴 𝜏 models the multipath amplitudes. Combining these two we get the equation as
𝐸′ 𝜏 = 𝐸 𝜏 . 𝑒−3𝜏2𝜏0 ---(16)
𝐸 𝜏 is the multipath error envelope got by using any correlator. 𝜏0 is the code tracking error, 𝝉 is the path delay and
a0 is normalized amplitude.
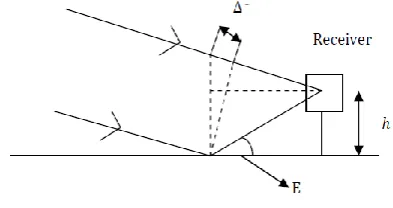
As mentioned in [1] ,we can model the multipath by considering the most simple case of single reflection from the ground as shown in figure 2.
So direct signal can be represented as
Sigdirect =a* sin 𝜑
and reflected signal can be represented as
Sigreflected=𝛽*a*sin 𝜑 + 𝛥𝜑
Using superposition of the signals, we are getting
tan(Δ𝜑𝑚) = 𝛽 sinΔ𝜑
1+cosΔ𝜑 --- (17)
𝛽𝑚= (1 + 𝛽2+ 2𝛽𝑐𝑜𝑠Δ𝜑) 2
--- (18)
Where Δ𝜑 is the phase shift due to path delay, 𝛽 is the damping factor and 𝛽𝑚 is the factor by which the resultant
𝝉
0
𝝉
m
𝑅
𝑟𝜏
0+
𝑑
2
𝑇
𝑅
𝑟𝜏
0−
𝑑
2
𝑇
𝑅
𝑚𝜏
𝑅
𝑑𝜏
𝑅
𝑟𝜏
amplitude is increased or decreased. This is the simplest model of the multipath
Figure-2 The geometry of multipath
3.
OBSERVATIONS
3.1
Results on tropospheric delay
Byalalu is the place in Karnataka, India where the ISRO Navigation Center is present and this is the center which sets all the navigation parameter and acts as the nerve center for the IRNSS ground segment.
The climatic conditions in Byalalu is like
Temperature average = 300C
Pressure average = 1016 hPa
Dew point at the place = 150C
The IRNSS space segment consists of a constellation of seven satellites: three (Geostationary Orbit) GEOs located at 34° E, 83° E and 131.5° E and four (Inclined Geosynchronous Orbit) IGSOs at an inclination angle of 29° placed two each at with equator crossing at 55° and 111° East. The vapor pressure got from dew point is 17.06hPa.
The latitude and longitude of Byalalu is 12.5971° N, 77.3418° E. The elevation angle for each satellite is calculated approximately as follows
34° E satellite - 0.6429 rad
83° E satellite – 1.2880rad 131.5° E satellite – 0.47324 rad
When the GSO satellites cross the equator 55°E satellite – 1.0507 rad
111°E satellite – 0.84795 rad
Table 1 showing the longitude of IRNSS satellites at Byalalu near the equator and their elevation angles from
INC
Satellite type
Longitude closing at the equator(°E )
Elevation angle (rad)
Geostationary(GEO)
32.5 0.6429
83 1.288
131.5 0.4724
Geosynchronous(IGSO)
55 1.0507
111 0.84795
Table 2 showing the delay measured due to troposphere for the IRNSS satellites, in the order as given in table 1, at
INC
Delay measured (meters)
Hopfield Saastamoinen
Chao's mapping function
3.9681 3.9658 3.3297
8.1849 8.2914 6.97
5.1849 5.2146 4.3846
2.7772 2.7438 2.3
3.1961 3.1736 2.6652
3.2
Results of Ionospheric delay.
Table 3 showing the longitude IRNSS satellites near the equator, their elevation and azimuthal angles from INC
calculated
satellite type longitude at the
equator(°E )
elevation angle
(rad)
Azimuthal angle(rad)
Geostationary (GEO)
32.5 0.6429 4.4968
83 1.288 2.7148
131.5 0.4724 1.728
Geosynchronous (IGSO)
55 1.0507 4.22495
111 0.84795 1.88692
Table 4 showing the delay measured due to ionosphere for the IRNSS satellites, in the order as given in table 3, at
INC by using TEC maps calculated by GUI
delay measured (meters)
L1 L2 L5 S
10.1 24 26 5.8
8.2 13.5 14.5 3.27
10.9 17.8 19.5 4.33
9.8 16.3 17.6 3.96
8.6 14.3 15.5 3.47
3.3
Results of C/N0 degradation
The degradation in C/N0 is basically a degraded C/N0 value at which receiver will work away from theoretical value. In order to calculate C/No degradation of IRNSS signal due to other GNSS signal, table 5 shows the major parameter of existing GNSS signals taken for calculation.
Table 5 Parameter taken into the GUI to calculate the C/N0 degradation
inputs taken(all are in dB or dB/Hz)
Gagg Pmax Noise processing loss
GPS -11 -136
-201 40
Galileo -11 -136
Compass -11 -136
QZSS -11 -136
Glonass -11 -136
Table 6 – table showing the total C/N0 value from the GUI for all IRNSS signals in dB/Hz
Signal of IRNSS C/N0 DEGRADATION in dB/Hz
GPS COMPASS GALILEO QZSS
L1
*MBOC(6,1,11) 5.6 3.0 - -
*BOC(12,2) .45 .35 - -
*BOCcos(12,2) .26 .39 - -
L5 BOC(5,2) 1.02 .59 .52 1.05
BPSK(1) .61 .79 .28 .62
S BOC(5,2) - 4.15 - -
BPSK(1) - 4.16 - -
*Proposed candidate in L1 Band
3.4
The results of multipath effects
The multipath error envelope obtained by using the method as described above is displayed here.
(M
e
te
r)
Figure-3 The multipath error envelope [in meters] versus the path delay in meters
4.
NEW SIGNAL EXPLORATION
4.1
New signal in L1 Band
MBOC modulation can be considered as an ideal candidate for new IRNSS signal in L1 band. The reason behind selection of MBOC modulation scheme is as follows:-
From Compatibility and interoperability point of view as GPS, GALILEO and COMPASS is already using MBOC modulation.
Flexibility as MBOC modulation is combination of BOC (1, 1) and BOC(6,1) ,so in case of large interference more power will be given to BOC(6,1) modulation scheme for more reliable tracking. Flexibility in receiver design as simplest receiver
can use only BOC(1,1) for tracking purpose, while complex receiver use both BOC(6,1) and BOC(1,1) for tracking purpose.
Since MBOC is already transmitted by GPS, GALILEO and COMPASS, this signal has a larger C/N0 degradation than other signals.
MBOC can be implemented using other power sharing like MBOC(6,1,2/11) or
MBOC(6,1,3/11) instead of MBOC(6,1,1/11), so their C/N0 degradations are seen by using the GUI.
The result can be seen in the table shown below for a 30 MHz front end receiver bandwidth.
Table 9 – Table showing the total C/N0 value from the GUI for various MBOC modulations in dB/Hz for L1
band.
Signal C/N0 degradation
MBOC(6,1,1/11) 5.4
MBOC(6,1,2/11) 5.5
MBOC(6,1,3/11) 5.52
MBOC(6,1,4/11) 5.6
MBOC(6,1,5/11) 5.6
4.2
New signal in L5 Band
AltBOC (15, 10) is considered to be a one of the prominent candidate for future IRNSS signal in L5 band. AltBOC modulation, similar to BOC modulation provides high spectral isolation between the two upper main lobes and the two lower main lobes (considering the I and Q phases separately). This is accomplished by using different codes for each main lobe. The reason behind the selection of AltBOC modulation for IRNSS in future L5 band is as follows:
From Compatibility and interoperability point of view as GALILEO and COMPASS is already using AltBOC (15, 10) modulation.
Since AltBOC is already transmitted by GALILEO and COMPASS this signal has a larger C/N0 degradation than other signals.
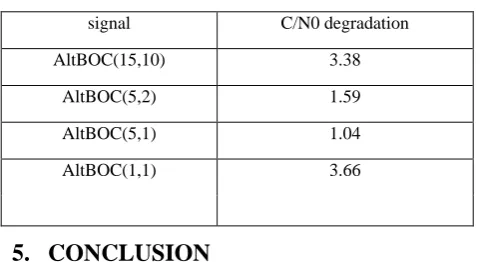
AltBOC can be implemented using other power sharing like AltBOC (5,2) or AltBOC(5,1) so their C/N0 degradations are seen using the GUI.
The result can be seen in the table shown below for a 30MHz front end receiver bandwidth.
Table 10 – table showing the total C/N0 value from the GUI for various AltBOC modulations in dB/Hz for L5
band.
signal C/N0 degradation
AltBOC(15,10) 3.38
AltBOC(5,2) 1.59
AltBOC(5,1) 1.04
AltBOC(1,1) 3.66
5.
CONCLUSION
The troposphere is a non-dispersive medium for the GNSS signals and it causes delay due to refraction and attenuation. Several models were proposed and various modifications are also done to them. The original Hopfield and Saastamoinen models are still fairly good methods to find the delay and their values are very close to each other. This delay can also be found using several mapping functions with certain limitations on the elevation angle and result of one such function is shown here. Ionosphere is a dispersive medium for GNSS signals. The Klobuchar method used to find ionospheric delay in GPS is used to calculate the delay over India (by using the GUI) and it is concluded that this method is not accurate over the Indian region. Hence by taking in the live TEC values delay due to ionosphere is calculated over India. It gives a fairly accurate value of delay due to ionosphere for the IRNSS signals.
Multipath error envelope obtained is not accurate as it is not filtered but it gives a rough idea about the multipath performance as the BOC (m,n) signals give a better multipath resistance as the value of m and n increases and this can be seen from the diagram. The MBOC signal, which is expected to be transmitted from IRNSS in L1 band, which uses the combination of both BOC(6,1) and BOC(1,1) has better multipath resistance than the others signals .This is also the case with AltBOC(15,10) which is expected to be transmitted in L5 from IRNSS. In case of BPSK signals as the chip length decreases the multipath performance improve. The MBOC is the expected signal in L1 band it has lot of advantages like compatibility and usage of multiple modulation schemes in a signal (BOC (1, 1) and BOC (6, 1)) but this has a major disadvantage of larger C/N0 degradation as this signal is transmitted by other systems also, found by using both GUI and experiments. So a highly sensitive receiver with Pmax nearly -100 dBW and much lower processing loss must be used for improving the C/N0 performance. The same is the case with AltBOC (15,10) in the L5 band. Other modulations of AltBOC like AltBOC(5,2) or AltBOC(1,1) can be used as they have better C/N0 degradation.
6.
REFERENCES
[1] Hoffmann-Wellenhof, Lichtennegger, Wasle, “GNSS Global Navigation Satellite Systems GPS, GLONASS, Galileo & more”, SpringerWeinNewYork.
[2] Simon Haykin, “Digital Communications”, John Wiley
& Sons (Asia) Pte Ltd.
[3] John W. Betz, “Binary Offset Carrier Modulations for Radio navigation”, The MITRE Corporation, Bedford,
Massachusetts Received September 2001; Revised March 2002.
[4] Gunter W Hein, Markus Irsinger, Jose Angel Avila radriguez and Thomas Pany, “Performance analysis of L1 Galelio Signals”, Institute of Geodesy and
Navigation, University FAF Munich, Germany.
[5] Wei Liu, Yuan Hu, Xingqun Zhan, and Chuanrun Zhai, “Assessing Radio Frequency Compatibility between Galileo and Compass”, Defence Science Journal, Vol.
61, No. 6, November 2011, pp. 545-553, DOI: 10.14429/dsj.61.285.
[6] José Ángel Ávila Rodríguez ,” Doctoral Thesis On Generalized Signal Waveforms for Satellite Navigation”,
Munich, June 2008.
[7] Hopfield HS (1969), “Two quadratic tropospheric refractivity profile for correcting satellite data”, Journal
of Geophysical Research, 74(18):4487-4499.
[8] Saastamoinen J (1973), “Contribution to the theory of atmospheric refraction”, Bulletin Geo-desique,
107:13-34.
[9] Klobuchar J (1986), “Design and characteristics of the GPS ionospheric time delay algorithm for single frequency users”, Proceedings of PLANS’86-position
location and navigation Symposium, Las Vegas, Nevada. [10]“A coordination methodology for RNSS inter-system
interference estimation”, ITU, 2007
[11]Oppenheim AV, Schafer RW, Buck JR (1999), “Discrete –time signal processing”, second edition, Prentice Hall, London.
[12]www.navipedia.com
[13]Stefan Wallner, Guenter W Hein and Jose- Angel Avila – Rodriguz, “Interference computation between several GNSS systems”, Institute of Geodesy and Navigation, University FAF Munich, Germany.
[14]S.Wallner and G.W.Hein, “Interference computation between GPS and Galileo”, ION,pp.1-15
[15]M MainulHoque and Novbert Jakowki, “Ionospheric Propagation Effects on GNSS signals and new correction approaches”, German Aerospace Center, Neustrelity,
Germany.
[16]Y Benigal, “Global ionospheric Scintillation model”
[17]Rene Warnat, “Atmospheric Perturbations on GNSS signals and their influence on time transfer”, Royal
observatory of Belgium, Brussels
[19]Elliot D. Kaplan, Christopher J. Hegarty, Artech House, “ Understanding GPS Principles and Applications”,
Artech House Publications
[20]GPS Navigation Toolbox GNT08.1.2
[21]Brandford W Parkison, James J Spilker, “Global Positioning System Theory and applications”, AIAA
series, Vol.164
[22]Eingereicht von, “On ground based GPS Tropospheric Delay and Estimation”, Disserbation weirde der
Universitat der Bundesuwehr Michen
[23]Dr NBS Srilatha Indira Dutt, Shaik Gowsuddin, “ionosphere Delay Estimation using Klobuchar Algorithm for single frequency GPS receiver”, IJARCE,
Vol2, Issue2 feb2013
![Figure-3 The multipath error envelope [in meters] versus the path delay in meters](https://thumb-us.123doks.com/thumbv2/123dok_us/1254613.1630919/5.595.56.294.505.746/figure-multipath-error-envelope-meters-versus-delay-meters.webp)