A Comparative Study of Flower Pollination Algorithm
and Bat Algorithm on Continuous Optimization
Problems
Nazmus Sakib
Department of Computer Science
and Engineering Ahsanullah University
of Science and
Technology Dhaka-1208,
Bangladesh
Md. Wasi Ul Kabir
Department of Computer Science
and Engineering Ahsanullah University
of Science and
Technology Dhaka-1208,
Bangladesh
Md Subbir
Rahman
Department of Computer Science
and Engineering Ahsanullah University
of Science and
Technology Dhaka-1208,
Bangladesh
Mohammad
Shafiul Alam
Department of Computer Science
and Engineering Ahsanullah University
of Science and
Technology Dhaka-1208,
Bangladesh
ABSTRACT
Nature is a rich source of inspiration, which has inspired many researchers in many ways. Nowadays, new algorithms have been developed by the inspiration from nature. The flower pollination algorithm is based on the characteristics of pollination process of flowers plants. Pollination is a natural biological process of mating in plants. In flowers, pollen is carried to stigma through some mechanisms that confirm a proper balance in the genetic creations of the species. Another nature inspired algorithm — the Bat algorithm is based on the echolocation behavior of bats. In this paper, the Flower pollination algorithm is compared with the basic Bat algorithm. We have tested these two algorithms on both unimodal and multimodal, low and high dimensional continuous functions. Simulation results suggest that the Flower pollination algorithm can perform much better than the Bat algorithm on the continuous optimization problems.
Keywords
Flower pollination algorithm, Bat algorithm, Swarm intelligence, Meta-heuristic optimization.
1.
INTRODUCTION
Many real-world optimization problems are very complex and challenging to solve, and many applications have to deal with these problems. To solve such problems, approximate optimization algorithms have to be used, though there is no guarantee that the optimal solution can be obtained [1]. Nature has been solving many problems for billions of years, and many kinds of biological systems have shown fascinating and remarkable efficiency in problem solving [2] [3] [4]. Over the last few decades optimization algorithms have been applied in extensive numbers of difficult problems. Several nature-inspired algorithms have been developed over the last few years by the scientific community [2] [4] [5]. Recently two new nature inspired algorithm, namely the Flower pollination algorithm (FPA) and the Bat algorithm (BA), have been developed [1].
For more than hundred million years, flower plants have been evolving. There are over 250 hundreds types of flower plants in the nature where flower species are three fourth of all plant species. Surprisingly from the beginning of the nature, flowering plants dominate the landscape [5] [6]. The reproduction of flower is achieved via the pollination process. Flower pollination can be described as the distribution processes of pollen through a wide range of pollinators such as insects, birds, bats and some other animals [7].
The Bat Algorithm is a swarm based algorithm which is established on the echolocation behavior of bats. The bats use echolocation to find its prey [8]. The Bat algorithm is a very recent swarm intelligence algorithm, introduced in 2010 [9]. After that a few improvements of Bat algorithm have been proposed in the literature, e.g., [10] [11] [12] [13]. In this paper, we compare the performance of the flower pollination algorithm with the basic Bat algorithm [14] [9].
The rest of this paper is organized as follows. Sections 2 and 3 describe the Flower Pollination Algorithm and the Bat algorithm. Section 4 provides details of the simulation and analysis of both these algorithms on the benchmarking problems, parameter settings of the algorithms and compares their results. Finally, section 5 draws the conclusion of this paper with a few comments and suggestions on future research.
2.
FLOWER POLLINATION
ALGORITHM
2.1
Characteristics of Flower pollination
In Biotic pollination, pollen is carried to the stigma by insects and animals [15] [16]. In Abiotic pollination, pollination occurs via wind or diffusion in water [15] [17]. Survey says that, 10% of pollination takes Abiotic pollination process which does not require any pollinators. Pollination can be achieved by two ways. They are self-pollination and cross-pollination. Cross-pollination process means pollination can be happened from pollen of a flower of a different plant. On contrary, self-pollination is the pollination of one flower, from pollen of the same flower or different flowers of the same plant, which often happens when there is no available pollinator [17] [15]. Biotic, cross-pollination may be happened in long distance. Bees, bats, birds and flies are mostly used as pollinators which are able to fly a long distance. So, these pollinators are considered as the carrier of the global pollination [5] [16]. Xin-She Yang describes this flower constancy and pollinator behavior in the pollination process into the following four rules [7]:
1. Biotic and cross-pollination is considered as global pollination process with pollen-carrying pollinators performing L´evy flights.
2. Abiotic and self-pollination are considered as local pollination.
3. Flower constancy can be considered as the reproduction probability is proportional to the similarity of two flowers involved.
4. Local pollination and global pollination is controlled by a switch probability p ∈ [0, 1]. Besides the physical
proximity and other factors like wind and water, local pollination can have a significant fraction p in the overall pollination process [18].
2.2
Global pollination and Local pollination
Global pollination process and Local pollination process are two key steps in Flower pollination algorithm [7]. In global pollination process, flower pollens are carried by pollinators. These pollens may travel over a long distance because pollinators can often fly and move in longer range. This global pollination can be represented mathematically as
(1)
Here is the pollen i or solution vector at iteration t, and
is the current best solution found among all solutions at the current iteration. Here λ is a scaling factor to control the step size. Hence, parameter is also the step size which corresponds to the strength of the pollination [5] [7] [18]. Since pollinators can be travelled over a long distance with different distance steps. Here, L´evy flight can be used to imitate this travelling characteristic [18]. Assuming fom a L´evy distribution
(2)
Here, Γ(λ) is the standard gamma function and L´evy distribution is valid for long steps . Therefore, Rule 2 and Rule 3 which are basically for the local pollination can be represented like
(3)
Here, and are pollen from different flowers of the same plant species. The equation imitates flower constancy in limited neighborhoods [5]. Assuming in mathematically if and
comes from the same species or selected from the same population, this equivalently becomes a local random walk if a graph can be drawn from a uniform distribution in [0, 1]. The pseudo code of the flower pollination algorithm is given below.
2.3
Pseudo code of Flower Pollination
Algorithm
1. Objective min or max 2. Initialize a population of n flowers/pollen gametes with
random solutions
3. Find the best solution in the initial population 4. Define a switch probability p ∈[0, 1]
5. while (t < MaxGeneration)
6. for i = 1 to n ( all n flowers in the population) 7. if rand < p
8. Draw a (d-dimensional) step vector L which obeys a L´evy distribution
9. Global pollination via 10. else
11. Draw ϵ from a uniform distribution in [0,1] 12. Local pollination via 13. end if
14. Evaluate new solutions
15. if new solutions are better, update them in the population
16.end for
17.Find the current best solution 18.end while
3.
BAT ALGORITHM
Bat algorithm is developed on the basis of bat’s hunting behavior. Bats are fascinating animals whose are also mammals with wings. Bats are born with the appealing innovative capability of echolocation. Microbats are insectivores. Echolocation is a special type of sonar, used by the Microbats to avoid obstacles, detect prey, and pinpoint their prey. Bats emit a high sound frequency to listen the echo that bounces back from the neighboring objects [13] [19] [20]. Bats use short, frequency-modulated signals to sweep through about an octave. Signal frequencies of bats varies depends on the species [21] [22].
Echolocation characteristics of Microbats emphasize on some of approximate rules, which are given below [9]:
i. Distance: Bats use echolocation to sense distance. They acknowledge the ranges/spaces between prey and surrounded barriers in some miraculous ways.
ii. Frequency: Bats fly randomly with velocity at position with a fixed frequency , varying wavelength λ and
loudness to search for prey. They can automatically adjust the wavelength of their emitted pulses and adjust the rate of pulse emission in the range of [0, 1], depending on the proximity of their target [22].
iii. Loudness: Though loudness can vary in many ways. Here we like to assume that the loudness differs from a large A0
to a minimum constant value .
3.1
Initialization of Bat Algorithm
Initial population is generated randomly by considering lower and upper boundaries with the dimension and the number of bats from the real valued vectors.
(4)
Where and are
3.2
Solution, Frequency & Velocity
Step size of a solution in Bat algorithm is defined by the frequency. Initially, frequency of Bat algorithm is set to random value for each solution in range of and . Then velocity is updated using the frequency for each solution using following equations.
(5) (6) (7)
Where ϵ indicates randomly generated number, represents global best solution. In r (pulse rate) probability, a solution is selected among the best solution and random walk is applied in order to increase exploration. Thus a new candidate solution is generated. [9].
(8)
is average loudness of all the bats, ϵ is uniform random number [22].
3.3
Loudness and Pulse Emission Rate
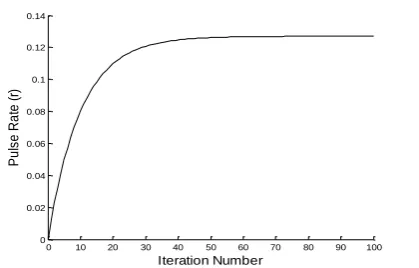
Loudness and pulse emission rate are updated as iterations proceed. When the bat gets closer to its prey, the loudness usually decreases and pulse emission rate increases [9] [22]. The loudness and pulse emission rate are updated by using the following equations:
(9) (10)
Where α and γ are constants which having the determined values for these equations. Here and are random values and can be normally [1,2] , while can be [ 0 , 1] normally [23].
Fig.1: Loudness (A) and Pulse Emission Rate (r) in Bat Algorithm
3.4
Pseudo code of Bat Algorithm
1. Objective function: 2. Initialize bat population xi and velocity
3. Define pulse frequency 4. Initialize pulse rate and loudness 5. while ( <maximum number of iterations)
6. Generate new solutions by adjusting frequency, updating velocities and location.
7. if (rand > )
8. Select a solution among the best solutions
9. Generate a local solution around the selected best solution
10. end if
11. if (rand < and 12. Accept new solutions
13. increase , reduce 14. end if
15. Rank the bats and find current best 16. end while
17. Display results.
4.
SIMULATION AND ANALYSIS
4.1
Benchmark functions
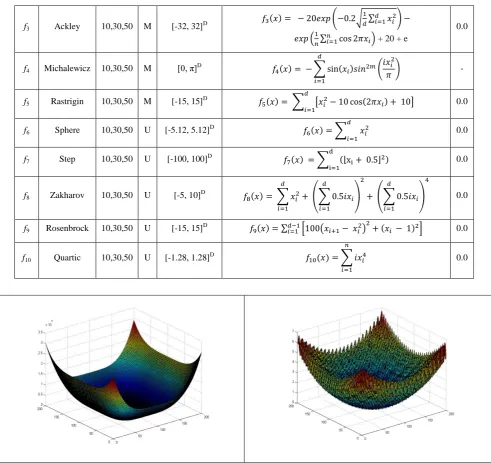
To compare the performance of the Bat algorithm (BA) [22] [24] and the Flower pollination algorithm (FPA) [7], we have used 10 benchmark functions, including five unimodal and five multimodal functions. The analytical form each function, along with their names, bounds of search space and global minimum values of the functions are shown in Table 1. Functions are tested with the dimension D = 10, 30 and 50. Both unimodal and multimodal functions are used in this experiment. For both the algorithms, the population size is fixed to 50. Algorithms are tested with 30 independent runs for each test function. All tests were carried out on a 64-bit operating system with a 2.1GHz CPU and 2GB RAM.
Table 1.Benchmark functions used in the experimental studies. Here, D: Dimensionality of the function, S: search space, C: function characteristics with values — U: Unimodal and M: Multimodal.
No. Name D C S Function Definition fmin
f1 Griewank 10,30,50 M [-600, 600]D
0.0
f2 Schwefel 10,30,50 M [-500, 500]D
0.0
0 10 20 30 40 50 60 70 80 90 100 0
0.2 0.4 0.6 0.8 1 1.2 1.4 1.6 1.8 2
Iteration Number
L
o
u
d
n
e
s
s
(
A
)
0 10 20 30 40 50 60 70 80 90 100 0
0.02 0.04 0.06 0.08 0.1 0.12 0.14
Iteration Number
P
u
ls
e
R
a
te
(
f3 Ackley 10,30,50 M [-32, 32]D
+ 20 + e
0.0
f4 Michalewicz 10,30,50 M [0, π]D
-
f5 Rastrigin 10,30,50 M [-15, 15]D
0.0
f6 Sphere 10,30,50 U [-5.12, 5.12]D
0.0
f7 Step 10,30,50 U [-100, 100]D
0.0
f8 Zakharov 10,30,50 U [-5, 10] D
0.0
f9 Rosenbrock 10,30,50 U [-15, 15]D 0.0
f10 Quartic 10,30,50 U [-1.28, 1.28]D
0.0
Fig. 2: 3D surface plots of 2D Quartic function (left) and Griewank function (right).
4.2
Parameter Settings
Both the algorithms are tested with 30 independent runs on each of the test functions listed in Table 1. The swarm size (i.e., no. of candidate solutions) is set to 50 for both algorithms. The number of generations is set to 1000, 1500 and 2000 for D = 10, 30 and 50 respectively for each run. Minimum frequency value
fmin is set to 0 while the maximum value fmax is set to 1 in the Bat
algorithm. Both α and λ in Bat algorithm are set to 0.9 in the simulation. We have used Matlab version R2013a for the simulation.
4.3
Experimental Results
For any swarm intelligence algorithm, there should be a balance between the degrees of explorations and exploitations with which the swarm members search across the search space. Too much exploitation at the expense of too little exploration may cause the algorithm to be trapped around the locally optimal
points, which makes it difficult or even impossible to find the global optimum. On the other hand, too much exploration at the cost of too little exploitation may make it difficult for the algorithm to converge and thus slows down the convergence speed and compromise the overall search performance. In the Bat algorithm, the loudness A and pulse emission rate r
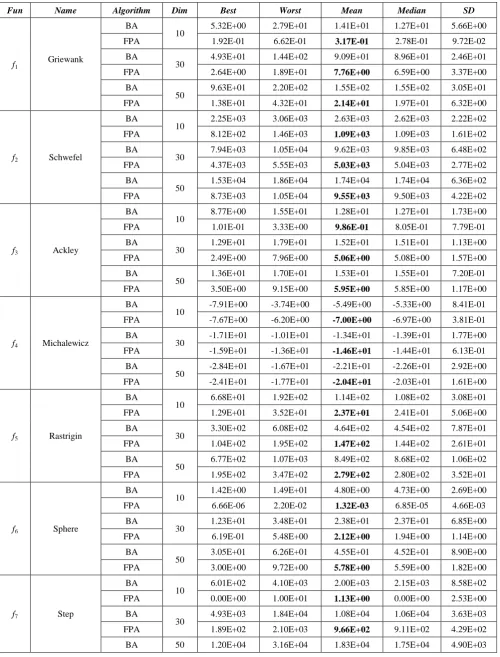
Table 2. Comparison between BA and FPA on 10 standard benchmark functions. All algorithms are run 30 different times on each of the functions. The best result for each function with each dimensionality is marked with boldface font
Fun Name Algorithm Dim Best Worst Mean Median SD
f1
Griewank
BA
10 5.32E+00 2.79E+01 1.41E+01 1.27E+01 5.66E+00
FPA 1.92E-01 6.62E-01 3.17E-01 2.78E-01 9.72E-02
BA
30 4.93E+01 1.44E+02 9.09E+01 8.96E+01 2.46E+01
FPA 2.64E+00 1.89E+01 7.76E+00 6.59E+00 3.37E+00
BA
50 9.63E+01 2.20E+02 1.55E+02 1.55E+02 3.05E+01
FPA 1.38E+01 4.32E+01 2.14E+01 1.97E+01 6.32E+00
f2 Schwefel
BA
10 2.25E+03 3.06E+03 2.63E+03 2.62E+03 2.22E+02
FPA 8.12E+02 1.46E+03 1.09E+03 1.09E+03 1.61E+02
BA
30 7.94E+03 1.05E+04 9.62E+03 9.85E+03 6.48E+02
FPA 4.37E+03 5.55E+03 5.03E+03 5.04E+03 2.77E+02
BA
50 1.53E+04 1.86E+04 1.74E+04 1.74E+04 6.36E+02
FPA 8.73E+03 1.05E+04 9.55E+03 9.50E+03 4.22E+02
f3 Ackley
BA
10 8.77E+00 1.55E+01 1.28E+01 1.27E+01 1.73E+00
FPA 1.01E-01 3.33E+00 9.86E-01 8.05E-01 7.79E-01
BA
30 1.29E+01 1.79E+01 1.52E+01 1.51E+01 1.13E+00
FPA 2.49E+00 7.96E+00 5.06E+00 5.08E+00 1.57E+00
BA
50 1.36E+01 1.70E+01 1.53E+01 1.55E+01 7.20E-01
FPA 3.50E+00 9.15E+00 5.95E+00 5.85E+00 1.17E+00
f4 Michalewicz
BA
10 -7.91E+00 -3.74E+00 -5.49E+00 -5.33E+00 8.41E-01
FPA -7.67E+00 -6.20E+00 -7.00E+00 -6.97E+00 3.81E-01
BA
30 -1.71E+01 -1.01E+01 -1.34E+01 -1.39E+01 1.77E+00
FPA -1.59E+01 -1.36E+01 -1.46E+01 -1.44E+01 6.13E-01
BA
50 -2.84E+01 -1.67E+01 -2.21E+01 -2.26E+01 2.92E+00
FPA -2.41E+01 -1.77E+01 -2.04E+01 -2.03E+01 1.61E+00
f5 Rastrigin
BA
10 6.68E+01 1.92E+02 1.14E+02 1.08E+02 3.08E+01
FPA 1.29E+01 3.52E+01 2.37E+01 2.41E+01 5.06E+00
BA
30 3.30E+02 6.08E+02 4.64E+02 4.54E+02 7.87E+01
FPA 1.04E+02 1.95E+02 1.47E+02 1.44E+02 2.61E+01
BA
50 6.77E+02 1.07E+03 8.49E+02 8.68E+02 1.06E+02
FPA 1.95E+02 3.47E+02 2.79E+02 2.80E+02 3.52E+01
f6 Sphere
BA
10 1.42E+00 1.49E+01 4.80E+00 4.73E+00 2.69E+00
FPA 6.66E-06 2.20E-02 1.32E-03 6.85E-05 4.66E-03
BA
30 1.23E+01 3.48E+01 2.38E+01 2.37E+01 6.85E+00
FPA 6.19E-01 5.48E+00 2.12E+00 1.94E+00 1.14E+00
BA
50 3.05E+01 6.26E+01 4.55E+01 4.52E+01 8.90E+00
FPA 3.00E+00 9.72E+00 5.78E+00 5.59E+00 1.82E+00
f7 Step
BA
10 6.01E+02 4.10E+03 2.00E+03 2.15E+03 8.58E+02
FPA 0.00E+00 1.00E+01 1.13E+00 0.00E+00 2.53E+00
BA
30 4.93E+03 1.84E+04 1.08E+04 1.06E+04 3.63E+03
FPA 1.89E+02 2.10E+03 9.66E+02 9.11E+02 4.29E+02
FPA 8.07E+02 4.73E+03 2.62E+03 2.32E+03 1.01E+03
f8 Zakharov
BA
10 3.29E+01 4.13E+04 1.51E+03 1.29E+02 7.52E+03
FPA 1.02E-04 2.52E-02 2.83E-03 5.90E-04 5.35E-03
BA
30 6.04E+02 2.87E+09 9.57E+07 1.10E+03 5.24E+08
FPA 2.66E+01 1.68E+02 6.76E+01 6.52E+01 2.84E+01
BA
50 1.13E+03 4.52E+11 1.51E+10 2.07E+03 8.26E+10
FPA 1.05E+02 7.36E+02 2.47E+02 2.19E+02 1.13E+02
f9 Rosenbrock
BA
10 1.56E+03 1.54E+05 5.29E+04 3.71E+04 4.76E+04
FPA 3.76E+00 3.88E+01 1.06E+01 8.99E+00 7.47E+00
BA
30 1.25E+05 1.17E+06 4.29E+05 2.87E+05 3.14E+05
FPA 1.03E+03 4.53E+04 8.28E+03 5.62E+03 8.61E+03
BA
50 1.73E+05 1.92E+06 8.78E+05 7.88E+05 3.95E+05
FPA 3.37E+03 8.31E+04 3.00E+04 2.82E+04 1.81E+04
f10 Quartic
BA
10 1.20E+00 2.12E+00 1.82E+00 1.85E+00 2.25E-01
FPA 9.59E-01 2.57E+00 2.13E+00 2.23E+00 2.96E-01
BA
30 9.70E+00 1.75E+01 1.29E+01 1.23E+01 2.22E+00
FPA 9.51E+00 1.14E+01 1.04E+01 1.03E+01 5.14E-01
BA
50 2.08E+01 4.06E+01 2.81E+01 2.69E+01 5.20E+00
FPA 1.80E+01 2.23E+01 1.97E+01 1.98E+01 8.54E-01
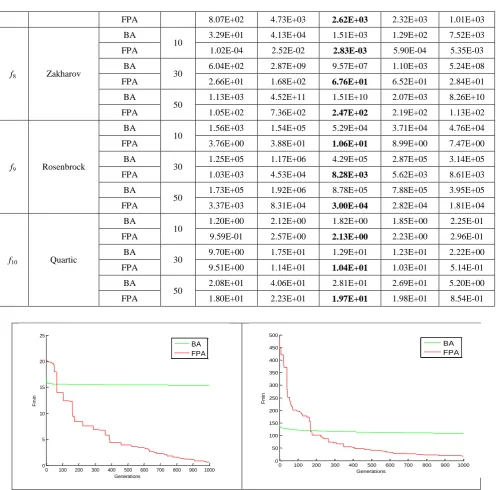
Fig. 3: Convergence characteristics of BA and FPA on the Step function f7 and Rastrigin function f5
On the other hand, the Flower pollination algorithm controls the degrees of explorations and exploitations with a switch probability p. In FPA the global and local pollination technique is used to balance between explorations and exploitations. In global pollination, the Lévy distribution is applied to generate new solutions; while in local pollination new solutions are generated using randomly selected local solutions. The Lévy distribution has the capability to generate new solutions with bigger mutation step size. Thus the algorithm is more likely to escape from the locally optimal points. From the experimental results, we can see that the Flower pollination algorithm show much improved results than the Bat algorithm on the continuous optimization problems.
For simulation, ten benchmark functions have been used in this experiment. Among them five functions are unimodal and five are multimodal. A unimodal function is one that has a single local minimum while a multimodal function is a function with many local minima. In Table 2, we can see that the solution
quality (mean value) is much better for FPA than BA on both multimodal and unimodal functions. Also the value of the standard deviation indicates that the result of FPA is more consistent. Bat algorithm gets trapped (Fig. 3) in some poor local minima, far from the global minimum. Thus the convergence characteristic of FPA is also much better than BA.
5.
CONCLUSION
This paper presents a comparative study between two swarm intelligence based algorithms — the Flower Pollination algorithm [7] [25] and the Bat algorithm [9]. Both these algorithms use swarm intelligence to find the global optimum value of the continuous optimization problems. Numerical results on the standard benchmark problems for Bat algorithm and Flower pollination algorithms demonstrate the effectiveness and competitiveness of the algorithms. The flower pollination algorithm outperforms the Bat algorithm in terms of the final solution quality in most of the functions. The main reason of the
0 100 200 300 400 500 600 700 800 900 1000
0 5 10 15 20 25
Generations
Fm
in
BA FPA
0 100 200 300 400 500 600 700 800 900 1000
0 50 100 150 200 250 300 350 400 450 500
Generations
Fm
in
performance difference is the relatively smaller amount of search space explorations by the Bat algorithm, which may lead it towards premature convergence around the locally optimal points, failing to locate the globally optimum point. There has been a few research works (e.g., [8] [11] [26]) that try to improve the performance of the original Bat algorithm. In future we plan to compare these algorithms with the Flower Pollination algorithm as well as some more evolutionary and swarm intelligence based algorithms, such as the Artificial Bee Colony algorithm [27], Differential Evolution [28] and [29].
6. REFERENCES
[1] Y. Xin-She, Engineering Optimization: An Introduction with Metaheuristic Application, Wiley, 2010.
[2] H. A. Abbass and R. Sarker, "The Pareto diffential evolution algorithm," Int. J. Artificial Intelligence Tools,
vol. 11(4), pp. 531-552, 2002.
[3] Y. Xin-She, "Nature-inspired Metaheuristic Algorithms," Luniver Press, 2008.
[4] K. Deb, Multi-Objective optimization using evolutionary algorithms, New York: John Wiley & Sons, 2001. [5] Y. Xin-She, K. Mehmet and H. Xingshi, "Multi-objective
Flower Algorithm for Optimization," in International
Conference on Computational Science, ICCS 2013, 2013.
[6] M. Walker, "How flowers conquered the world," BBC Earth News, 10 July 2009.
[7] Y. Xin-She, "Flower pollination algorithm for global optimization," Unconventional Computation and Natural Computation, Lecture Notes in Computer Science, vol. 7445, p. 240–249, 2012.
[8] G. Wang and L. Guo, "A Novel Hybrid Bat Algorithm with Harmony Search for Global Numerical Optimization,"
Journal of Applied Mathematics, vol. 2013, p. 21, 2013. [9] Y. Xin-She, "A New Metaheuristic Bat-Inspired
Algorithm, Nature Inspired Cooperative Strategies for Optimization (NISCO 2010)," Springer, vol. 284, no. Springer Berlin,, pp. 65-74 , 2010.
[10]K. Khan and A. Sahai, "A Comparison of BA, GA, PSO, BP and LM for Training Feed forward Neural Networks in e-Learning Context," I.J. Intelligent Systems and Applications, pp. 23-29, June 2012.
[11]N. S. S. M. M. S. A. Md. Wasi Ul Kabir, "A Novel Adaptive Bat Algorithm to Control Explorations nd Exploitations for Continuous Optimization Problems,"
International Journal of Computer Applications , vol. 94, no. 13, 2014.
[12]A Rekaby, "Directed Artificial Bat Algorithm (DABA) A New Bio-Inspired Algorithm," in International Conference on Advances in Computing, Communications and Informatics (ICACCI), Cairo, 2013.
[13]Y. Selim and U. K. Ecir, "Improved Bat Algorithm (IBA) on Continuous Optimization Problems," Lecture Notes on Software Engineering, vol. 1, no. 3, pp. 279-283, 2013. [14]G. Q. Huang, W. J. Zhao and Q. Q. Lu, "Bat algorithm
with global convergence for solving large scale
optimization problem," Application Research of Computers , vol. 30, no. 3, pp. 1-10, 2013.
[15]K. Gaganpreet and D. S. Dr., "Pollination Based Optimization or Color Image Segmentation," International Journal of Computer Engineering and Technology (IJCET), vol. 3, no. 2, pp. 407-414, July-September 2012. [16]K. S, "Pollination based optimization," in 6th International
Multi Conference on Intelligent Systems, Sustainable, New and Renewable Energy Technology and Nanotechnology (IISN2012), March 16-18,2012.
[17]N. Waser, "Flower constancy: definition, cause and measurement," The American Naturalist, 1986.
[18]A.-R. Osama, A.-B. Mohamed and E.-h. Ibrahim, "A Novel Hybrid Flower Pollination Algorithm with Chaotic Harmony Search for Solving Sudoku Puzzles,"
International Journal of Engineering Trends and Technology (IJETT), vol. 7, no. 3, pp. 126-132, January 2014.
[19]J. Altringham, Bats: Biology and Behaviour, Oxford University Press, 1996.
[20]T. Colin, The Varienty of Life, Oxford University Press, 2000.
[21]A. Faritha and C. Chandrasekar, "An optimized approach of modified bat algorithm to record deduplication,"
International Journal of Computer Applications, vol. 62, no. 1, pp. 10-15, 2012.
[22]Y. Xin-She, "Bat Algorithm for Multiobjective Optimization," International Journal Bio-Inspired Computation, vol. 3, no. 5, pp. 267-274, 2011.
[23]X. S. Yang, "Harmony Search as a Metaheuristic Algorithm,Music-Inspired Harmony Search Algorithm,"
Theory and Applications,Studies in Computational Intelligence, vol. 191, pp. 1-14, 2009.
[24]X. S. Yang and J. R. Gonzalez, ""A New Metaheuristic Bat-Inspired Algorithm" in Nature Inspired Cooperative Strategies for Optimization (NISCO 2010)," Springer Press, vol. 284, pp. 65-74, 2010.
[25]S. Yang X, "Nature-inspired Metaheuristic Algorithms," Luniver Press, 2008.
[26]Y. Selim and K. E. U. , "Improved Bat Algorithm (IBA) on Continuous Optimization Problems," Lecture Notes on Software Engineering, vol. 1, no. 3, pp. 279-283, August 2013.
[27]K. Dervis and O. Celal, "A novel clustering approach: Artificial Bee Colony (ABC) algorithm," Applied Soft Computing, Elsevier, vol. 11, pp. 652-657, 2011.
[28]S. Rainer and P. Kenneth, "Differential Evolution – A Simple and Efficient Heuristic for Global Optimization over Continuous Spaces," Journal of Global Optimization,
Kluwer Academic Publishers, pp. 341-357, 1997.